61
PARALLEL BEAM NEUTRON COMPUTED TOMOGRAPHY RECONSTRUCTION WITH
VARIOUS FILTERS
PEMANFAATAN MATLAB UNTUK REKONSTRUKSI NEUTRON COMPUTED
TOMOGRAPHY BERKAS PARALEL DENGAN BERBAGAI FILTER
Mardiyanto1, Bharoto1, Sutiarso1, Maharini Ahsani Ummi2
1 Center for Technology of Nuclear Industry Materials, National Nuclear Energy Agency (BATAN) 2Department of Mathematic, Bandung Institute of Technology
e-mail: [email protected]
Received 15 June 2013, received in revised form 17 December 2013, accepted 03 February 2014
ABSTRACT
PARALLEL BEAM NEUTRON COMPUTED TOMOGRAPHY RECONSTRUCTION WITH VARIOUS FILTERS. This paper presents a simple calculation using the MatLab application code for five different filter functions to obtain the best image quality for parallel beam neutron computed tomography. Shepp-Logan, Ramachandran-Lakshminarayanan, Cosine, Hamming and Hann Filter and without filter were used for a cross-section of a car coil ignitor reconstruction. The reconstruction was also done by varying the number of projections namely 180, 90, 45 and 12. The quality of the image can be determined by viewing the image directly or by using grey level curve to show the signal to noise image. The good images were determined by their signal-to-noise ratio (SNR) value. The high SNR values were obtained from the images which were reconstructed by using hamming and Hann filter. On the other hand the lowest SNR was obtained when the image was reconstructed without any filter. The number of the projections were also influenced the image quality, the more the projection number is used the better the image quality is obtained.
Keywords : Tomography, MatLab, filter, imaging/reconstruction ABSTRAK
PEMANFAATAN MATLAB UNTUK REKONSTRUKSI NEUTRON COMPUTED TOMOGRAPHY BERKAS PARALEL DENGAN BERBAGAI FILTER. Telah dilakukan perhitungan sederhana menggunakan Matlab untuk lima fungsi filter yang berbeda untuk mendapatkan kualitas gambar terbaik dari neutron computed tomography berkas paralel. Shepp-Logan, Ramachandran-Lakshminarayanan, kosinus, Hamming dan Hann Filter dan tanpa filter yang digunakan dalam merekonstruksi tampang lintang dari koil pengapian mobil. Selain itu, rekonstruksi dilakukan dengan memvariasikan jumlah proyeksi yaitu 180, 90, 45 dan 12. Kualitas gambar dapat ditentukan dengan melihat gambar secara langsung atau dengan menggunakan kurva tingkat abu-abu untuk menunjukkan sinyal dan kebisingan gambar. Gambar-gambar yang baik diperoleh dari perbandingan sinyal / noise besar (SNR) yaitu gambar yang direkonstruksi dengan menggunakan Hamming dan Hann filter. Di sisi lain SNR terendah diperoleh ketika gambar direkonstruksi tanpa filter apapun. Jumlah proyeksi juga berpengaruh terhadap kualitas gambar, semakin banyak jumlah proyeksi semakin baik kualitas gambar. Kata kunci: Tomografi, Matlab, Filter, pencitraan/rekonstruksi
INTRODUCTION
ndustrial technology has developed very fast in parallel with the invention of a high speed computer. Various techniques have been developed for improving the quality of industrial products by adopting the high technology computer. The improvement has been carried out both in the qualities of the products as well as the efficiency of the production.
Nondestructive testing has become one of the techniques which has been used as the complement of a destructive testing for the product improvement and medical test such as Computed Tomography (CT) scanning. Recently, CT has been used not only for medical test purposes but also for the industrial technology (1-7).
62
various filter functions are carried out in this paper. The reconstruction technique is based on the Radon Transform which was proposed by G.T. Herman (9). The theory of filter function has been presented in many books on image
processing. It is predicted that the number of projection is one of the variables which determines the qualities of the reconstructed image. The larger the number of projections is used the better the quality of the image is obtained. X-ray Computed Tomography (XCT) has reached a mature technology and Neutron Computed Tomography (NCT) has become a complement of XCT (10-13). Briefly tomographic reconstruction process can be illustrated in the
following block diagram (Figure 1) (14).
Figure 1. Tomographic Reconstruction Block Diagram.
METHODOLOGY
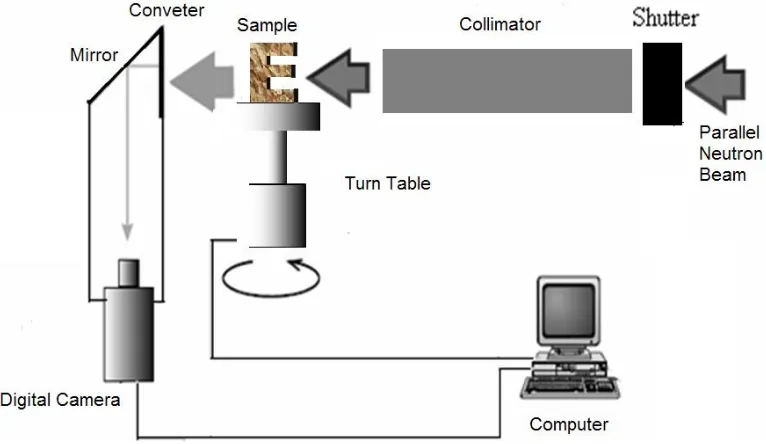
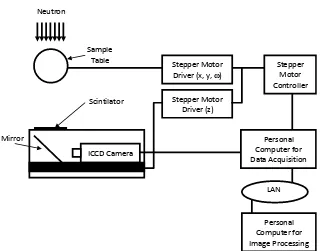
The neutron television system (NTV) can be used to make a neutron tomography system by improving the hardware namely by addition of a turn table and data acquisition and tomography reconstruction software as shown in Figure 2. PTBIN-BATAN Neutron TomographyFacilities are shown in Figure 3.
Figure 2. Neutron Computed Tomography Measurement System.
63 Figure 3. PTBIN-BATAN Neutron Tomography Facilities.
Figure 4. Toyota Kijang Car Ignitor Coil.
A parallel medium neutron beam passed through the object and the transmitted beam was measured by using the Andor’s low light CCD camera (Figure1). The data were called as one projection data. In order to know the influence of the number of projection to the image qualities, 180 projections were made by turning the object 180o
with the step of 1o.
The next step was to make the reconstruction software. The tomography reconstruction software was made based on the convolution and back projection which is explained somewhere else(8,9). Based on the theory, a
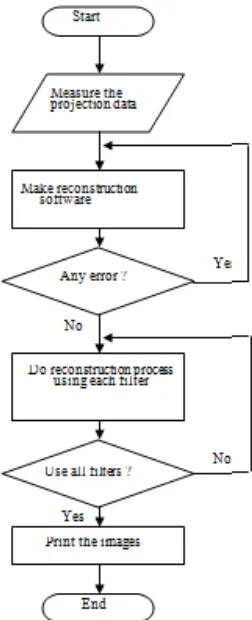
reconstruction software was made by using MatLab 7.11 and the five filter functions were used shown in Table 1. The solution that has been implemented is based on the use of Matlab functions i.e. radon and iradon to complete the Filtered Back-projection process. Finally, by using the measured data which have been obtained the reconstruction was done. The reconstruction was done for the data with 1, 2, 4, 10 and 15 step degrees for each filter function. The flow chart of the reconstruction process is shown in Figure 5.
64
Figure 5. Flow chart of the tomography reconstruction process.
Table 1. Window Functions and a discrete filter function
Filter Resp. Freq. H(
Ram-Lak HRL() rect(d)
Shepp-Logan sinc(d) rect(d)
Cosine cos(d) rect(d)
Hamming [+(1-)cos(2d)]. rect(d)
Hann 0.5 + 0.5 * cos ( /c)
RESULTS AND DISCUSSION
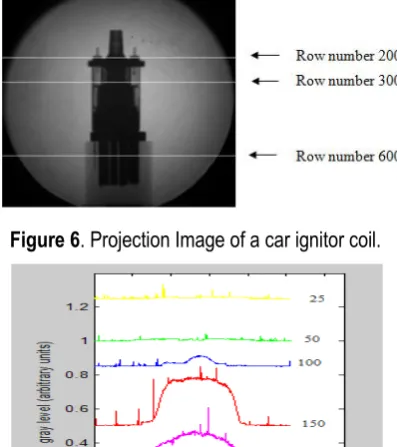
One of the projection images of the car ignitor coil is shown in Figure 6. The white lines shown in Figure 6 are the position of the cross section of the car ignitor coil which were reconstructed by using five filters as tabulated in Table 1 and without any filter. The results of the reconstructions are shown in Figure 16 for three different slice positions.
Figure 7 shows curves of grey level intensity of the projection image (Figure 6) at 5 different row positions i.e. 25, 50, 100, 150 and 250. The five curves show that there are many spikes in each grey level intensity curve. The
65 electronic noise. From the curves it can also be seen that the neutron intensity distribution in the imaging field is not homogeneous due to the imperfectness of the collimator design. The high neutron intensity is found within an area of 15 cm diameter in the center of the neutron beam and it is gradually decreasing radially
Figure 6. Projection Image of a car ignitor coil.
Figure 7. The intensity of slice Projection at the different row number.
Figure 8. Five low pass filters used for CT reconstruction (15).
66
(a) Shepp Logan Filter (b) Ram-Lak Filter
(c) Cosine Filter (d) Hamming Filter
(e) Hann Filter (f) Without any Filter
Figure 9. Tomography Image reconstruction of a car ignitor coil (line 500 and with 10 step).
A filter is used to get an original signal from a noisy signal that is obtained from a measurement. In computed tomography (CT), there are many types of noises such as star like artifact, ring artifact, and random noise. These noises spread over from low to high frequencies. The ideal ramp filter can not be practically implemented since the gain on this filter is infinite at an infinite frequency. However, wmax is the highest spatial frequency in the projection
and therefore we can truncate the function at wmax resulting in the Ram-Lak filter. It can be seen in Figure 8.(a),
67 order not to lose the high frequency information, but on the other hand the sampling rate is restricted by the design of the machine. The best approximation is that the bandwidth is equal to 1/d, where d is the spacing between two lines in one projection.
(a)
(b)
(c)
Figure 10. Grey level of horizontal pixel of the Tomography image shown by horizontal white line in Figure 9. Figure 9 shows the results of the neutron tomography reconstruction of the car ignitor when the 500th slice
was reconstructed with 180 projections or 10 sample rotation step. It can be seen from the images that by using five
different filters, the reconstruction process produced almost similar images namely all the coil components at that slice appear clearly. Unfortunately, some ring artifacts are shown too. To reduce these artifacts it may be done by recalibrating the detector or using high resolution neutron screen conveter, so that the response of each radiation ray will be same. Figure 9.(f) shows the image of the car ignitor when it was recontructed without any filter and a blurred image was obtained. It may caused by hardware system resolution.
68
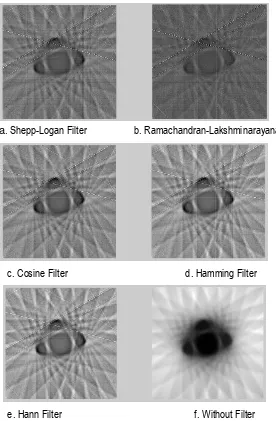
a. Shepp-Logan Filter b. Ramachandran-Lakshminarayanan Filter
c. Cosine Filter d. Hamming Filter
e. Hann Filter f. Without Filter
Figure 11. Reconstruction with 10 step projection for slice 200.
However, both signal and noise are seen clearly with the different noise level when the five filters were used. By using these curves it can be determined their signal to noise ratio (SNR) qualitatively. The lowest noise level was obtained when Hann filter was used.
69 c. Cosine Filter d. Hamming Filter
e. Hann Filter f. Without Filter
Figure 12. Reconstruction with 20 step projection for slice 200.
a. Shepp-Logan Filter b. Ramachandran-Lakshminarayanan Filter
70
e. Hann Filter f. Without Filter
Figure 13. Reconstruction with 40 step projection for slice 200.
a. Shepp-Logan Filte b. Ramachandran-Lakshminarayanan Filter
c. Cosine Filter d. Hamming Filter
e. Hann Filter f. Without Filter
71
a. Shepp-Logan Filter b. Ramachandran-Lakshminarayanan Filter
c. Cosine Filter d. Hamming Filter
e. Hann Filter f. Without Filter
Figure 15. Reconstruction with 150 step projection for slice 200.
Figure 11 to 15 show the image reconstruction results for 1, 2, 4, 10 and 150 rotation step. From those
figures it can be seen that the best image was obtained when the smallest rotation step was reconstructed namely as shown in Figure 10. In this facility the maximum projection is 360 projectionsor 0.50 rotation step and it depends
on the stepper motor being used. The star like artifact becomes more severely when the number of the rotation step is smaller.
72
(b)
(c)
Figure 16. Reconstruction with 10 step projection for slice 200, 300 and 600.
Figure 16 shows the results of the three different slice positions (200, 300 and 600) images with 180 reconstruction projections. In this paper only three different slices were reconstructed and shown. The reconstruction can be done for 1024 different slices or it is as high as the maximum resolution of the CCD camera.
CONCLUSION
By doing a very simple research, a comparative study of the utilization of various filter functions and five different projections was obtained. The calculation was done by using five different filter functions and by varying the projection number (180, 90, 45 and 12 projections) to obtain the best image qualities for parallel beam neutron computed tomography. Shepp-Logan, Ramachandran-Lakshminarayanan
,
Cosine, Hamming and Hann Filter were used in reconstructing a cross-section of a car ignitor coil. The quality of the image can be determined by viewing the image directly or by using grey level curve to show the signal and the noise of the image. The good images were obtained from the large signal/noise ratio (SNR) i.e. the images which were reconstructed by using hamming and Hann filter. On the other hand the lowest SNR was obtained when the image was reconstructed without any filter. Moreover, by increasing the projection number the better the image quality is obtained.REFERENCES
1. IAEA-TECDOC-1589, Industrial Process Gamma Tomography Final report of a coordinated research project 2003–2007, http://www-pub.iaea.org/ MTCD/ publications/ PDF/te_1589_web.pdf, down loaded on January 15, (2013)
2. R. CHRISTOPH and H.J. NEUMANN, X-ray Tomography in Industrial Metrology, Precise, Economical and Universal, Printed in Germany 236020, ISBN 978-3-86236-020-8, (2011)
73 4. L. BUNGER, J.M. MACFARLANE, N.R. LAMBE, J. CONINGTON, K.A. McLEAN, K.MOORE, C.A.
GLASBEY, G.SIMM, Use of X-Ray Computed Tomography (CT) in UK Sheep Production and Breeding, Sustainable Livestock Systems Group, Scottish Agricultural College, Edinburgh, UK(2011) 329-349
5. A.M. SHAIKH, Applications of various imaging techniques in neutron radiography at BARC, Trombay, 18th World Conference on Nondestructive Testing, Durban, South Africa (2012) 1208-1217
6. I. M. FIJAŁ-KIREJCZYK, J. J. MILCZAREK, M. J. RADEBE, F. C. DE BEER, J. ŻOŁĄDEK-NOWAK, Neutron
Radiography Applications in Studies of Drying of Capillary-porous System, Drying Technology: An International Journal, Volume 31, Issue 8, Special Issue: Selected Papers from EuroDrying'2011 (2013) 872-880
7. N. KARDJILOV, F. FIORI, G. GIUNTA, A. HILGER, F. RUSTICHELLI, M. STROBL, R. TRIOLO, and J. BANHART, Neutron tomography for archaeological investigations, Journal of Neutron Research 14(1), (2006) 29–36
8. Z.H. CHO and J.K. CHAN, A Comparative Study of 3-D Image Reconstruction Algorithms with Reference to Number of Projections and Noise Filtering, IEEE Trans. On Nuclear Science, Vol. NS-22 (1975) 344-358 9. G.T. HERMAN, Image Reconstruction from Projections, Academic Press, Inc. (London) LTD.(1980)
10. D. SCHWARZ, P. VONTOBEL, E. H. LEHMANN, C. A. MEYER, and G. BONGARTZ, Neutron Tomography of Internal Structures of Vertebrate Remains: A Comparison With X-Ray Computed Tomography, Palaeontologia Electronica, http://palaeo-electronica.org, down loaded on September 25, (2013)
11. A. KUBA, L. RODEK, Z. KISS, L. RUSKO, A. NAGY, M. BALASKO, Discrete tomography in neutron radiography, Nuclear Instruments and Methods in Physics Research A 542 (2005) 376–382
12. M. I. SILVANI, G. L. D. ALMEIDA, R. C. A. A. FURIERI, Thermal Neutron Computed Tomography at the Argonauta Reactor, Brazilian Journal of Physics, vol. 35, no. 3B (2005) 775-778
13. H. EGBERT, R. WALKER, R. FLOCCHINI, Neutron Tomography and Space, the University of California, Davis-McClellan Nuclear Radiation Center McClellan, California, USA 5335 Price Ave. McClellan, CA. 95652 916-614-6200 (2007)
14. J. FESSLER., Analytical Tomographic Image Reconstruction Methods, November 19, 2009. http://web.eecs. umich.edu/~fessler/course/516/l/ c-tomo.pdf, down loaded on January 28, (2013)