1
THE IMPACT OF CORPORATE GOVERNANCE ON INTELLECTUAL CAPITAL AND FIRM VALUE: EVIDENCE FROM INDONESIA AND MALAYSIA CONSUMER GOODS
Saarce Elsye Hatane, Adeline Tertia Djajadi, and Josua Tarigan
International Business Accounting Petra Christian University Email: [email protected]
ABSTRACT
The purpose of this research is to analyze the direct impact of corporate governance on firm value and its indirect impact using intellectual capital as the intervening variable and comparing the impact between Indonesia and Malaysia. Corporate governance is measured by managerial ownership, board size, and board composition. Intellectual capital is measured by value added intellectual
coefficient. Firm value is measured by Tobin’s Q. This research is conducted upon consumer goods sector in Indonesia Stock Exchange and Bursa Malaysia during 2010-2015, with the total of 25 companies or 150 firm-year (Indonesia) and 106 companies or 636 firm-year (Malaysia). Multiple regression analysis is used to examine the model. The findings demonstrate mixed results. Managerial ownership has a significant impact on intellectual capital and firm value in both countries, it is positive in Indonesia, but negative in Malaysia. Board size and board composition do not have any significant influence towards the intellectual capital in Indonesia, but it is significant in Malaysia. The impact of both variables is also significant on firm value for Indonesia, but only board size is significant in Malaysia. Intellectual capital shows no significant correlation with firm value in Indonesia while it is significant in Malaysia.
Keywords: Corporate Governance, Managerial Ownership, Board Size, Board Composition, Intellectual Capital, Firm Value, Consumer Goods Sector, Indonesia, Malaysia.
INTRODUCTION
In the aftermath of big corporation collapses, organizations around the world have been increasingly concerned about their corporate governance (CG) practice. In Asia, the interest in CG was triggered by the Asian financial crisis in 1997-1998, increasing the attention of Asian companies to reassess their weak CG practice (Cabalu, 2015). Although a number of initiatives have been taken, the reformation progress was uneven. In a survey conducted by the Asian Development Bank Institute (2004), 4 countries were identified as the worst victims of the crisis: Indonesia, Korea, Thailand, and Malaysia. However, after the crisis, Malaysia was ranked first as the country with the highest quality of CG while the other 3 countries had similar scores. Along with more recent survey that found similar results (ADB, 2016), it indicates that Malaysia has developed a much stronger CG practice than Indonesia. Generally, CG serves as a mechanism to monitor and control managers so that decisions are made for the best interest of
the shareholders (Siagian et al., 2013).
Accordingly, it is claimed that companies with
better CG practice will have higher values (Arora & Sharma, 2016; Siagian et al., 2013).
At the same time, with the rapid advancement of technology, the global economy has shifted from the traditional way of monitoring operations to the modern approach of value creation (Ting & Lean, 2009). Particularly, with the commencement of the
ASEAN Economic Community (AEC),
companies must be able to utilize their resources more effectively and efficiently in order to compete and create sustainable value (Pratama, 2016). Hence, the management of intellectual capital (IC) becomes critical in
today’s knowledge-based economy.
IC is the knowledge within an organization which is able to create value when it is utilized in line with the mission, vision, and goals of the organization (APICC, 2017). It is considered as a strategic resource that is vital in creating sustainable growth (Zeghal & Maaloul, 2010). According to Keenan and Aggestam (2001), CG is responsible for creating, developing, and leveraging IC. This paper focuses on the board of directors as it is the main organ of CG system that is capable of improving the performance of the company (Chahal & Kumari, 2013). The
2
and participation in strategic plans make it crucial to provide competitive advantages, create value, and serve as the sources of IC (Berezinets et al., 2016).
The consumer goods sector in the manufacturing industry has been chosen as the object of the study. The manufacturing industry of both Indonesia and Malaysia are among the largest contributors to their respective economy (BPS, 2017; DOSM, 2017).
LITERATURE REVIEW Corporate Governance in Indonesia
The social, economic, and political environment in Indonesia were heavily damaged by the Asian financial crisis in 1997-1998. However, the event is a stepping stone for the CG initiatives in the country. A national committee on CG (NCG) was established in
1999 and they issued the first Indonesia’s Code
of CG in 2001 before it was revised in the latest
2006 version (International Finance
Corporation Advisory Services in Indonesia, 2014). Limited liability companies in Indonesia adopt the two-tier board system where there is a supervisory board, called the board of
commissioners (BOC), sitting between
shareholders and the board of directors (BOD). BOC is responsible for overseeing and providing advice to BOD while the BOD is responsible for the day-to-day management of
the company (International Finance
Corporation Advisory Services in Indonesia, 2014).
Corporate Governance in Malaysia
Malaysia is more advanced in its corporate regulatory environment even before the Asian financial crisis hit them in 1997-1998. Among other regulations, listed companies are already required to have independent directors on their boards (Cabalu, 2015). However, CG attracted, even more, attention after the crisis. Malaysian companies adopt the unitary or one-tier board system where there is only one board, called the BOD, that is responsible for both management oversight and performance evaluation roles (Securities Commission Malaysia, 2012).
Managerial Ownership
According to agency theory, managerial ownership (BOWN) works as a direct incentive for managers to act in line with shareholders’ interest (Kamardin & Haron, 2011). By holding
portions of the company’s ownership,
managers will put a focus on the long-term value of the company and make an investment that enhances the long-term value, such as IC investments (Saleh et al., 2009). Therefore, a greater percentage of stocks owned by the managers will help align the interests of managers and that of the shareholders. Managerial ownership is measured by the ratio of shares owned by the board to total outstanding ordinary shares (Kamardin & Haron, 2011; Noradiva et al., 2016; Saleh et al., 2009).
Board Size (BS)
Agency theorists argue that smaller boards are more effective. The larger board has been said as having communication and coordination problems, hence, unable to properly control the management (Appuhami & Bhuyan, 2015). As the size increases, it may also be difficult to reach timely decisions because of slower proceedings (Kamardin & Haron, 2011). In contrast, other literature suggests that larger boards provide the company with more diversity and larger pool of expertise (Appuhami & Bhuyan, 2015). More people in the board means better allocation of responsibilities so that they can effectively monitor managers. In addition, a larger board provides more links to the external environment
which improves the company’s access to an
array of resources, such as IC, that eventually improves its performance (Jackling & Johl, 2009).
Board Composition
Board composition (BCOMP) refers to the proportion of independent directors on the
board. According to agency theory,
independent directors help enhance the effectiveness of monitoring and control over management (Appuhami & Bhuyan, 2015). They also have diverse roles and a multitude of resources that help execute strategy and evaluate managers’ decisions. In contrast, the stewardship theorists argue that greater proportion of independent directors is not preferable. It is the non-independent directors
who influence the company’s performance with
a better understanding of the business and superior decisions (Gaur et al., 2015).
Intellectual Capital (IC)
3
a sustainable competitive advantage and
superior performance to the company
(Kozlenkova et al., 2013). IC has been said as the only resource that corresponds to the resource-based theory as it is the core of value creation and competitive advantage (Pratama, 2016). Although IC definitions vary, all of them emphasize on its growing importance as knowledge-based capital and its link with value creation.
The Value Added Intellectual Capital (VAIC) model was first developed by Pulic in 1998. The concept of VAIC is in relation to the corporate intellectual ability that refers to the efficiency of total value creation created by two resources (IC and physical resources) that work simultaneously in a business environment (Pulic, 2004). VAIC offers a relatively simple quantitative approach based on financial statements which are publicly available and derived from an identifiable source. Below are the steps to calculate VAIC:
1. Value Added (VA) = 𝑂𝑃 + 𝐸𝐶 + 𝐷𝑃 + 𝐴
Where OP is operating profit, EC is total employee expense, DP is depreciation, A is amortization.
2. Human Capital Efficiency(HCE)= VA/HC
Where HC is human cost or total salaries and wages.
3. Structural Capital Efficiency (SCE) =
SC/VA
Where SC is structural capital or value added minus human cost.
4. Intellectual Capital Efficiency (ICE) =
HCE+CEE
5. Capital Employed Efficiency (CEE) =
VA/CE
Where CE is capital employed.
6. Value Added Intellectual Coefficient
(VAIC) = ICE + CEE
Firm Value
Due to the limitations of VAIC, the research attempts to link it the company’s value. Firm value is a long-term measure of performance as it is reflected in the share price of the company in the market. Generally, high firm value provides confidence to investors regarding the current performance and future growth of the company. One measurement of firm value is
Tobin’s Q. Compared to accounting profit rate,
Tobin’s Q is a forward-looking tool that reflects
investors’ valuation for the corporate
opportunity. It has been argued as a good indicator of firm value where higher Q value
represents the competitive advantage for the company. Below is the formula to calculate
Tobin’s Q (TBQ):
𝑇𝐵𝑄 =𝑀𝑉𝐸 + 𝑃𝑆 + 𝐷𝑒𝑏𝑡 𝑇𝐴
Where MVE is the market value of equity or stock closing price at year end × the number of outstanding shares, PS is preferred stock, TA is book value of total assets.
RESEARCH METHODOLOGY
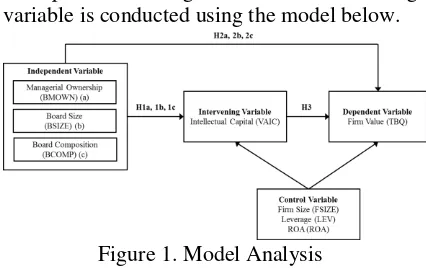
The research will perform analysis on the independent (managerial ownership, board size, board composition as independent variables), intervening (IC), and dependent (Firm value) variables. Firm size, leverage, return on asset as control variables.
The data used in this research is secondary data retrieved mainly from annual reports,
Bloomberg, and Yahoo Finance. The
population are consumer goods companies in
Indonesia Stock Exchange (IDX) and Bursa
Malaysia in 2010-2015 with total of 38 and 123. Using purposive sampling, four criteria are established to determine the sample: 1) Listed
in consumer goods in IDX or Bursa Malaysia,
2) Have initial public offering before 2010, 3) Publish complete annual report 2010-2015, 4) Have its share price in Yahoo Finance. After elimination, the companies are 25 (Indonesia) and 106 (Malaysia), hence, 150 firm-year and 636 firm-year. After data testing and trimming, the observations become 127 firm-year (Indonesia) and 328 firm-year (Malaysia).
Research Model
Multiple Linear Regression with intervening variable is conducted using the model below.
Figure 1. Model Analysis
𝑉𝐴𝐼𝐶 = 𝛼 + 𝛽1𝐵𝑀𝑂𝑊𝑁 + 𝛽2𝐵𝑆𝐼𝑍𝐸 + 𝛽3𝐵𝐶𝑂𝑀𝑃 + 𝛽4𝐹𝑆𝐼𝑍𝐸 + 𝛽5𝐿𝐸𝑉 + 𝛽6𝑅𝑂𝐴 + 𝜀
4
For Indonesia, the calculation for each CG variable is separated between the BOD and BOC (i.e. BMOWN is separated into BODMOWN and BOCMOWN).
RESULTS
The T-test results can be seen in Table 3. For the adjusted R2, Table 1 shows that
Indonesia are 66.9% and 87.3% while Malaysia are 62.3% and 31.5%. The F-test of both models in both sample is 0.000.
Table 1. Adjusted R2 and F-test
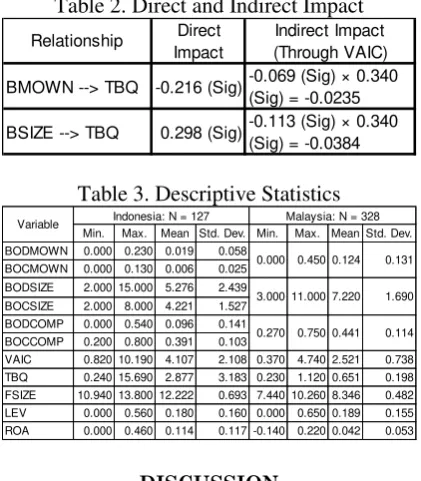
It can be seen in Table 3 that for Indonesia sample, VAIC fails as a mediator of the relationship between CG and TBQ as its significance level is 0.125. Table 2 depicts the direct and indirect impact for Malaysia. Since the indirect impact produces smaller number, VAIC is not effective as a mediator between BMOWN to TBQ. On the other hand, VAIC unable to mediate BSIZE to TBQ as the direct and indirect impact shows different direction (i.e. positive and negative).
Table 2. Direct and Indirect Impact
Table 3. Descriptive Statistics
DISCUSSION
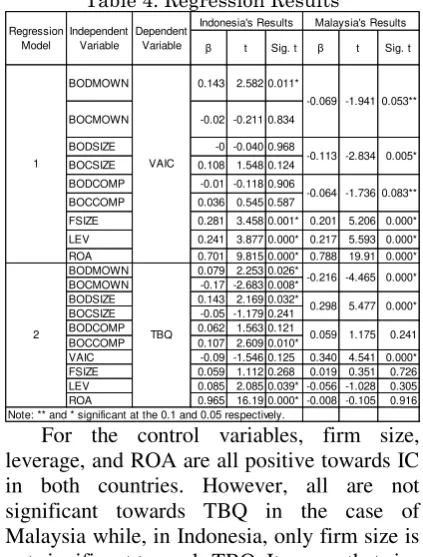
Based on the regression results in Table 4, below are each hypothesis explanation.
1. For Indonesia, H1a is accepted particularly
for BOD as it is positive to VAIC. Although Indonesia directors generally
hold only less than 2% shareholdings (see Table 3), the result proves that it can be an incentive for directors to act in line with the
shareholders’ interests (Noradiva et al., 2016) by taking long-term value-enhancing projects, such as investment in IC (Saleh et al., 2009). On the other hand, although Malaysia directors hold larger ownerships (12.39%), it seems to not motivate them, hence, H1a is rejected. In Malaysia, board ownership is not the only factor that
determines the board’s competency. This is
confirmed by Saleh et al. (2009) who said that Malaysia directors are more highly rewarded in the form of perquisites and allowances.
2. H1b is rejected for Indonesia and Malaysia
as BODSIZE and BOCSIZE are not significant while BSIZE is negative to VAIC. Overall, the results do not support that larger boards should enable companies to secure IC resources. On average, Malaysia (7) has larger boards compared to Indonesia (5 and 4). However, due to the fact that candidates are often searched and recommended by the executive directors or major shareholders themselves (Annuar & Rashid, 2015), it explains why these
directors, although many, are not
necessarily fit nor add value, hence, makes
communication and decision-making
problem that results in decreased ability to make IC investments (Al-Musali & Ismail, 2012; Annuar & Rashid, 2015; Appuhami & Bhuyan, 2015). On the other hand, in Indonesia, board size seems to be merely the number of board members, and this might not have any correlation with the skills and ability to perform their jobs. A survey by OECD (2017) revealed that not all Indonesian companies are required to conduct a fit and proper test and continuous training for directors. This indicates that not all directors on the board have the necessary skills that enable the companies to manage IC effectively. H1c is rejected for Indonesia and Malaysia as BODCOMP and BOCCOMP are not significant while BCOMP is negative to VAIC. Overall, the results contradict with the agency theory. It seems that because independent directors do not work full-time, they have inadequate knowledge about the company and devote less time to improve its value through IC (Yammeesri & Herath, 2010). It was also
ID MY ID MY
VAIC 0.669 0.623 0.000 0.000 TBQ 0.873 0.315 0.000 0.000 Regression Model
Adjusted R² Sig. F
Indirect Impact (Through VAIC)
BMOWN --> TBQ -0.216 (Sig)-0.069 (Sig) × 0.340 (Sig) = -0.0235
BSIZE --> TBQ 0.298 (Sig)-0.113 (Sig) × 0.340 (Sig) = -0.0384 Relationship Direct
Impact
Min. Max. Mean Std. Dev. Min. Max. Mean Std. Dev. BODMOWN 0.000 0.230 0.019 0.058
BOCMOWN 0.000 0.130 0.006 0.025
BODSIZE 2.000 15.000 5.276 2.439
BOCSIZE 2.000 8.000 4.221 1.527 BODCOMP 0.000 0.540 0.096 0.141 BOCCOMP 0.200 0.800 0.391 0.103
VAIC 0.820 10.190 4.107 2.108 0.370 4.740 2.521 0.738 TBQ 0.240 15.690 2.877 3.183 0.230 1.120 0.651 0.198 FSIZE 10.940 13.800 12.222 0.693 7.440 10.260 8.346 0.482
LEV 0.000 0.560 0.180 0.160 0.000 0.650 0.189 0.155 ROA 0.000 0.460 0.114 0.117 -0.140 0.220 0.042 0.053 0.114 Variable
11.000
0.750
3.000 7.220 1.690
0.270 0.441 Indonesia: N = 127 Malaysia: N = 328
5
noted by some studies that Asian
companies typically choose their
independent directors base on kinship (Basyith, 2016; Yammeesri & Herath, 2010) due to the high influence of family- owned groups (OECD, 2017). Hence, they are not able to properly fulfill their responsibilities to manage IC effectively.
3. For Indonesia, H2a is accepted particularly
for BOD as it is positive to TBQ. The result
supports the agency theory where
managerial ownership is able to increase the value of the company as managers have vested interest in the company. In contrast,
for Malaysia, BMOWN has a negative β
score and a significance level of 0.000 to TBQ. Thus, H2a is rejected. This might be due to the low average shareholdings held by the board (see Table 3). It is consistent with the findings of Amran and Ahmad (2013) in a study of Malaysian companies,
who found an inverted U-shaped
relationship where at ownership level < 27%, the correlation is negative as the boards have greater incentive to pursue personal benefits rather than maximizing the firm value.
4. H2b is accepted in Indonesia (particularly for BOD) and Malaysia. Overall, the results support the argument that larger boards can provide more expertise and wider links to external environment which are viewed as more effective by the market to manage the
company’s resources (Appuhami & Bhuyan, 2015; Jackling & Johl, 2009).
5. For Indonesia, H2c is accepted particularly
for BOC as it is positive to TBQ. This result supports the agency theory which mentions that independent directors are necessary to mitigate agency problems (Appuhami & Bhuyan, 2015). Moreover, they help
increase the transparency of the company’s
affairs and provide more assurance to investors (Kumar & Singh, 2012). On the other hand, for Malaysia, BCOMP is not significant to TBQ. Thus, H2c is rejected. Most independent directors in Malaysia are selected for political reasons and legitimate business activities (Haniffa & Hudaib, 2006). Consequently, the lack of awareness of their responsibilities unable them to bring any significant impact to improve the firm value (Arora & Sharma, 2016). In addition, Annuar and Rashid (2015) discovered that the role of independent
directors in Malaysia is more about steering the company forward, but it is the management who are responsible for making things happen.
6. For Indonesia, VAIC is not significant to TBQ, thus, H3 is rejected. For Malaysia, H3 is accepted as VAIC is positive to TBQ. In the case of Malaysia, IC is proven to be capable of enhancing the competitive
advantage by governing knowledge,
technique, and skills that help companies gain sustainable profits (Wang, 2008). Having superior IC will increase the
investors’ confidence, hence, increasing
the firm value. However, IC in Indonesia does not influence the firm value. This might be because the innovation and competitiveness indexes in Indonesia are relatively lower compared to Malaysia (World Economic Forum, 2016). Hence, it may not form the best environment for the development of IC in the country (Maditinos et al., 2011).
Table 4. Regression Results
For the control variables, firm size, leverage, and ROA are all positive towards IC in both countries. However, all are not significant towards TBQ in the case of Malaysia while, in Indonesia, only firm size is not significant towards TBQ. It means that size is not a deciding factor for firm value. Leverage is irrelevant towards firm value in Malaysia because a company with good projects will thrive regardless of its capital structure (Osazuwa & Che-Ahmad, 2016). Lastly, ROA is irrelevant towards firm value in Malaysia as the investors are more interested in the β t Sig. t β t Sig. t
BODMOWN 0.143 2.582 0.011*
BOCMOWN -0.02 -0.211 0.834
BODSIZE -0 -0.040 0.968
BOCSIZE 0.108 1.548 0.124
BODCOMP -0.01 -0.118 0.906
BOCCOMP 0.036 0.545 0.587
FSIZE 0.281 3.458 0.001* 0.201 5.206 0.000*
LEV 0.241 3.877 0.000* 0.217 5.593 0.000* ROA 0.701 9.815 0.000* 0.788 19.91 0.000* BODMOWN 0.079 2.253 0.026*
BOCMOWN -0.17 -2.683 0.008* BODSIZE 0.143 2.169 0.032* BOCSIZE -0.05 -1.179 0.241 BODCOMP 0.062 1.563 0.121 BOCCOMP 0.107 2.609 0.010*
VAIC -0.09 -1.546 0.125 0.340 4.541 0.000* FSIZE 0.059 1.112 0.268 0.019 0.351 0.726 LEV 0.085 2.085 0.039* -0.056 -1.028 0.305 ROA 0.965 16.19 0.000* -0.008 -0.105 0.916 Regression
Model
Independent Variable
Dependent Variable
0.298 5.477 0.000*
0.059 1.175 0.241 -2.834 0.005*
-0.064 -1.736 0.083**
-0.216 -4.465 0.000* Malaysia's Results
-0.069 -1.941 0.053**
-0.113
1 VAIC
2 TBQ
6 company’s ability to generate cash and
dividends in their investment decisions (Chong & Lai, 2011).
CONCLUSION AND SUGGESTIONS
From the analysis, it can be concluded that there are mixed results in relation to the relationship between selected CG indicators, IC, and firm value. Overall, managerial ownership (i.e. shares owned by board members) is a good incentive to improve IC and firm value in Indonesia while it is the opposite in Malaysia. Board size turns out to be not correlated with IC in Indonesia but negative in Malaysia. However, its impact on firm value is positive in both countries. Board composition shows no correlation with IC but significantly improves firm value in Indonesia. In Malaysia, board composition significantly decreases the IC but it shows no influence on firm value. Lastly, IC shows no influence on firm value in Indonesia but it significantly improves firm value in Malaysia.
Future research can consider including more sectors in the sample to give a bigger picture regarding the topic. Other CG indicators that gradually gain popularity and importance (such as board skills and diversity) could be also added. Finally, due to the limitations of VAIC, future research can utilize other measures of IC to generate more valuable conclusions.
REFERENCES
ADB. (2016). ASEAN Corporate Governance
Scorecard. Mandaluyong City: Asian Development Bank.
Al-Musali, M. A., & Ismail, K. N. (2012). Corporate governance, bank specific
characteristics, banking industry
characteristics, and intellectual capital (IC).
Asian Academy of Management Journal of Accounting and Finance, 8(1), 115-135. Amran, N. A., & Ahmad, A. C. (2013). Effects
of ownership structure on Malaysian companies performance. Asian Journal of Accounting and Governance, 4, 51-60. Annuar, H. A., & Rashid, H. M. (2015). An
investigation of the control role and effectiveness of independent non-executive directors in Malaysian public listed
companies. Managerial Auditing Journal,
30(6/7), 582-609.
APICC. (2017). Intellectual Capital
Management. Retrieved February 13, 2017,
from APICC Web site:
http://www.apicc.asia/?page_id=60 Appuhami, R., & Bhuyan, M. (2015).
Examining the influence of corporate
governance on intellectual capital
efficiency: Evidence from top service firms in Australia. Managerial Auditing Journal, 30(4/5), 347-372.
Arora, A., & Sharma, C. (2016). Corporate governance and firm performance in developing countries: evidence from India.
Corporate Governance, 16(2), 420-436. Asian Development Bank Institute. (2004).
Corporate Governance in Asia. Asian Development Bank Institute.
Basyith, A. (2016). Corporate governance, intellectual capital, and firm performance.
Research in Applied Economics, 8(1), 17-41.
Berezinets, I., Garanina, T., & Illina, Y. (2016). Intellectual capital of a board of directors and its elements: introduction to the concepts. Journal of Intellectual Capital, 17(4), 632-653.
BPS. (2017, February 7). Distribusi PDB
Triwulanan Atas Dasar Harga Berlaku Menurut Lapangan Usaha (Persen), 2014-2016. Retrieved February 16, 2017, from
BPS Web site:
https://www.bps.go.id/linkTableDinamis/v iew/id/828
Cabalu, H. (2015). Reforms in corporate governance in Asia after the financial crisis. Advances in Financial Economics, 11, 51-73.
Chahal, H., & Kumari, A. (2013). Examining talent management using CG as proxy measure: a case study of State Bank of
India. Corporate Governance: The
International Journal of Business in Society, 13(2), 198-207.
Chong, T. P., & Lai, M. M. (2011). An empirical evidence of factors in equity
selection process in Malaysia. African
Journal of Business Management, 5(15), 6221-6232.
DOSM. (2017, February 16). Gross Domestic
7
T09&menu_id=TE5CRUZCblh4ZTZMO DZIbmk2aWRRQT09.
Gaur, S. S., Bathula, H., & Singh, D. (2015).
Ownership concentration, board
characteristics and firm performance: A
contigency framework. Management
Decision, 53(5), 911-931
Haniffa, R., & Hudaib, M. (2006). Corporate governance structure and performance of
Malaysian listed companies. Journal of
Business Finance & Accounting, 33(7). International Finance Corporation Advisory
Services in Indonesia. (2014). The
Indonesia Corporate Governance Manual
(1st ed.). Jakarta, Indonesia.
Jackling, B., & Johl, S. (2009). Board structure and firm performance: evidence from
India's top companies. Corporate
Governance: An International Review, 17(4), 492-509.
Kamardin, H., & Haron, H. (2011). Internal
corporate governance and board
performance in monitoring roles: Evidence
from Malaysia. Journal of Financial
Reporting and Accounting, 9(2), 119-140. Keenan, J., & Aggestam, M. (2001). Corporate
governance and intellectual capital: some
conceptualisations. Corporate
Governance: An International Review, 9(4), 259-275.
Korn Ferry and CGIO. (2016, April 20).
Building Diversity in Asia Pacific Boardrooms. Singapore: Korn Ferry and CGIO. Retrieved from Business Times Web site.
Kozlenkova, I. V., Samaha, S. A., & Palmatier, R. W. (2013). Resource-based theory in
marketing. Journal of the Academy of
Marketing Science, 42(1), 1-21.
Kumar, N., & Singh, J. P. (2012). Outside directors, corporate governance and firm performance: empirical evidence from
India. Asian Journal of Finance &
Accounting, 4(2), 39-55.
Maditinos, D., Chatzoudes, D., Tsairidis, C., & Theriou, G. (2011). The impact of
intellectual capital on firms’ market value
and financial performance. Journal of
Intellectual Capital, 12(1), 132-151. Noradiva, H., Parastou, A., & Azlina, A.
(2016). The effects of managerial
ownership on the relationship between intellectual capital performance and firm
value. International Journal of Social
Science and Humanity, 6(7), 514-518.
OECD. (2017). OECD Survey of Corporate
Governance Frameworks in Asia. OECD. Osazuwa, N. P., & Che-Ahmad, A. (2016). The
moderating effect of profitability and leverage on the relationship between eco-efficiency and firm value in publicly traded
Malaysian firms. Social Responsibility
Journal, 12(2), 295-306.
Pratama, B. C. (2016). The impact of intellectual capital of Indonesia's high-tech company on firm's financial and market
performance. International Journal of
Academic Research in Accounting, Finance and Management Sciences, 6(4), 73-81.
Pulic, A. (2004). Intellectual capital – does it
create or destroy value? Measuring
Business Excellence, 8(1), 62-68.
Saleh, N. M., Rahman, M. R., & Hassan, M. S.
(2009). Ownership structure and
intellectual capital performance in
Malaysia. Asian Academy of Management
Journal of Accounting and Finance, 5(1), 1-29.
Securities Commission Malaysia. (2012).
Malaysian Code on Corporate Governance 2012.
Siagian, F., Siregar, S. V., & Rahadian, Y. (2013). Corporate governance, reporting quality, and firm value: evidence from
Indonesia. Journal of Accounting in
Emerging Economies, 3(1), 4-20.
Ting, I. W., & Lean, H. H. (2009). Intellectual
capital performance of financial
institutions in Malaysia. Journal of
Intellectual Capital, 10(4), 588-599. Wang, J. C. (2008). Investigating market value
and intellectual capital for S&P 500.
Journal of Intellectual Capital, 9(4), 546-563.
World Economic Forum. (2016). The Global
Competitiveness Report. Geneva: World Economic Forum.
Yammeesri, J., & Herath, S. K. (2010). Board
characteristics and corporate value:
evidence from Thailand. Corporate
Governance: The International Journal of Business in Society, 10(3), 279-292. Zeghal, D., & Maaloul, A. (2010). Analysing
value added as an indicator of intellectual capital and its consequences on company
performance. Journal of Intellectual