The Availability of ICT
Indicators for Households and
Individuals:
Case of Indonesia
Abdul Rachman
Director of Statistical Dissemination
BPS-Statistics Indonesia
Problems Encountered
•BPS collects mostly data related to
socio-economics and environment, but not yet on ICTs
•Some of BPS’ surveys just add a few questions
on ICTs
•Maybe no other institutions gather ICTs data
directly from respondents (HHs, companies,
governments, and others)
•A new statistical data collecting system is
necessary
Objective
Identifying the availability of
data sources (BPS) in compiling
ICT indicators
ICT Indicators Framework
Supply
Demand
ICT Sectors and
Use of
Households and
Trade in ICT Goods
Individuals (HH1-HH13)
(ICT1-ICT4)
Businesses (B1-B8)
Access to
Governments
ICT Infrastructure and
Access (A1-A12)
Core Indicators on Access to, and Use of,
ICT by Households and Individuals (1):
Cited from “CORE ICT INDICATORS: Partnership on Measuring ICT for Development”
Proportion of HHs with:
•HH1: a radio
•HH2: a TV
•HH3: a fixed line telephone
•HH4: a mobile cellular telephone
•HH5: a computer
•HH7: internet access at home
Core Indicators on Access to, and Use of,
ICT by Households and Individuals (2)
Proportion of individuals who used:
•HH6: computer in the last 12 months
•HH8: the internet (from any location) in the last 12 months
•HH9: Location of individual use of internet in the last 12
months
•HH10: Internet activities undertaken by individuals in the
last 12 months
•HH11: Proportion of individuals with use of a mobile
telephone
•HH13: Frequency of individual access to the internet in the
last 12 months (from any location)
Statistical Issues
•
BPS follows Official Statistics Principles
•International standard classifications (ISIC,
ISCO, HS, and others) are applied in all BPS
surveys
• Probability sampling is applied
•Statistical unit: HHs for Susenas, Village for
Podes, Establishment for Manufacturing Industry
Survey
Indonesia’s Experiences
Expected ICTs Data Sources:
National Socio-economic Survey (Susenas)
Village Potential Survey (Podes)
Large and Medium Manufacturing Survey
Foreign Trade Statistics
Availability of ICT Indicators by Data Sources
ICT Indicators
National
Socio-Economic Survey
(SUSENAS)
Village
Potensial
Survey (PODES)
HH1: a radio
-
-HH2: a TV
v
v
HH3: a fixed line telephone
v
v
HH4: a mobile cellular telephone
v
v
HH5: a computer
v
v
HH6: computer in the last 12 months
v
-HH7: internet access at home
v
v
HH8: the internet (from any location) in the last 12 months
v
-HH9: Location of individual use of internet in the last 12 months
v
-HH10: Internet activities undertaken by individuals in the last 12 months
v
-HH11: Proportion of individuals with use of a mobile telephone
v
-HH12: access to the internet by type of access
v
v
HH13: Frequency of individual access to the internet in the last 12
-National Socio-Economics Survey
(Susenas)
•
Household approach, divided into two types:
Susenas Module with 68.000 samples (HHs)
Susenas Core with 270.000 samples (HHs)
All provinces
• Susenas Module are divided into three different modules, viz:
Module on household income and expenditure:
every three year (e.q. 2002, 2005, etc)
Module on socio-culture, criminality and tourism,
(2003, 2006, etc)
Module on health, nutrition, and education cost,
(2001, 2004, etc)
• Susenas Core is conducted yearly, limited questions. Started at year
2005. In this core survey several questions on ICTs are added.
Village Potential Survey
(Podes)
•
Complete enumeration method is used.
•Direct interview by field enumerator to head of village or
other village officials.
•The only survey collect information on village potentials.
• BPS runs Podes regularly one or two years before the
coming census. For example, Podes SE2006 was done at the
year 2005, while the Economic Census 2006 did a year after,
that was 2006. Podes SP2010 (Population Census) will be
conducted at 2008, while the SP2010 will be run two years
after (2010).
Examples of ICT Indicators
from
Telepon Umum Koin/ Coin Public Telephone
2000 1,54 13,23 6,58 1,30 3,59 1,74 5,98
2003 1,79 7,86 3,93 1,52 4,08 1,35 4.00
2005 1,52 3,03 2,25 2,03 2,83 1,03 2,20
Wartel/ Telephone Stall
2000 2,81 21,62 4,63 2,85 4,47 1,81 9,35
2003 10,44 39,51 11,38 10,24 16,54 3,75 19,56 2005 20,40 58,76 20,15 15,73 32,24 7,76 32,07
Warnet/ Internet Shop
2000 0,47 1,46 0,61 0,39 0,57 0,29 0,80 2003 1,18 0,91 1,25 0,99 1,54 0,80 1,10 2005 0,60 0,59 0,87 0,44 0,88 0,44 0,62 2000 3,95 5,02 5,38 6,40 4,70 3,02 4,65 2003 3,90 4,03 3,58 5,49 3,66 2,55 3,93 2005 3,44 3,38 3,01 4,20 3,06 1,52 3,26
Pos Keliling/ Mobile post
2000 17,29 28,29 11,24 12,94 11,11 1,74 18,45 2003 17,84 34,82 13,60 9,92 13,63 2,51 20,17 2005 14,15 21,41 11,35 7,91 8.62 2,21 13,89 Jawa Prasarana Komunikasi/ Communication Facility
Tabel 1. Persentase Banyaknya Desa yang Memiliki Prasarana Komunikasi menurut Pulau
Sumatera Kalimantan Sulawesi Total Bali +
Nusa Tenggara
Maluku + Papua
Percentage of Villages Having Communication Facility by Province
Kantor Pos/ kantor Pos Pembantu Post Office/Subsidiary Post Office
(4) (5) (6) (7) (8)
(2)
2005
2006
2005
2006
2005
2006
2005
2006
(1) (2) (3) (4) (5) (6) (7) (8) (9)
Nanggroe Aceh Darussalam 0.54 0.59 0.98 1.40 1.08 1.62 0.28 0.47 R i a u 1.08 1.38 0.63 1.07 1.63 2.35 0.10 0.37 Kepulauan Riau 1.81 2.82 2.81 3.74 4.48 6.02 0.88 0.66 DKI Jakarta 5.81 6.26 4.98 8.23 7.48 11.03 1.14 1.58 Jaw a Tengah 0.40 0.68 1.28 1.60 1.20 1.54 0.16 0.17 DI Yogyakarta 1.06 3.06 9.36 14.52 5.52 6.67 0.48 0.87 B a l i 1.30 1.35 1.32 2.78 2.23 3.80 0.12 0.33 Nusa Tenggara Barat 0.27 0.35 0.86 0.62 1.01 0.74 0.34 0.24 Nusa Tenggara Timut 0.22 0.41 0.42 0.44 0.51 0.47 0.22 0.22 Kalimantan Timur 1.97 2.51 1.30 2.18 2.37 4.69 0.87 0.70 Sulaw esi Utara 0.63 0.48 1.74 1.02 1.91 2.08 0.36 0.24 Gorontalo 0.62 0.59 1.29 1.13 1.50 1.11 0.62 0.20 Sulaw esi Selatan 0.57 0.74 1.18 1.35 1.15 1.69 0.26 0.30 M a l u k u 0.20 0.63 0.46 0.61 0.34 0.54 0.08 0.05 Maluku Utara 0.63 0.21 0.73 1.01 0.50 0.86 0.11 0.09 Papua 0.65 0.22 0.46 0.60 1.05 0.95 0.13 0.32 INDONESIA 0.99 1.19 1.56 2.11 1.81 2.43 0.29 0.40
Lainnya/
Others
Di Luar Rumah/ Outside the house
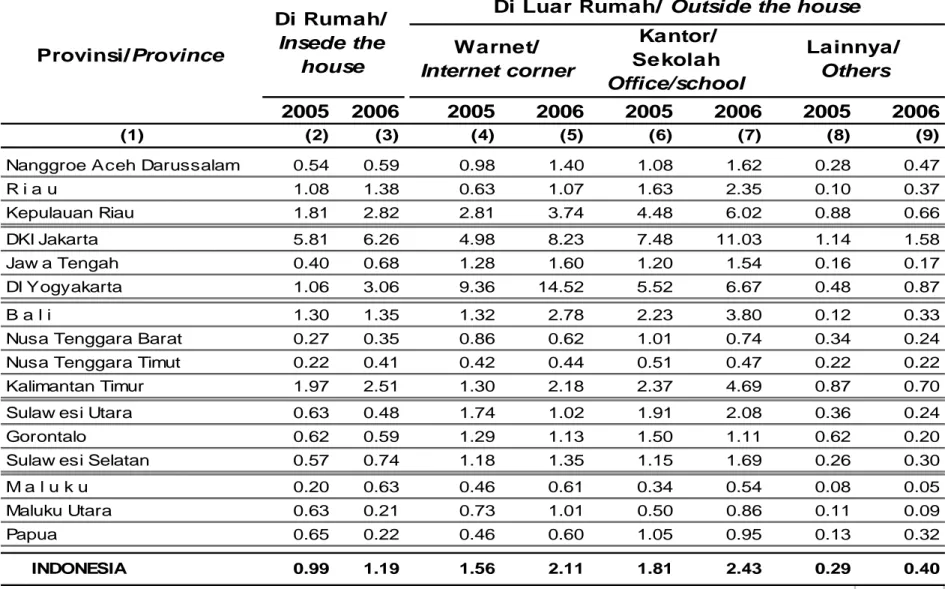
Tabel 4. Persentase Rumah Tangga yang Mengakses Internet melalui Komputer di
Rumah dan Luar Rumah menurut Provinsi, 2005-2006
Warnet/
Internet corner
Kantor/
Sekolah
Office/school
Di Rumah/
Insede the
house
Provinsi/Province
Percentage of Households that Accessed the Interned through Computer at Home by
Province and Area Type, 2005-2006
Nanggroe Aceh Darussalam
134
124
69
R i a u
164
47
44
Kepulauan Riau
-
-
-DKI Jakarta
165
58
38
Jawa Tengah
500
136
61
DI Yogyakarta
61
25
12
B a l i
76
11
6
Nusa Tenggara Barat
106
14
16
Kalimantan Timur
116
32
19
Sulawesi Utara
59
30
23
Gorontalo
16
9
7
Sulawesi Selatan
153
38
31
M a l u k u
33
4
5
Maluku Utara
19
-
2
Papua
56
10
8
INDONESIA
4,332
1,201
821
(1)
(2)
(3)
(4)
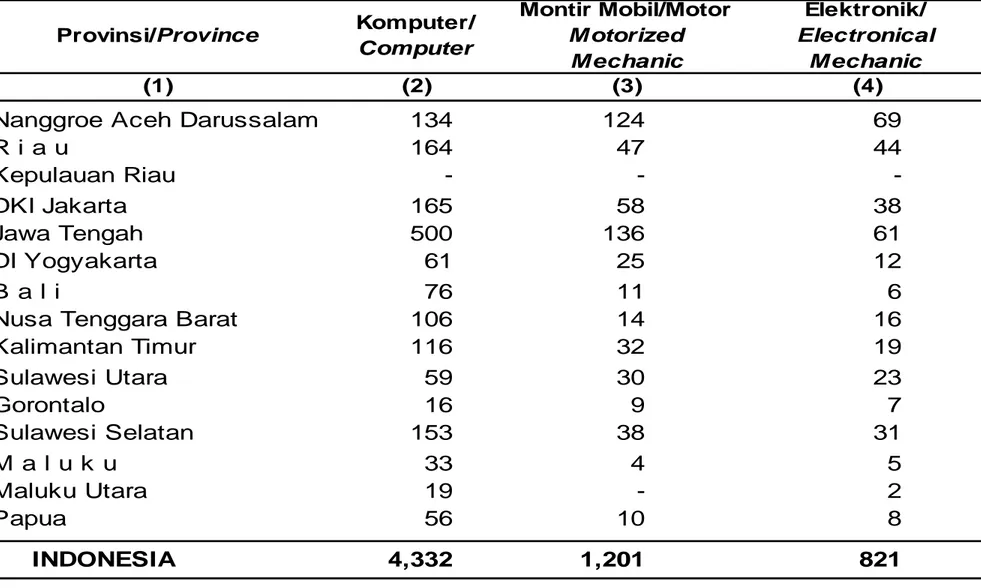
Tabel 2. Banyaknya Desa yang mempunyai Lembaga Pendidikan
Keterampilan menurut Provinsi dan Jenis Keterampilan, 2005
Number of Villages Having Skilled Education Institution by Province
and Type of Skilled Education, 2005
Provinsi/Province
Komputer/
Computer
Montir Mobil/Motor
M otorized
M echanic
Elektronik/
Electronical
M echanic
2005
2006
2005
2006
2005
2006
(1) (2) (3) (4) (5) (6) (7)
Nanggroe Aceh Darussalam 6.98 5.43 16.01 20.75 1.82 2.01
R i a u 10.11 7.29 27.67 33.95 4.24 4.70 Kepulauan Riau 22.93 17.89 53.94 52.79 5.93 7.05 DKI Jakarta 38.55 38.34 50.00 59.90 13.65 16.99 Jaw a Tengah 6.98 6.07 17.42 21.64 2.20 2.77 DI Yogyakarta 13.14 14.63 39.14 46.57 10.66 15.74 B a l i 17.14 15.27 34.13 42.03 4.58 5.76
Nusa Tenggara Barat 4.54 4.09 11.14 16.84 1.41 2.02 Kalimantan Timur 21.22 18.97 36.42 47.06 6.50 8.38 Sulaw esi Utara 15.83 12.09 18.15 20.80 2.16 2.28
Gorontalo 6.66 5.29 9.61 12.06 2.14 1.63
Sulaw esi Selatan 12.29 12.25 15.31 23.64 2.76 3.21
M a l u k u 10.81 7.82 9.71 14.72 1.61 2.30
Maluku Utara 8.70 4.56 10.48 13.06 1.91 1.92
Papua 12.00 6.14 14.71 15.74 2.30 2.07
INDONESIA 13.10 11.20 19.94 24.60 3.67 4.36
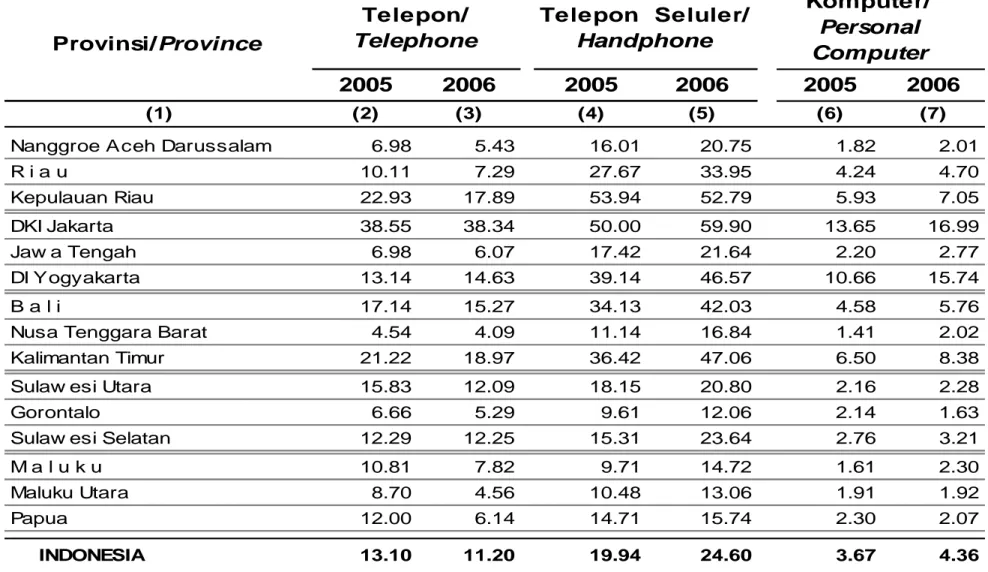
Tabel 3. Persentase rumah Tangga yang Memiliki Telepon, Telepon Seluler,
dan Komputer menurut Provinsi, 2005-2006
Provinsi/Province
Telepon Seluler/
Handphone
Telepon/
Telephone
Percentage of Households Possessing Telephone, Handphone, and Personal
Computer by Province and Area Type, 2005-2006
Komputer/
Personal
Computer
2005
2006
2005
2006
2005
2006
(1) (2) (3) (4) (5) (6) (7)
Nanggroe Aceh Darussalam
1.7
1.5
1.7
1.5
1.4
1.8
R i a u
1.5
1.6
1.2
1.4
1.2
1.6
Kepulauan Riau
1.6
1.4
1.4
1.5
1.6
1.5
DKI Jakarta
1.5
1.4
1.4
1.4
1.5
1.3
Jawa Tengah
1.2
1.3
1.2
1.2
1.6
1.1
DI Yogyakarta
1.2
1.2
1.1
1.3
1.3
1.1
B a l i
1.2
1.3
1.3
1.4
1.6
1.6
Nusa Tenggara Barat
1.3
1.3
1.1
1.1
1.1
1.1
Kalimantan Timur
1.4
1.4
1.2
1.3
1.5
1.4
Sulawesi Utara
1.6
1.6
1.6
1.3
1.7
1.0
Gorontalo
1.4
1.5
1.4
1.4
2.3
1.2
Sulawesi Selatan
1.4
1.6
1.2
1.8
1.2
1.6
M a l u k u
1.7
1.3
1.4
1.6
2.3
1.0
Maluku Utara
1.2
1.3
1.1
1.5
2.8
2.2
Papua
1.5
1.4
1.4
1.2
1.7
1.0
INDONESIA
1.4
1.4
1.3
1.3
1.4
1.4
Tabel 5. Rata-Rata Anggota Rumah Tangga yang Menggunakan Internet di
Beberapa Fasilitas menurut Provinsi, 2005-2006
Provinsi/Province
Kantor/ Sekolah
Office/school
Warnet/ Internet
corner
Lainnya/ Others
Average Number of Households, M embers Using Internet at Several Facilities by
2003 2004 (2) (3) 1 1 * * 1,833 1,833 6 5 16,904,087 12,102,357 1,045 695 1 1 * * 91 91 64 72 1,017,919,140 1,168,313,213 22,234 23,279 146 158 9,191,623,622 10,541,688,610 76,109 87,213 17 15 517,355,070 1,084,758,178 6,099 6,369 43 46 6,224,630,520 6,388,080,035 38,896 39,287 8 9 31,212,546 61,680,616 535 796 30001 : 30003 : 30004 : 31300 : 32100 : 32200 : 32300 : 33121 :
Radio, TV, alat-alat rekaman suara dan gambar, dan sejenisnya/ Radio and TV reciver, sound and vidio recording and accosiates goods
Peralatan pengukuran, pengatur dan penguian manual/ Non electric instrument and appliance for measuring, navigating and testing
30001 30003 30004 31300 32100 32200 32300 33121
Mesin f oto copy/ Foto copy machineries
Kabel listrik dan telepon/ Electric and telephone cables
Tabung dan katup elektronik dan komponen elektronik/ Electronic valve and tube and other electronic component
Alat Komunikasi/ Communication equipments
Mesin kantor dan akuntasi manual/ Manual office, computing and accounting machineries
Mesin kantor, komputasi dan akuntasi elektronik/ Electronic office, computing and accounting machineries
2003 (6) 2004 (7) 2004 (5) 2003 (4)
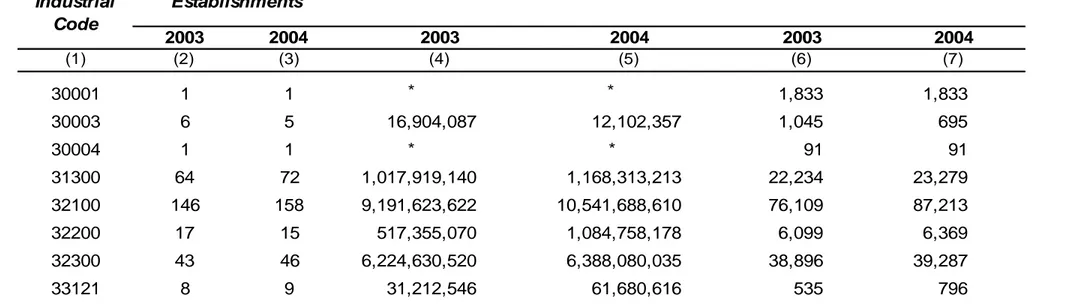
* Tidak bisa dipublikasikan, tetapi tergabung dalam nilai kelompok KLUI lain /Not available for publication, but included in ISIC group values where applicable
Tabel 6. Jumlah Perusahaan, Nilai Tambah dan Tenaga Kerja menurut Industri/
Number of workers and Value Added by Industrial Code , 2003 - 2004
Nilai Tambah (Harga Pasar)/ Value
added (at market prices) (000 Rp) Tenaga Kerja/ Workers Jumlah Perusahaan/ Number of Establishments Kode Industri/ Industrial Code (1)