PENGEMBANGAN SISTEM KLASIFIKASI MAMMOGRAM
BERBANTUKAN KOMPUTER DENGAN MENGGUNAKAN
ANALISIS TEKSTUR DAN KNN
Tri Martin Sanjaya, AsrizalPratama Putra
ABSTRAK
Pengembangansistemklasifikasi mammogram yang bertujuanmengklasifikasikankelasdaripenyakit yang terdapatdari mammogram
denganmenggunakanmetodepra-proses NSCT (Non Subsampled ContourletTransform), metodeanalisistekstur LTEM (Law’s Texture Energy Measures), danklasifikasi KNN (K Nearest
Neighbour) denganderajat k = 5.
Kata Kunci : Computer Vision, KecerdasanBuatan, IntelegensiaSemu, Pengembangan,
Klasifikasi, Mammogram, AnalisisTekstur, LTEM, Law Texture Energy Measure, KNN, K Nearest Neighbour, NSCT, Non Subsampled Contourlet Transform.
Denganmunculnyaberbagaimacamanalisisteksturuntukklasifikasi mammogram, munculpertanyaan “manakahmetode yang paling tepatuntukmelakukanklasifikasimammogram?”.Dikarenakanbanyaknyametode-metode yang
digunakandalamklasifikasi mammogram makaselalumunculperdebatantersebut.
Klasifikasi mammogram terdiridarikumpulanberbagaimetodedalamImage Processing diantaranyaadalahmetodepra-proses, analisistekstur,danklasifikasidimanamasing-masingmetodememilikiperananpentinguntukkeakuratanhasildaripeng-klasifikasian mammogram. Tujuanutamadariklasifikasi mammogram tentusajauntukmenghasilkansuatu program analisistekstur yang diikutidenganklasifikasipada mammogram yang
akurat.Tentusajasemakinbaiksistemklasifikasimakasemakinakurathasil yang didapatpadasistemklasifikasi mammogram tersebut.Sistemklasifikasi mammogram yang
baikterdiridarikumpulan-kumpulanmetode yang tepatdenganfitur set yang tepatjuga yang akanmenghasilkan data akurat yang di ekstrak yang akanmenjadiacuandalamklasifikasi.
NSCT (NON SUBSAMPLED CONTOURLET TRANSFORM)
NSCT adalahmetode yang digunakandalam proses pra-proses. Kegunaanpra-proses adalahmelakukan proses-proses perbaikanpadagambardanmembuang noise-noise padagambar
yang bertujuanmemastikangambartersebutberisi data akuratdanmemenuhikriteriauntukdigunakanpada proses berikutnya.
NSCT merupakanpustakadari MATLAB yang dapat di download pada website MATLAB. Namapustaka NSCT nyayaitu NSCT Toolbox yang dibuatolehJose
Mejia.Be menggun G D cukupsig titikpadak LTEM ( S Kegunaa sisi, bub mammog erikutadalahc nakanmetode ambar1 : (K Dapatdilihatp gnifikandima kananataspo LAW’S TE etelahmelew andariekstrak bung, sudu gram. contohdari e NSCT: Kiri) sebelum perbedaan anakalsifikas ojok). EXTURE EN watitahappra ksifituradalah ut, gumpal mammogr mdilakukanpr mengg sibahkandap NERGY ME -proses, hmengambil , dantitik ram yang ra-proses, (K gunakan NSC atdilihatdeng EASURES) makaak lfitur-fiturun yang kem telahmel Kanan) setela CT. ganmatatela kandilanjutk nik yang ter mudianakanm ewati pro ahdilakukanp anjang kandengantah rdapatgamba menjadiacuan oses pra-p pra-proses ( hapekstraksi armeliputi: g ndalamklasif proses yang (titik-ifitur. garis, fikasi
Padatahapekstraksifiturini, penulismenggunakanmetode LTEM (Law’s Texture Energy Measures). LTEM yang digunakanadalah LTEM dengan 5 matriksyang meliputi:
L5 = [ 1 4 6 4 1 ] E5 = [ -1 -2 0 2 1 ]
S5 = [ -1 0 2 0 -1 ] W5 = [ -1 2 0 -2 1 ]
R5 = [ 1 -4 6 -4 1 ]
Huruf-huruf yang ada pada setiap matriks dimensi memiliki arti sebagai berikut: • L = Level (average grey level)
• E = Edge (extract edge features) • S = Spot (extract spots)
• W = Wave (extract wave features) • R = Ripple (extract ripple features)
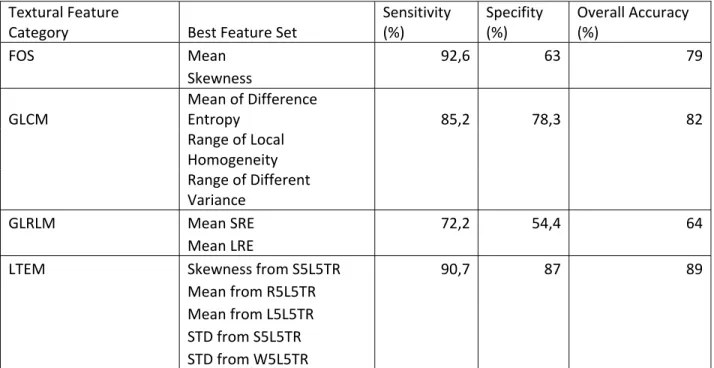
Fitur-fitur yang digunakandalamekstraksifiturmenggunakan LTEM antara lain:Skewness S5L5TR, Mean R5L5TR, Mean L5L5TR, STD S5L5TR, dan STD W5L5TR.Penggunaandari 5 fitur set diatasberdasarkandarijurnal“Texture Analysis of Tissue Surrounding Microcalcifications
on Mammograms for Breast Cancer Diagnosis” yang ditulis oleh A. Karahaliou, Msc dan S
Skiadopoulos, Phd dari universitas Patras Yunani. Pemilihaniniberdasarkankarenanilaidariakurasi rata-rata dari 5 set fiturtersebutmemilikinilaiterbaikdibandingkandengan yang lain.
Tabel 1 Tabel fitur Textural Feature Category Best Feature Set Sensitivity (%) Specifity (%) Overall Accuracy (%) FOS Mean 92,6 63 79 Skewness GLCM Mean of Difference Entropy 85,2 78,3 82 Range of Local Homogeneity Range of Different Variance GLRLM Mean SRE 72,2 54,4 64 Mean LRE LTEM Skewness from S5L5TR 90,7 87 89 Mean from R5L5TR Mean from L5L5TR STD from S5L5TR STD from W5L5TR KNN (K NEAREST NEIGHBOUR)
KNN merupakan klasifikasi dan penarikan kesimpulan dari data pelatihan yang telah dilakukan. KNN menggunakan nilai K yaitu nilai yang menghitung kumpulan-kumpulan data terdekat. Nilai K besar akan mengurangi efek noise pada klasifikasi tapi membuat batasan pada data menjadi kabur. Biasanya nilai K yang digunakan berupa ganjil tergantung juga dengan kebutuhan pembuat dan jumlah kelas yang digunakanpadaklasifikasi.
Prinsiputamadariteori KNN yaitudenganterlebihdahulumenghitungjarakEuclidian
distance antaratitik-titiksejumlahnilai K yang dekatdengannilaipelatihan. Dari sejumlahnilai K,
makaakandiketahuinilaiEuclidian Distance yang terkecildankemudianakandirata-ratakanuntukmengklasifikasikankelasdarinilaipelatihan.
ANALISIS DAN PERANCANGAN SISTEM
Langkah-langkah yang akandilakukanantara lain:
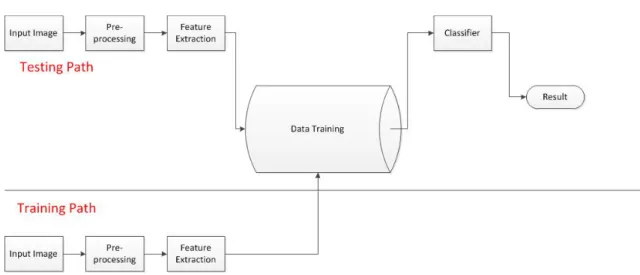
Gambar 2: Flow chart perancangansistem.
Testing path merupakan path untukmengujisistem yang telahdibuatsedangkan Training path merupakan proses untukmelakukanpelatihan.
Training Path meliputi: Penggunaterlebihdahulumemasukkan mammogram padasistem
yang kemudiandiikutidenganpra-proses menggunakan NSCT laludiikutdenganekstraksifiturmenggunakan LTEM dengan 5 fitur yang akandiekstraks yang
kemudianakandilakukan proses penyimpananfitur set dari mammogram tersebutdalam data training.
Testing Path akanmeliputi:Penggunaterlebihdahulumemasukkan mammogram padasistem yang kemudiandiikutidenganpra-proses menggunakan NSCT laludiikutdenganekstraksifiturmenggunakan LTEM dengan 5 fitur yang akandiekstraks yang kemudianakandilakukan proses perbandingandengannilai-nilai yang terdapatpada data training yang kemudianakandiklasifikasidengan KNN yang akanmenghasilkanhasildariklasifikasi.
IMPLEMENTASI SISTEM
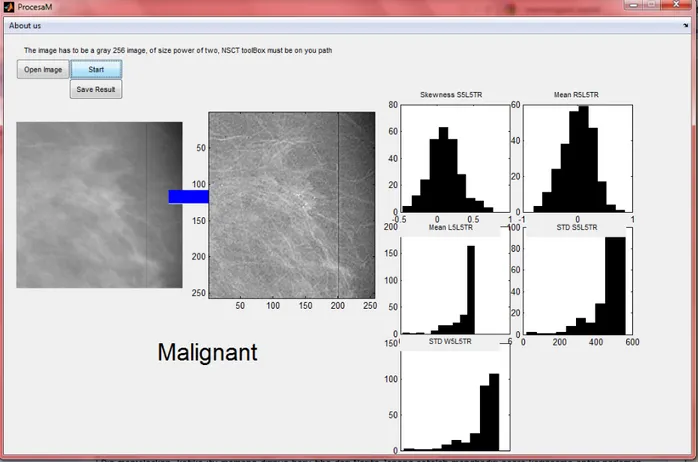
Implementasidarisistemmenggunakan program MATLAB dengan interface awaldanmetodepra-proses menggunakansource code dan GUI yang telahditulisoleh Jose Mejia yang kemudiandimodifikasimenjadi :
Gambar3 :Implementasisistem EVALUASI SISTEM Sisteminimenggunakansampelpelatihandansampelpengujiandenganketentuansebagaiberik ut: Tabel2 :Rinciansampel. Training
Malignant 40 Benign 40 Normal 40
Testing
Malignant 10 Benign 10 Normal 10
Total
Malignant 50 Benign 50 Normal 50
Masing-masingkelasmenggunakan 40 mammogram pelatihandanmasing-masingkelasmenggunakan 10 mammogram pengujiandengan total 50 mammogram yang digunakanpadatiapkelas.
Dari hasilperhitunganakurasi, presisi, sensitivitas,
danspesifitasakandiperolehangkasebagaiberikut:
Akurasi = 90%
Presisi = 90% Sensitivitas = 94,7%
Spesifitas = 81.8% Dan dengannilaiakurasi rata-rata sebesar 88.25%.
SIMPULAN
Dalamanalisisteksturdanklasifikasi mammogram, metodepra-proses, metodeanalisistekstur,
danmetodeklasifikasimempunyaiperanpentingdalammenentukankeakuratanhasil.Selainitu,
pemilihanfitur yang di-ekstrakdalamanalisisteksturjugamemilikipengaruh yang cukupsignifikandalamhasilklasifikasi.
SARAN
Metodeanalisistesktur yang digunakan (LTEM) masihdapatdieksplorlebihjauhdantidakterbataspadapenggunaan 5 fitur yang
digunakan.Masihbanyaksekalimetode-metode lain dalam topic bahasanComputer Vision yang dapatdigunakanuntukmenghasilkanhasil yang lebihbaik.
DAFTAR PUSTAKA
• Alpkocak, Adil. (2002). Ontology-Based Annotations and Retrieval Systems for Digital Mammography Images. (1-34).
• Cunha, A.L., (2005). The Nonsubsampled Contourlet Transform : Theory, Design, and Applications. IEEE Transactions on Image Processing. 15(10). (1-30)
• Kalergi, M, Lucier, B.J, Berman, C.G, et al. (2006). High-Performance Wavelet Compression for Mammography. Radiology, 238, 62-73.
• Karahaliou, A. (2007). Texture Analysis of Tissue Surrounding Microcalcifications on Mammograms for Breast Cancer Diagnosis. The British Journal of Radiology, 80, 648-656.
• Kusumadewi, Sri. (2003). Artificial Intelligence. (Cetakan pertama). ISBN 979-3289-19-8. Yogyakarta:Penerbit Graha Ilmu.
• Lemaitre, G. & Rodojevic, M. (2006). Texture Segmentation : Co-occurence matrix and Laws’s texture masks methods. (1-34).
• Selesnick, I.W. (2007). Wavelet Transforms – A Quick Study. Physics Today Magazine. (1-11)
• Srinivasan, G.N., Shobha G. (2008). Statistical Texture Analysis. Proceeedings of World
Academy of Science, Engineering and Technology. (36), (1264-1269).
• Tomasi, Carlo. (2007). Computer Vision. Supplementary Lecture Notes. CPS 296.1. (2.3-2.39).
• Verma, Brijesh & Zakosh, John. (2001). A Computer-Aided Diagnosis System for Digital Mammograms Based on Fuzzy-Neural and Feature Extraction Techniques. IEEE
Transactions on Information Technology in Biomedicine, 5(1), (46-54).
• Wu, Ying. (2004). An Introduction to Computer Vision. EECS 432- Advanced Computer
Vision Notes. 1. (1-7).
• Alpkocak, Adil. (2002). Ontology-Based Annotations and Retrieval Systems for Digital Mammography Images. (1-34).
• Cunha, A.L., (2005). The Nonsubsampled Contourlet Transform : Theory, Design, and Applications. IEEE Transactions on Image Processing. 15(10). (1-30)
• Kalergi, M, Lucier, B.J, Berman, C.G, et al. (2006). High-Performance Wavelet Compression for Mammography. Radiology, 238, 62-73.
• Karahaliou, A. (2007). Texture Analysis of Tissue Surrounding Microcalcifications on Mammograms for Breast Cancer Diagnosis. The British Journal of Radiology, 80, 648-656.
• Kusumadewi, Sri. (2003). Artificial Intelligence. (Cetakan pertama). ISBN 979-3289-19-8. Yogyakarta:Penerbit Graha Ilmu.
• Lemaitre, G. & Rodojevic, M. (2006). Texture Segmentation : Co-occurence matrix and Laws’s texture masks methods. (1-34).
• Selesnick, I.W. (2007). Wavelet Transforms – A Quick Study. Physics Today Magazine. (1-11)
• Srinivasan, G.N., Shobha G. (2008). Statistical Texture Analysis. Proceeedings of World
Academy of Science, Engineering and Technology. (36), (1264-1269).
• Tomasi, Carlo. (2007). Computer Vision. Supplementary Lecture Notes. CPS 296.1. (2.3-2.39).
• Verma, Brijesh & Zakosh, John. (2001). A Computer-Aided Diagnosis System for Digital Mammograms Based on Fuzzy-Neural and Feature Extraction Techniques. IEEE
Transactions on Information Technology in Biomedicine, 5(1), (46-54).
• Wu, Ying. (2004). An Introduction to Computer Vision. EECS 432- Advanced Computer
• Alpkocak, Adil. (2002). Ontology-Based Annotations and Retrieval Systems for Digital Mammography Images. (1-34).
• Cunha, A.L., (2005). The Nonsubsampled Contourlet Transform : Theory, Design, and Applications. IEEE Transactions on Image Processing. 15(10). (1-30)
• Kalergi, M, Lucier, B.J, Berman, C.G, et al. (2006). High-Performance Wavelet Compression for Mammography. Radiology, 238, 62-73.
• Karahaliou, A. (2007). Texture Analysis of Tissue Surrounding Microcalcifications on Mammograms for Breast Cancer Diagnosis. The British Journal of Radiology, 80, 648-656.
• Kusumadewi, Sri. (2003). Artificial Intelligence. (Cetakan pertama). ISBN 979-3289-19-8. Yogyakarta:Penerbit Graha Ilmu.
• Lemaitre, G. & Rodojevic, M. (2006). Texture Segmentation : Co-occurence matrix and Laws’s texture masks methods. (1-34).
• Selesnick, I.W. (2007). Wavelet Transforms – A Quick Study. Physics Today Magazine. (1-11)
• Srinivasan, G.N., Shobha G. (2008). Statistical Texture Analysis. Proceeedings of World
Academy of Science, Engineering and Technology. (36), (1264-1269).
• Tomasi, Carlo. (2007). Computer Vision. Supplementary Lecture Notes. CPS 296.1. (2.3-2.39).
• Verma, Brijesh & Zakosh, John. (2001). A Computer-Aided Diagnosis System for Digital Mammograms Based on Fuzzy-Neural and Feature Extraction Techniques. IEEE
• Wu, Ying. (2004). An Introduction to Computer Vision. EECS 432- Advanced Computer
DEVELOPMENT OF COMPUTER AIDED MAMMOGRAM
CLASSIFICATION SYSTEM USING TEXTURE ANALYSIS AND
KNN
Tri Martin Sanjaya, AsrizalPratama Putra
ABSTRACT
The purpose of mammogram classification system development is to classify class from disease that can be found in mammogram using NSCT (Non Subsampled Contourlet Transforms) preprocessing method, LTEM (Law’s Texture Energy Measure) texture analysis method, and KNN (K Nearest Neighbour) Classifier using k = 5.
Keyword :Computer Vision, Artificial Intelligence, Intelligent System, Development,
Classification, Mammogram, Texture Analysis, LTEM, Law Texture Energy Measure, KNN, K Nearest Neighbour, NSCT, Non Subsampled Contourlet Transform.
INTRODUCTION
With appearance of various texture analysis to mammogram classification, there will be question arise “which method is the best way to classify mammogram?”. Because there are so many methods that can be used in mammogram classification so there’s always emerge debate.
Mammogram classification consists of collection of various methods in Image Processing which is preprocessing method, texture analysis method, and classification method which every method have important role to decide the accuracy of the mammogram classification result.
The main purpose of mammogram classification is obviously to produce a texture analysis program followed by accurate mammogram classification. Of course the better the classification system, the more accurate the result produced by that mammogram classification system. A good mammogram classification system is consists of collection of right methods with right feature sets too that will produce accurate data that can be extracted to be a reference in classification.
NSCT (NON SUBSAMPLED CONTOURLET TRANSFORM)
NSCT is a method that can be used during preprocessing process. The purpose of preprocessing is to do enhancement process to image and dispose noise that can be found in image aim to ensure image contain accurate data and fulfill the criteria so that image can be use at later process.
N library n which alr C naked ey LTEM ( A purpose o lump, an In The LTE NCST is MA named “NSC ready prepro Fig1 : ( Can be seen t ye (spots in r LAW’S TE After through of feature ex dpoint and th n this feature EM method w ATLAB’s lib CT Toolbox” ocessed using (Left) Before the differenc ight upper c EXTURE EN h the prepro xtraction is t hen will be r e extraction we use is LT brary that ca ” created by g NSCT met e preprocess ce is quiet sig orner). NERGY ME ocess step, so to get uniqu reference in step, we use TEM method an be downlo y Jose Meji thod: s, (Right) Af gnificant wh EASURES) o it will be ue features in mammogram e LTEM (La d using 5 mat oaded from a. This is th fter preproce here the cals
continue to n imageinvo m classificat aw’s Textur trixinvolving MATLAB w he example ess using NS ification can feature extr olve :line, sid
tion. e Energy M g: website. NS of mammo SCT n be seen eve raction step de, ridge, co Measures) me SCT’s ogram en by . The orner, ethod.
L5 = [ 1 4 6 4 1 ]
E5 = [ -1 -2 0 2 1 ] S5 = [ -1 0 2 0 -1 ] W5 = [ -1 2 0 -2 1 ]
R5 = [ 1 -4 6 -4 1 ]
Letters that exist in every dimension matrix have the following meanings: • L = Level (average grey level)
• E = Edge (extract edge features) • S = Spot (extract spots)
• W = Wave (extract wave features) • R = Ripple (extract ripple features)
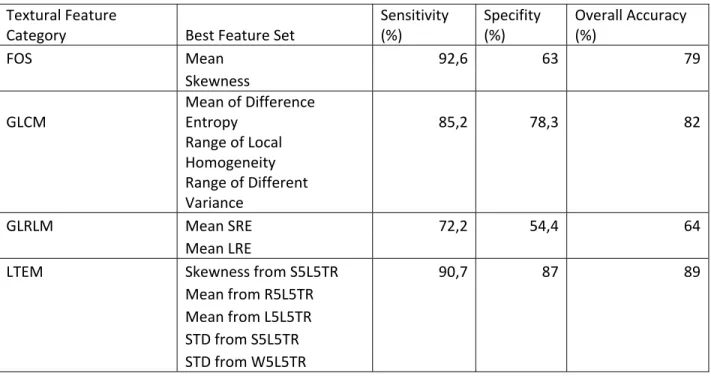
Features that can be used in LTEM feature extraction is Skewness S5L5TR, Mean R5L5TR, Mean L5L5TR, STD S5L5TR, dan STD W5L5TR..the utilization of that 5 feature sets above is based upon an journal titled : “Texture Analysis of Tissue Surrounding
Microcalcifications on Mammograms for Breast Cancer Diagnosis” written by A. Karahaliou,
Msc dan S Skiadopoulos, Phd from University of Patras, Greece. This choice is based upon the overall accuracy and LTEM is the best among them,
Table 1Feature Table Textural Feature Category Best Feature Set Sensitivity (%) Specifity (%) Overall Accuracy (%) FOS Mean 92,6 63 79 Skewness GLCM Mean of Difference Entropy 85,2 78,3 82 Range of Local Homogeneity Range of Different Variance GLRLM Mean SRE 72,2 54,4 64 Mean LRE LTEM Skewness from S5L5TR 90,7 87 89 Mean from R5L5TR Mean from L5L5TR STD from S5L5TR STD from W5L5TR KNN (K NEAREST NEIGHBOUR)
KNN is classifier and inferences from training data that already done. KNN using K value which is value that used to calculate the collection of nearest data.Big K value will decrease the noise effect in classification but make the data boundary become fuzzy. Usually, the K value is odd but depending of the needs of the creator and number of classes that will be used on classification.
The main principle of KNN theory is to firstly count the Euclidian Distance between dots equal to K value which is nearest with the training value. From that amount of K value, it will
be known the smallest Euclidian Distance which will be averaged to determine the class of traning value.
SYSTEM ANALYSIS AND DESIGN
Steps that will be done is :
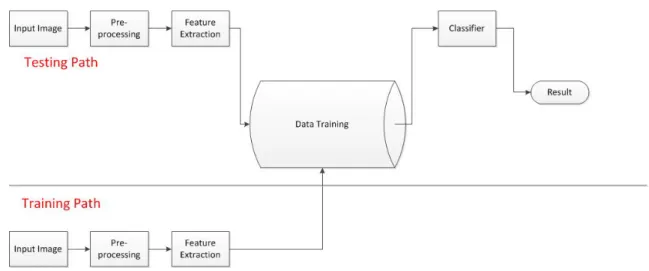
Fig 2: System Design Flow Chart.
Testing path is a path to test the system that has been made while training path is a path to do the training.
Traning Path covers: first, user input mammogram into system followed by preprocessing using NSCT then feature extraction using LTEM using 5 features which will be extracted and then the extracted feature set from mammogram will be stored in data training.
Testing Path covers: first, user input mammogram into system followed by preprocessing using NSCT then feature extraction using LTEM using 5 features which will be extracted and
then the extracted feature set from mammogram will be compared with another value in data traning and classified using KNN to determine the result of classification.
SYSTEM IMPLEMENTATION
The implementation of this system is using MATLAB program with interface and preprocessing method using source code and GUI that is already written by Jose Mejia and then will be modified into:
SYSTEM EVALUATION
This system is using training sample and testing sample with the following details:
Table2 :Detail of samples
Training
Malignant 40 Benign 40 Normal 40
Testing
Malignant 10 Benign 10 Normal 10
Total
Malignant 50 Benign 50 Normal 50
Each classes is using 40 training mammograms and each classes using 10 testing mammograms with total is 50 mammograms will be used for each class.
From the result calculation of accuracy, precision, sensitivity, and specifity will be obtained numbers as follow:
Accuracy = 90% Precision = 90% Sensitivity = 94,7% Specifity = 81.8% And with the overall accuracy is 88.25%.
CONCLUSION
In texture analysis and mammogram classification, preprocess method, texture analysis method, and classification method have an important roles to determine the accuracy of the result. Moreover, the choice of feature which will be extracted in texture analysis also have a significant influence to the classification result.
SUGGESTION
Texture analysis method that used (LTEM) still can be explored further and is not limited to the utilization by that 5 features. Theres still many methods in Computer Vision topics that can be used to produce a better result.
REFERENCES
• Alpkocak, Adil. (2002). Ontology-Based Annotations and Retrieval Systems for Digital Mammography Images. (1-34).
• Cunha, A.L., (2005). The Nonsubsampled Contourlet Transform : Theory, Design, and Applications. IEEE Transactions on Image Processing. 15(10). (1-30)
• Kalergi, M, Lucier, B.J, Berman, C.G, et al. (2006). High-Performance Wavelet Compression for Mammography. Radiology, 238, 62-73.
• Karahaliou, A. (2007). Texture Analysis of Tissue Surrounding Microcalcifications on Mammograms for Breast Cancer Diagnosis. The British Journal of Radiology, 80, 648-656.
• Kusumadewi, Sri. (2003). Artificial Intelligence. (Cetakan pertama). ISBN 979-3289-19-8. Yogyakarta:Penerbit Graha Ilmu.
• Lemaitre, G. & Rodojevic, M. (2006). Texture Segmentation : Co-occurence matrix and Laws’s texture masks methods. (1-34).
• Selesnick, I.W. (2007). Wavelet Transforms – A Quick Study. Physics Today Magazine. (1-11)
• Srinivasan, G.N., Shobha G. (2008). Statistical Texture Analysis. Proceeedings of World
Academy of Science, Engineering and Technology. (36), (1264-1269).
• Tomasi, Carlo. (2007). Computer Vision. Supplementary Lecture Notes. CPS 296.1. (2.3-2.39).
• Verma, Brijesh & Zakosh, John. (2001). A Computer-Aided Diagnosis System for Digital Mammograms Based on Fuzzy-Neural and Feature Extraction Techniques. IEEE
Transactions on Information Technology in Biomedicine, 5(1), (46-54).
• Wu, Ying. (2004). An Introduction to Computer Vision. EECS 432- Advanced Computer
Vision Notes. 1. (1-7).
• Alpkocak, Adil. (2002). Ontology-Based Annotations and Retrieval Systems for Digital Mammography Images. (1-34).
• Cunha, A.L., (2005). The Nonsubsampled Contourlet Transform : Theory, Design, and Applications. IEEE Transactions on Image Processing. 15(10). (1-30)
• Kalergi, M, Lucier, B.J, Berman, C.G, et al. (2006). High-Performance Wavelet Compression for Mammography. Radiology, 238, 62-73.
• Karahaliou, A. (2007). Texture Analysis of Tissue Surrounding Microcalcifications on Mammograms for Breast Cancer Diagnosis. The British Journal of Radiology, 80, 648-656.
• Kusumadewi, Sri. (2003). Artificial Intelligence. (Cetakan pertama). ISBN 979-3289-19-8. Yogyakarta:Penerbit Graha Ilmu.
• Lemaitre, G. & Rodojevic, M. (2006). Texture Segmentation : Co-occurence matrix and Laws’s texture masks methods. (1-34).
• Selesnick, I.W. (2007). Wavelet Transforms – A Quick Study. Physics Today Magazine. (1-11)
• Srinivasan, G.N., Shobha G. (2008). Statistical Texture Analysis. Proceeedings of World
Academy of Science, Engineering and Technology. (36), (1264-1269).
• Tomasi, Carlo. (2007). Computer Vision. Supplementary Lecture Notes. CPS 296.1. (2.3-2.39).
• Verma, Brijesh & Zakosh, John. (2001). A Computer-Aided Diagnosis System for Digital Mammograms Based on Fuzzy-Neural and Feature Extraction Techniques. IEEE
Transactions on Information Technology in Biomedicine, 5(1), (46-54).
• Wu, Ying. (2004). An Introduction to Computer Vision. EECS 432- Advanced Computer
Vision Notes. 1. (1-7).