FINANCIAL FEASIBILITY OF SIJUK SHRIMP PASTE BUSINESS IN
SUNGAI PADANG VILLAGE, SIJUK DISTRICT, BELITUNG REGENCY
Analisis Kelayakan Finansial Usaha Terasi Sijuk di Desa Sungai Padang
Kecamatan Sijuk Kabupaten Belitung
Aditya Nugraha, Suhatmini Hardyastuti, Jangkung Handoyo Mulyo, Faculty of Agriculture, Universitas Gadjah Mada
Jl. Flora, Bulaksumur, Kec.Depok, Kabupaten Sleman, Daerah Istimewa Yogyakarta 55281
Diterima tanggal 19 April 2017 ; Disetujui tanggal 12 Juni 2017
ABSTRACT
Sijuk shrimp paste business is a business in processing rebon shrimp which is most commonly implemented in Belitung Regency. Therefore, fi nancial feasibility needs to be done by considering the fl uctuation in the number of catches of rebon shrimp in nature that will affect the Sijuk shrimp paste business fi nancially. In this study, profi t analysis, investment feasibility, and sensitivity were used to draw the conclusions. The samples involve 25 shrimp paste businesses taken by using census method in Sungai Padang Village, District Sijuk, Belitung Regency. This area is also a central area for producing Sijuk shrimp paste. Census refers to periodic collection of information about the specifi c population from the entire population. Sampling is a method of collecting information from a sample that represents population. The result showed that the Sijuk shrimp paste businesses gives benefi ts because they had a gain of Rp.17.558.914,29 / year, the value of gross profi t ratio of 50.61%, the rate of return per capital investment of 1.02, and the return on the investments amounted to 74.58%. The Sijuk shrimp paste businesses are feasible to continue because they had the value of discounted payback period of 1.57 years, the net present value of Rp.18.264.662,44, the internal rate of the return value of 35%, and the profi tability index of 1.78. From the results of the sensitivity analysis concluded that the Sijuk shrimp paste businesses are feasible to continue because the percentage of increase in the maximum operating costs still can be tolerated which is equal to 44,763% and the percentage of maximum reduction in the selling price of Sijuk shrimp paste still can be tolerated which is equal to 22.108%.
Keyword: Financial feasibility, Shrimp Paste Business, Sijuk Distric
INTISARI
INTRODUCTION
Indonesia is a maritime country having abundant fishery resources and diverse. Therefore, many Indonesian people depend on the fi shery. However, within the fi shery, products are classifi ed into a perishable product, which means it has a short shelf life and is rapidly destroyed. As a result, it will cause the bargaining power of fi sherman becoming weaker. Therefore, an attempt to extend the shelf life and to decelerate the rapid deterioration of raw fi sh products needs to be done, whether become half-fi nished products or fi nished products. In general, the method of processing of fishery products carried out by fishermen in Indonesia coast is by drying, brining, smoking, and fermenting. One of Small and Medium-sized Enterprises (SME) processed products made from fishery products which are produced by many coastal fi shermen in Indonesia is shrimp paste. According to data from MARS, in 2015 the average market growth of shrimp paste increased by an average value of 22.1 percent per year, while the business
value of shrimp paste had increased by an average value of 26.7 percent per year in Indonesia (MARS, 2015).
In Belitung Regency, the shrimp paste businesses have been the longstanding businesses done by fi shermen, where people have been employed for more than 20 years (Department of Marine and Fisheries Belitung, 2016). Sijuk shrimp paste business is a business in processing rebon shrimp which is most commonly implemented in Belitung Regency (Table 1).
Table 1. The business category of business in processing rebon shrimp No. Business category Number
1. Sijuk shrimp paste business 25 2. Rebon shrimp chips 1 Source: D e p a r t m e n t o f M a r i n e A n d
Fisheries (2016)
In general, Sijuk shrimp paste businesses in Belitung Regency use tiny shrimp called rebon shrimp as the raw material for making the shrimp paste. Rebon is the resource that highly dependent on the stock in nature. This will cause a fl uctuation in a number of raw materials that suspected will cause disruption of investasi yang diterima adalah 1.02 dengan laba atas investasi sebesar 74.58%. NPR bisnis sejumlah Rp 18.264.662,44, tingkat pengembalian investasi internal sebesar 35%, dan indeks profi tabilitasnya sebesar 1.78. Selain itu, lama jangka waktu pengembalian discounted adalah 1.57 tahun. Berdasarkan analisis kelayakan tersebut, bisnis terasi udang sijuk termasuk usaha yang layak untuk dijalankan. Hasil analisis sensitifi tas juga memberikan kesimpulan yang sama karena peningkatan biaya operasional dan penurunan harga jual secara berurutan mampu mencapai 44.763% dan 22.108% (dalam batas wajar).
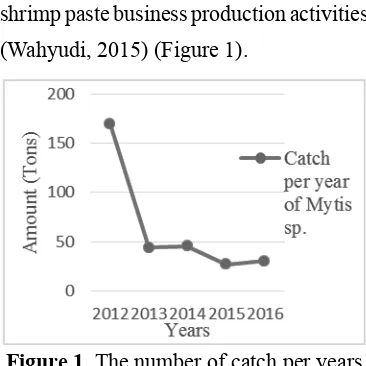
shrimp paste business production activities (Wahyudi, 2015) (Figure 1).
Figure 1. The number of catch per years of Mytis sp.
One of the challenges faced by the development of Sijuk shrimp paste businesses is still weak in management, such as the lack of financial records that cause business owners do not know the financial performances from their businesses so it is diffi cult to raise capital from the outside institutions (Mutua, 2015).
All the challenges faced by Sijuk shrimp paste businesses effect on the financial aspects such as profitability, investment feasibility and risk level of the business. Therefore, by determining the feasibility of the fi nancial aspects of the Sijuk shrimp paste business will be able to evaluate the business ability to generate revenue and provide an overview of past and present regarding the fi nancial performance of the companies that can aid in decision-making (Classe, 2012).
According to Björnsdóttir (2010), the fi nancial feasibility is divided into four
parts: fi rst, an input that consists of the information on investment costs, working capital, fi nancial costs (taxes, dividends, and depreciation), reception. The second part is the financial statements that are comprised of cash fl ow, income statements, and balance sheet. The third part is the profi t analysis and feasibility analysis. The last part is the result of analysis that can be used as a basis for assessing whether the business is profi table and worth continuing or not based on fi nancial aspect.
METHODS
This research was conducted in Sungai Padang Village, District Sijuk, Belitung Regency. The choice of location is done by purposive sampling because Sungai Padang Village, District Sijuk is a central area for making Sijuk shrimp paste in Belitung Regency (Figure 2.). It is due to elicit the right and the best information to achieve the objectives of the study (Kumar, 2011).
Figure 2. Map Showing the Study Area
costs incurred by the formula (Dalimute et al., 2015):
Return on Investment
Return on Investment (ROI) is the value of profits earned from the employer any amount of money invested in a certain time period by the formula (Dalimute et al., 2015):
The concept of time value of money is very important considering the longer time runs, the value of money is getting down, therefore the investment feasibility analysis using the following criteria, assuming the investment feasibility analyses were age project for 4 years and the discount rate used is the interest rate KUR in 2017 amounted to 13%.
Payback Period
The feasibility analysis of investment which aims to calculate the length of the investment can be covered by cash infl ows in the future which are formulated as follows (Erményi, 2015):
Net Present Value
Represents the difference between the present value of net cash fl ow or often referred to as proceed with the present value for more than 5 years. In this study, the
primary data is qualitative data which are the general data about the identity of respondents and the data related to Sijuk shrimp paste business activities and the quantitative data are business investment data, production data including the receipt and expenditure of Sijuk shrimp paste business. Secondary data in this study were obtained from the relevant institutes. Primary data collection instruments used in this study was a questionnaire. Results obtained from the questionnaire then analyzed hence easy to interpret (Kumar, 2011). The criteria used to analyze the profi tability are as follows:
Profi t
Business profi t is the amount of revenue after deducting the expenses incurred for the production process, both fixed cost and variable cost (Primyastanto, 2011).
Profi t = Total Revenue – Total Cost
Gross Profi t Ratio
Gross profi t ratio is profi t compared with the revenue, which can be expressed by the following formula (Dalimute et al., 2015):
of investment formulated by (Gittinger, 1982) in Dolorosa et al., (2014) as follows:
where
n is the age of economic project (year); Bt is the benefi ts in year t;
Ct is the cost in year t;
i is the applicable discount factor.
Internal Rate of Return
The internal rate of return method is a method for fi nding the discount rate that equates the present value of cash fl ow to the present value of investment by the formula (Dolorosa et al., 2014) calculated as follows:
where
i1 is the fi rst interest rate where the NPV is positive;
i2 is the fi rst interest rate where the NPV is negative.
Profi tability Index
Profitability index is investment appraisal method that measures the level of investment feasibility based on the ratio between the total present value of cash infl ows and the present value of the total investment by the formula Primyastanto (2011):
After analyzing the feasibility of investment, the next step needs to perform sensitivity analysis.
Sensitivity Analysis
The sensitivity analysis is a technique to investigate the impact that infl icted on the future of the change in factors that affect the feasibility of shrimp paste (Nwanekezie et al., 2013). Changes in the value of the investment feasibility analysis criteria such as net present value, internal rate of return, and profitability index on shrimp paste business may occur due to certain changes, such as the decline in product prices and rising operational costs of shrimp paste business. In this study, a sensitivity analysis using a switching value approach to see how big the decline in shrimp product price and an increase in operational costs that allowed so that the shrimp paste businesses do not suffer loss. A sensitivity analysis using replacement value (switching value) to obtain the net present value that close to zero, profi tability index approaches a value of 1, and the value of the internal rate of return approaching the value of discount factor (Dolorosa et al., 2014).
RESULTS AND DISCUSSION Sijuk Shrimp Paste Business
Belitung Regency is still house-scale and still use simple equipment and processing method is still traditional. Sijuk shrimp paste business is a family business that way on the terms of catching and processing experience are passed for generations. The production process of Sijuk shrimp paste business is divided into two activities, capture and processing. On fishing activities, the fishermen use 0.5 GT boat and using gear ancau (net lift) on shrimp season that not very much (April - September) due to morning tides and using fi shing gear sero net on shrimp season (October - December) due to night tides and the number of shrimp abundant.
Processing activities, the rebon shrimp that will be made into terasi (shrimp paste) still use conventional way which is fi rst, the process of sorting and washing where rebon captured and have been loaded into the basket are sorted from impurities such as small fish and then washing. The second is the ripening process (fermentation), where the shrimp that has been cleaned and washed put into a sack and fermented with ripened for 24 hours. Furthermore, the third is the drying process, until the shrimp moisture content is reduced and cleaned of dirt. The fi nal process is pulverization process by using a pestle traditional (mortar). In the pulverization process, rebon added enough water. The production of Sijuk shrimp paste in Sungai Padang then marketed. Sijuk shrimp paste
marketing process is carried out by the collectors. Collectors collect shrimp paste production then distributed to retail in Tanjungpandan (Belitung Regency). The packaging process is done by the collectors.
Characteristic
The data of respondents expressed those who were interviewed the house-scale business actors in Sungai Padang village. The aspects in question include age, the level of education, experience, and work.
Table 2. The Characteristic of Respondents Characteristic Number Percentage
Elementary School 25 100 Experience (year):
Source: Primary Data Analysis (2017)
the productive age, although there are also some respondents who are not in the productive age anymore. The majority of shrimp paste business actors are in the range of age 25-59 years. For the record, the average production of shrimp paste produced by the entrepreneurs aged 25-59 years is 171.1 kg/year. Meanwhile, the average production of shrimp paste produced by entrepreneurs aged over 60 years is 140.7 kg/year. Things that causing the low in production is the declining in physical capabilities of the entrepreneurs resulting less fish haul obtained from catching process.
In general, the education level of fi sherman community is still low. Most of the fi shermen are only in elementary school level, even some are not fi nished. The level of education can provide a view of a person’s ability to perceive and apply the information and new technologies that could improve the productivity of fi shermen. Table 2 showed that the entire shrimp paste business actors in Sungai Padang village (the respondents) have been educated to elementary school level, so it can be concluded that the level of education of the shrimp paste business actors is still low. This will affect the ability in management aspects.
The experience of the shrimp paste business actors is one of the important factors in doing the shrimp paste business, both in catching the rebon shrimp and
processing the rebon shrimp into shrimp paste. One of factor that distinguishes the quality of shrimp paste in a region is its human resources including the experience of actors. The fi sherman that has experience will become more skilled and have the capacities in catching and processing fi sh. The experience of shrimp paste business actors in Sungai Padang village comes from trial and error as well as previous businesses. Table 2 showed that all business actors in making shrimp paste can be categorized as very seasoned as they’ve been doing it for over 4 years.
Shrimp paste business actors in Sungai Padang village made shrimp paste production as their main activity, but because its raw material is seasonal, then to increase their income they have side jobs. Table 2 showed that most of the side job of the shrimp paste business actors is farming pepper and palm oil. This is because farming is not time-consuming and laborious.
Income Flows and Expenditures
In this study, a description of income fl ows and expenditures of Sijuk shrimp paste by using the prevailing market price in the area of research.
Income Flows
fresh rebon shrimp. The income of shrimp paste business is the total production of shrimp paste multiplied by the selling price. Income from shrimp paste can be seen in Table 3.
Table 3 showed that the highest income was in October – December, this is because in October – December is the season of Mytis sp. thus, the Production rate of shrimp paste is increasing, this will cause income to incerased.
Expenditure Flow
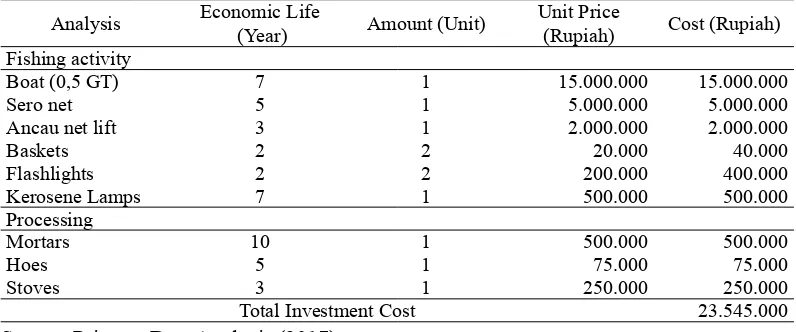
The expenditures in Sijuk shrimp paste businesses consist of investment costs and operational costs. The investment costs incurred in the early stages before the
shrimp business runs which is in year 0 as in the following table (Table 4).
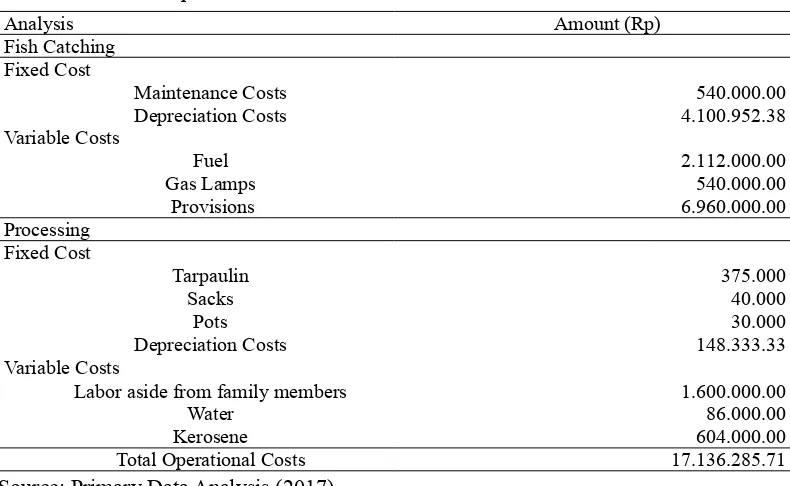
Total cost is all costs incurred annually during the production period, consisting of variable costs and fi xed costs. The operational cost of the shrimp paste business can be seen in Table 4. Variable costs have the largest load to be issued by the shrimp paste business actors in Sungai Padang both on fi shing activities and processing activities with a total percentage of 61.9% of total costs. This is consistent with the research conducted by Dalimunte et al., (2015), those variable costs are the largest cost burden on shrimp paste businesses. In fishing activities showed that the biggest expenditure Table 3. The Income of Shrimp Paste Business
No Month Production (kg) Price/kg (Rp) Income (Rp)
1. April and May 55.2 120.000,- 6.624.000.00
2. June – September 61.92 135.000,- 8.359.200.00
3. October – December 189.2 110.000,- 19.712.000.00
Total Income 34.695.200.00
Source: Primary Data Analysis (2017)
Table 4. The Shrimp Paste Business Investment Cost
Analysis Economic Life
(Year) Amount (Unit)
Unit Price
(Rupiah) Cost (Rupiah) Fishing activity
Boat (0,5 GT) 7 1 15.000.000 15.000.000
Sero net 5 1 5.000.000 5.000.000
Ancau net lift 3 1 2.000.000 2.000.000
Baskets 2 2 20.000 40.000
Flashlights 2 2 200.000 400.000
Kerosene Lamps 7 1 500.000 500.000
Processing
Mortars 10 1 500.000 500.000
Hoes 5 1 75.000 75.000
Stoves 3 1 250.000 250.000
Total Investment Cost 23.545.000
incurred is provisions and fuel costs. While in processing activities the biggest expenditure incurred is labor costs for non-family labor. In addition to non-family labors, they do it during the shrimp season (October – December) allocated in the drying process.
Analysis Profi tability
The performance and effi ciency of a business, in general, can be measured using the fi nancial analysis method by using the ratio of profi t. In this study, the ratio of
profi ts that were used are gross profi t ratio, operating ratio, return on assets, and return on investment. On the table 5, can be seen on the calculation of profi t analysis in Sijuk shrimp pastes businesses in Sungai Padang.
The annual profit that the Sijuk shrimp manufacturing businesses gain is Rp.17,558,914.29. The total profit is considered small. This is because of the number of shrimp production at Sijuk that still exists. According to Aini et al., (2014), the number of production is positively correlated with income of fi sh processing business. Table 5b. The Profi t Analysis Criteria
Criteria Unit Value
Profi t Rp/year 17.558.914,29
Gross profi t ratio Percentage 50,61
Rate of return per capital invested 1,02
Return on investment Percentage 74,58
Source: Primary Data Analysis (2017)
Table 5a. The Shrimp Paste Business Total Costs
Analysis Amount (Rp)
Fish Catching Fixed Cost
Maintenance Costs 540.000.00
Depreciation Costs 4.100.952.38
Variable Costs
Fuel 2.112.000.00
Gas Lamps 540.000.00
Provisions 6.960.000.00
Processing Fixed Cost
Tarpaulin 375.000
Sacks 40.000
Pots 30.000
Depreciation Costs 148.333.33
Variable Costs
Labor aside from family members 1.600.000.00
Water 86.000.00
Kerosene 604.000.00
Total Operational Costs 17.136.285.71
Gross profi t ratio is based on the correlation between gross profi t and income. The value of gross profit ratio of Sijuk shrimp paste business amounted to 50.61%. This percentage has a meaning that from receipts received from Rp1.000,00 will make a profi t of Rp506.1,00. According to Periasami (2010), the high gross profi t ratio is an indication of companies that have a high profi tability, this also refl ects the performance of the business. This is due to the high selling price of Sijuk shrimp paste products in Sungai Padang. The production costs is low as the labors employed are mostly family member and not using high-cost technology.
One of the ratios in the profi t analysis is the rate of return per invested capital. It is calculated to measure the correlation between the profi t and the total cost. The value of the rate of return per invested capital in the Sijuk shrimp paste business is 1.02. It means that from Rp 1,00 of the total cost will generate profi ts of Rp 1.02,00, this value is higher compared to the research of Dalimunte et al., (2015) which is 0,707. This is due to the cost of the Sijuk shrimp paste businesses are not too large. The larger the index value, the more effi cient the businesses (Dalimunte et al., 2015). Sijuk shrimp paste business can be categorized as profi table since the rate of return per invested capital is above the prime lending rate which is 13% (Osondu and Ijioma, 2014).
Return on investment is the ratio used to measure the amount of return on the investment made. The value return on investment in Sijuk shrimp paste business is 74.58%. The lower the return on investment obtained, the worse the state of a business (less efficient) (Huniyah et al., 2015). The value of the return on investment is infl uenced by a number of investments in the business and pricing value of products. Karyani (2014) stated that the means of production used by a business is closely related to profi ts. According to Gregson (2009), giving a good price would result in a reasonable return on investment.
Investment Feasibility Analysis
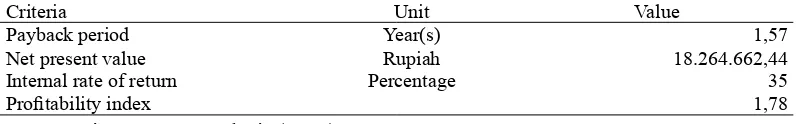
feasibility analysis measured on Sijuk shrimp paste businesses have the value of investment feasibility that is based on four criteria (Table 6).
On the small-scale business criteria that indicate whether the investment worth or not is the payback period because this criterion measures the payback period of the investment cost from profi ts by time unit. The Sijuk shrimp paste business value obtained the payback period of 1.57 years. According to Sungun (2015), that if the duration of payback period shorter than the economic life as required, the business is worth to continue.
One of the eligibility criteria of investment feasibility that provides a more cautious approach to assess the investment is the net present value. The Sijuk shrimp paste business in Sungai Padang obtained the value of the net present value of Rp.18.264.662,44. Based on the net present value indicates that the shrimp paste businesses in Sungai Padang are worth continuing, as profi ts in the future are higher than the cost (Hopkins, 2016).
The internal rate of return shows the ability of capital to provide benefi ts in the form of the discount rate (El-Tahir and
El-Otaibi, 2014). The value of the internal rate of return on the Sijuk shrimp paste business is 35%. When compared to the rate of return on deposits which is 6.5%, then the Sijuk shrimp paste businesses are worth continuing (Yuwani et al., 2014; Marnis et al., 2016). Profi tability index is a signifi cant indicator in assessing the financial performance of a business for calculating the ratio between the present values of net cash infl ow in the future with the present value of the investment. The Sijuk shrimp paste businesses obtained the profitability index value of 1.78. This means that the businesses are worth continuing because the value of profi tability index is higher than 1 (Yuwani et al., 2014; Erményi, 2015).
All four of investment feasibility criteria in these studies showed that the Sijuk shrimp paste businesses in Sungai Padang are feasible to continue. This showed that the Sijuk shrimp paste business gives long- term profits commercially (Suad and Suwarsono, 2014). Factors causing businesses like Sijuk shrimp paste in Sungai Padang are the low investment cost and the low rate of interest. Selection of assets is one of the factors that affect the Table 6. The Investment Feasibility Criteria
Criteria Unit Value
Payback period Year(s) 1,57
Net present value Rupiah 18.264.662,44
Internal rate of return Percentage 35
Profi tability index 1,78
feasibility of the investment on a business, this was due to the purchase of assets that is not fi xed will cause the fi xed costs in a business will be high and reduce the long-term profi ts (Giovanis and Georgios, 2012). According to Suad and Suwarsono (2014), the interest rate would affect the profi tability of an investment.
Sensitivity Analysis
This uncertainty will affect the profi tability of a business because it will reduce profi ts as a result of increasing costs. Analysis of replacement value (switching value) is done by calculating the maximum change that may occur due to changes in the parameters so that Sijuk shrimp paste businesses remain financially viable. The parameters used are as follows 1) Businesses experienced declining in selling prices of Sijuk shrimp paste while operating costs and other components remain; 2) Businesses experienced increasing in operational costs of Sijuk shrimp paste while revenues and other components remain.
The results of the analysis of switching value calculation obtained the maximum percentage of each sensitivity parameters change of the Sijuk shrimp paste business (Table 7).
Table 7 showed that the Sijuk shrimp paste business actors will not gain profi ts at the time of the selling price Sijuk hrimp paste products experienced a declining by
22.108% and as operating costs increased by 92,495%. The decline in prices of the Sijuk shrimp paste businesses in Sungai Padang caused by selling prices that depend on the decisions decided by the retail, this is because the number of retail that selling Sijuk shrimp paste are only 6. According to Anton et al., (2015), that one of the problems commonly faced by small-medium scale businesses to develop is the limited market information and diffi culty in marketing. The result of the analysis of switching value that indicates the maximum limit of the range of changes to the decline in the selling price of sijuk shrimp paste in Sungai Padang village is 22.108%. It indicates that this business is still feasible because the decline in the selling price of sijuk shrimp paste is Rp10.000,00 (9,09%) with the average of declining in selling price in each season.
The increase in operating costs occurred due to the increase of fuel price so that the price of provisions and fuel supplies themselves go up. This is due to the far distance between Sungai Padang and the gas stations so that the fuel used in the fi shing activity has to be bought at retail where the price difference reached Rp.1500/ Table 7. The Sensitivity Analysis
Parameter Value (%) Declining in selling price of
Sijuk shrimp paste
22,108
Increasing in operational costs of Sijuk shrimp paste
92,495
liter and Sungai Padang distance far from the district town which is 45 km far enough so that it causes supplies price increases. Primsyastanto (2011), that the factor of the location of the fi shing industry will affect a number of the production costs of a fi shing business. The increase in operational costs of sijuk shrimp paste business has a maximum value of 92.495%. This indicates that this business is still feasible because the increase of its operational costs each year are 17.1 which is the average infl ation rate in the study area.
CONCLUSION AND SUGGESTION Conclusion
Based on the criteria of profi t analysis is profit, gross profit ratio, the rate of return per capital invested, and return on investments Sijuk shrimp paste businesses in Sungai Padang, District Sijuk, Belitung Regency are feasible to continue. Based on the criteria for investment feasibility analysis, variables such as payback period, net present value, internal rate of return, and profi tability index Sijuk shrimp paste businesses in Sungai Padang, District Sijuk, Belitung Regency are feasible to continue. Based on the scenario on switching value analysis, the price reductions of Sijuk shrimp paste in Sungai Padang is 10%, while the increasing in operational cost Sijuk shrimp paste businesses in Sungai Padang is 10%. Thus, the shrimp paste business in this area is feasible to continue.
Suggestion
The business actors in shrimp paste in Sungai Padang Village can expand their businesses by investing in the freezer box. The government intervention is required for the development of Sijuk shrimp paste in Sungai Padang, for example by providing means of holding exhibitions in each district events and facilities assistance to Sijuk shrimp paste production businesses.
REFERENCES
Aini, M., Mahyudin, I., Mahreda, E. S. 2014. Analisis Usaha Pengolahan Kerupuk Ikan Gabus (Channa Striata Bloch) Peserta Program Pemberdayaan Konsultan Keuangan Mitra Bank (KKMB) di Kalimantan Selatan (Studi Pemberdayaan KKMB di Kota Banjarmasin). Fish Scientiae 4(7): 23-24.
Anton, S. A., Muzakan, I., Muhammad, W. F. , S y a m s u d i n , S i d i q , N . P. 2015. An Assessment of SME Competitiveness in Indonesia. Journal of Competitiveness 7(2): 60-74. Björnsdóttir, A. R. 2010. Financial
Feasibility Assessments: Building and Using Assessment Models for Financial Feasibility Analysis of Investment Projects [thesis]. Reykjavík: Mechanical Engineering and Computer Science School of Engineering and Natural Sciences, University of Iceland.
Dalimunte, S. A., Ramli, M., Hemdik. 2015. Businesses Producing Terasi In The Village Week Chart Asahan Tanjung Balai Kabupaten Asahan North Sumatra Province. JOM Fakultas Perikanan dan Ilmu Kelautan 2(2). D o l o r o s a , E . , M a s y h u r i , L e s t a r i ,
Jamhari. 2014. Analisis Kelayakan Finansialusaha Perikanan Tambak P o l i k u l t u r B a n d e n g - U d a n g Windu, Jurnal Social Economic of Agriculture 3(2): 20-36.
El-Tahir, Y., El-Otaibi, D. 2014. Internal Rate of Return: A Suggested Alternative Formula and It’s Marco-Economics Implication. Journal of American Science 10(11): 216-221. Erményi, T. 2015. Evaluating Investment
P r o f i t a b i l i t y a n d B u s i n e s s Controlling Methods. Management, Enterprise and Benchmarking in the 21st Century. http://kgk.uni-obuda. hu/sites/default/fi les/14_Ermenyi_0. pdf [27 Sepetember 2016].
Giovanis, N. E., Georgios, D. 2012. Reasons for Promoting Fixed Asset Investment Projects in the Region of Greece. The Example of the Prefecture of Serres. International Journal of Business and Social Science 3(14).
Gregson, A. 2009. Pricing Strategies For Small Business. http://www.self-counsel.com [6 Agustus 2016]. Hopkins, M. 2016. The Case for Project Net
Present Value (NPV) and NPV Risk Models. PM World Journal 5(6). Huniyah, A., Alamsjah, M. A., Pursetyo,
K. T. 2015. Analisis Finansial Pembesaran Ikan Bandeng (Chanos chanos) Pada Tambak Tradisional dengan Sistem Monokultur dan Polikultur Di Kecamatan Mulyorejo, Surabaya, Jawa Timur. Jurnal Ilmiah Perikanan dan Kelautan 7(2).
Karyani, U., Mulyono, P., Miasa, I. M. 2014. Unjuk Kerja Mesin Juicer Pada Produksi Susu Nabati Untuk Industri Kecil dan Menengah [tesis]. Yogyakarta: Program Magister Sistem Teknik, Universitas Gadjah Mada. Kumar, R. 2011. Research Methodology A
Step By Step Guide For Beginners. New York: SAGE Publications Ltd. Marnis., Syahrul., Fitri., Mardayulis. 2016.
Valuation of Economic Utilization of Fish Processing Waste Patin (Pangasius Hypopthalmus) as an Added Value for Fish Processing Industry Players in the District Kampar, Riau. International Journal of Economics and Finance 8(9). Mutua, J. M. 2015. Effect Of Bookkeeping
On The Growth Of Small And Medium Enterprises In Chuka Town. European Journal of Business and Social Sciences 4(7): 102 – 112. Nwanekezie, O. F., Iroegbu, A. N., Wogu,
C. L., Okorocha, K. A. 2013. Sensitivity Analysis: A Technique for Investigating the Impact of Changes in Project Variables. International Journal of Research Development. Osondu, C. K., Ijioma, J. C. 2014. Analysis
of Profitability and Production Determinants of Fish Farming in Umuahia Capital Territory of Abia State, Nigeria. World Journal of Agricultural Sciences 2(7): 168-176. Periasamy. 2010. A Textbook Of Financial
Cost And Management Accounting. Mumbai: Himalaya Publishing House.
Primyastanto, M. 2011. Feasibility Study Usaha Perikanan (Sebagai Aplikasi Dari Teori Studi Kelayakan Usaha Perikanan). Malang: UB Press. Suad, H., Surwasono, M. 2014. Studi
5. Yogyakarta: Unit Penerbit dan Percetakan STIM YKPN.
Sungun, G. 2015. Capital Investment Decisions In Small And Medium S i z e d E n t e r p r i s e s I n Tu r k e y. European Journal of Accounting Auditing and Finance Research 3(1): 46-55.
Wahyudi, R. 2015. Analisis Pengendalian Persediaan Barang Berdasarkan
Metode Eoq Di Toko Era Baru S a m a r i n d a . e J o u r n a l I l m u Administrasi Bisnis 2(1).