COMPLEX ROAD INTERSECTION MODELLING BASED ON LOW-FREQUENCY GPS
TRACK DATA
HUANG Jincai, DENG Min, ZHANG Yunfei*, LIU Huimin
School of Geosciences and Info-Physics, Central South University, Changsha, Hunan Province, China, 410083 – (huangjincaicsu, zhangyunfei) @csu.edu.cn, dengmin028@yahoo.com, lhmgis@163.com
Commission VI, WG VI/4
KEY WORDS: crowdsourcing trajectory data; modelling complex road intersections; longest common subsequence; K-segment principle curve; traffic rules
ABSTRACT:
It is widely accepted that digital map becomes an indispensable guide for human daily traveling. Traditional road network maps are produced in the time-consuming and labour-intensive ways, such as digitizing printed maps and extraction from remote sensing images. At present, a large number of GPS trajectory data collected by floating vehicles makes it a reality to extract high-detailed and up-to-date road network information. Road intersections are often accident-prone areas and very critical to route planning and the connectivity of road networks is mainly determined by the topological geometry of road intersections. A few studies paid attention on detecting complex road intersections and mining the attached traffic information (e.g., connectivity, topology and turning restriction) from massive GPS traces. To the authors’ knowledge, recent studies mainly used high frequency (1s sampling rate) trajectory data to detect the crossroads regions or extract rough intersection models. It is still difficult to make use of low frequency (20-100s) and easily available trajectory data to modelling complex road intersections geometrically and semantically. The paper thus attempts to construct precise models for complex road intersection by using low frequency GPS traces. We propose to firstly extract the complex road intersections by a LCSS-based (Longest Common Subsequence) trajectory clustering method, then delineate the geometry shapes of complex road intersections by a K-segment principle curve algorithm, and finally infer the traffic constraint rules inside the complex intersections.
* Corresponding author
1. INTRODUCTION
Digital map is an indispensable tool for human production and life. It plays an important role in the daily life of residents and the construction of smart cities of China, especially for road network maps. High-precise and up-to-date road network maps provide an important prerequisite in many intelligent transportation applications (e.g., safety driving assist and smart traffic management). At present, digital maps are often produced by commercial companies using special vehicles equipped with high frequency and precision GPS-loggers to get the road network data. These processes may be expensive, time-consuming, labour-intensive and not up-to-date. With the development of wireless sensor and positioning technology, a large number of location-related trajectory data are produced(Goodchild, 2007), which can be used for digital maps production, especially for GPS trajectory data collected by floating vehicles. These vehicles are equipped with single-frequency GPS loggers to record the vehicle location at regular intervals(Xintao Liu & Ban, 2013; Sainio, Westerholm, & Oksanen, 2015). And the data contains a complete record of the vehicle's travel path, which contains a wealth of information about the road (such as steering restrictions, speed limits, road intersections, etc.) for fast access to road geometry and road semantic information.
Road intersections are often accident-prone areas as a result of connecting different roadways, and they are very critical to route planning in a routable road maps(Wang, Wang, Song, & Raghavan, 2017). The shape of road intersections is different such as T-shaped, cross-shaped, Y-shaped, ring-shaped and overpasses. A few studies paid attention on detecting road intersections and mining the attached traffic information (e.g., connectivity, topology and turning restriction) from massive
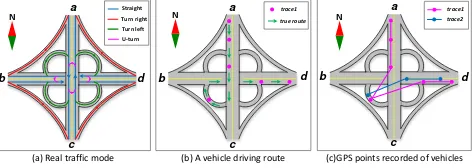
GPS traces. To the authors’ knowledge, recent studies mainly used high frequency (1s sampling rate) trajectory data to extract rough intersection models considering complex shape of intersections (Wang et al., 2015; Wang et al., 2017). It is still difficult to make use of low frequency (20-100s) and easily available trajectory data to modelling complex road intersections geometrically and semantically especially for overpasses because of the low-frequency sampling problem and the complex geometry shape and traffic modes of road intersections (Figure 1).
Straight Turn right Turn left N
U-turn a
b
c
d
N a
b
c
d
trace1 true route N
a
b
c
d
trace1 trace2
(a) Real traffic mode (b) A vehicle driving route (c)GPS points recorded of vehicles
Figure 1. Traffic model at complex road intersections (a: Traffic model; b: Vehicle driving routes from north to east; c: Low- frequency GPS
track data of vehicles from north to east)
Therefore, it is a complicated task for us to model these complex intersections by using the GPS trajectory data of low-frequency sampling due to the problem of sparse sampling of trajectory and complicated traffic of overpass. In this paper, we are motivated to model different kinds of road intersections using low-frequency GPS tracks and try to complete the following work:
We detect the traffic rules within each intersection of each cluster and then we use k-segment principle curve fitting of clusters of intersection to extract the geometry shape of intersections considering the low-frequency sampling problem.
The remainder of this paper is organized as follows. In section 2, recent studies on road network and intersection modelling are reviewed. In section 3, we fully describe our method proposed in this paper. Section 4 is a series of experiments of modelling intersections using the datasets of Wuhan. The last section are our conclusions and discussions.
2. RELATED WORKS
Road map construction is an active topic. Existing research can be divided into three categories:
1) Rasterization method: This type of research mainly convert GPS tracks to a raster map and then use digital image processing methods such as mathematical morphology to get the line of road segments(Chen & Cheng, 2008; Shi, Shen, & Liu, 2009). The resulting road map image is not able to contain topological information so it is hard to use for route planning and the low-frequency sampling problem is not well solved especially for different kinds of road intersections;
2) Incremental method: This type of research(Bruntrup, Edelkamp, Jabbar, & Scholz, 2005; Cao & Krumm, 2009; Kuntzsch, Sester, & Brenner, 2016; Li, Qin, Xie, & Zhao, 2012; Wang et al., 2015; Tang et al., 2015) simply added a single trajectory to an existing road network by adjusting input points from the trajectory and the existing road graph using physical intersections with low-frequency tracks and especially sometimes needs an existing road map(Zhang, Thiemann, & Sester, 2010);
3) Clustering trajectories: This kind of researches(Guo, Iwamura, & Koga, 2007; Karagiorgou & Pfoser, 2012; Xuemei Liu et al., 2012; Schroedl, Wagstaff, Rogers, Langley, & Wilson, 2004) compute road centrelines by spatially clustering nearby trajectories using similarity measure between different trajectories. Usually, these methods sometimes needs an existing road map and can not differ similar road which are close(Xuemei Liu et al., 2012). Traditional similarity measurements are not able to handle the low-frequency sampling problem and road intersections are simply defined as where road centerlines meet. These studies are rarely modelled at complex intersections, such as overpasses.
At presents, road intersections and roadways are often modelled separately to generate a routable road map(Wang et al., 2015) which intersections does not require geometric modelling and just extract their traffic rules(Wang et al., 2017). The shortcomings of these studies are the needs to use high-frequency sampling of the trajectory data (1s), and only the cross-type road intersection are modelled. However, it’s still difficult to obtain currently used high-frequency sampling trajectory which greatly limits the application of the methods these articles proposed.
Therefore, this paper proposes a novel method to make full use of low-frequency vehicle GPS trajectory data to extract traffic rules of different kinds of complex road intersection of based on the above reasons using longest common subsequence and directions of trajectories to measure the similarity between trajectories to better cluster tracks within intersections considering complex traffic mode and low-frequency sampling problem. As for geometric shape of intersections, k-segment principle curve fitting is used to get the geometry shape of intersections considering low frequency sampling problem.
3. MODELLING ROAD INTERSECTIONS USING LOW-FREQUENCY TRAJECTORY DATA 3.1 Trajectory clustering within road intersections
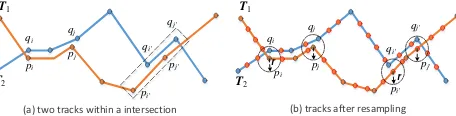
Trajectories within each intersection are clustered to get traffic rules and further delineating the geometry and traffic rules of road intersections. In this paper, the similarity measurement combining the longest common subsequence(LCSS) and directions of trajectories is proposed to facilitate the distinction between the same road in the opposite direction of the road such as the two traveling directions of b→d and d→b of Figure 1-a. The longest common subsequence is a trajectory sequence in which two tracks are close to each other. Assume that T1= {p1,
p2,…pm} and T2 ={q1, q2,…qn}are two tracks(Figure 2-a), pi-pj
and pi'-pj' are two common sub-sequences of T1, the overall length of LCSS of T1 is the sum of the two components. Due to
the sparseness of the sampling trajectories, tracks within intersections need to resample because there is no correspondence between GPS points of T1 and T2(the black box
of Figure 2-a). Trajectory points are resampled between the adjacent points with a step of min_Len as shown in Figure 2-b.
T1
(a) two tracks within a intersection (b) tracks after resampling Figure 2. Illustration of trajectory resampling(a: Original trajectory data;
b: Trajectory data after resampling)
After the track resampling, define the common subsequence with r as the threshold (Figure 2-b): subsequence can be calculated as:
The longest common sub-sequence similarity between L1 and
L2the is defined as:
The similarity between the longest common sub-sequences of
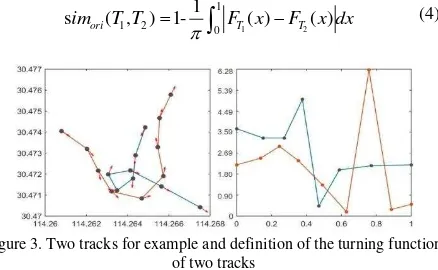
However, the similarity of the longest common sub-sequence can not determine the travel route in different directions on the same road. The direction similarity of the vehicle trajectory is defined as the similarity of the direction change in the whole driving trajectory. In this paper, a "distance - direction" function called F is established to measure the similarity of the track direction. The x-axis is the distance from the original track point to the target track point and normalized to 0-1 and y-axis is the direction value, which is helpful to compare the similarity of the direction of the different lengths. The similarity of two tracks can be measured as of differences of heading directions:
1 2
1
1 2 0
1
simori( ,T T)1-
F xT( )FT( )x dx (4)Figure 3. Two tracks for example and definition of the turning function of two tracks
The overall similarity between T1 and T2 is defined as sim(T1,T2) = simlcss(T1,T2)*0.5 + simori(T1, T2)*0.5.
The overall dissimilarity matrix between each two trajectories are calculated and applied in the hierarchical clustering framework (Müllner, 2013). Particularly, Davies-Bouldin Index (DB) is introduced to adaptively determine the number of trajectory clusters. It is demonstrated that DB can efficiently balance the compactness of individual clusters and the isolation degree between various clusters (Davies & Bouldin, 1979). In
3.2.1 Traffic rules of road intersections
Each cluster obtained by Section 3.1 is one representative turning mode within road intersection. The turning restriction rules of different turning modes can be inferred according to the spatial relationship between the vector from starting point to ending point(SE) of a cluster and the points of traces belonging to the cluster. As shown in Figure 4, each point of traces(P) can be determined whether it is on the left or right side of SE by the track is heading straight as shown in Figure 4-c. For U-turn, there is a little different, the heading directions difference between S and E is calculated and there may be a U-turn if the difference is close to ±180 as shown in Figure 4-d. In the paper, four turning restriction rules, namely, turn left, turn right, going straight, and U-turn are mined based on the proposed method.
S
Figure 4. Schemes of turning restriction rules inference
All the trajectories in cluster C are judged one by one according to the above schemes. The final turning rule of cluster C is selected as the one with the largest percent. Actually, one intersection may have several turning modes or trajectory clusters, and thus contain multiple turning restriction rules.
3.2.2 Geometry and topology of intersections
Based on the clusters of different turning modes, the turning paths of different turning modes can be delineated to express the geometric shape of the whole road intersection. However, because of the fluctuating position precision of GPS devices, trajectory points may not fall into the road intersection region and the tracks of one turning mode can not reflect the true and precise geometry of intersections (Figure 5-a), possibly leading to incorrectly delineates the geometry of turning paths (Figure 5-a highlighted). It is still changeable to use widely-available low-frequency trajectory data to fit real turning paths and in the other hand, it’s expensive to obtain high-frequency GPS data. To reduce the inevitable noise in GPS data, we generate the k -segment principle curves from discrete track points (Figure 5-b) but not from trajectory lines. Principle curve proposed by Hastie (1984) is defined as one self-consistent curve that passes through the middle distribution of observed point data. K-segment fitting algorithm of Verbeek et al. (2002) is implement to delineate the turning path of different turning modes considering the clustering of trajectories of complex intersections contains a cross-distribution pattern (Figure 5-b) and other kinds of principle curves are hard to handle this situation.
(a) Trajectories of one turning mode (b) K-segment curve of based on points
Figure 5. Road intersections with low-frequency sampling tracks of cluster 11(a: Low-frequency trajectories of complex road intersection
and its central trajectory; b: Principle curves of tracks)
geometry of road intersections. The curves only express traffic modes of road intersections. For crossroads, T-junctions, overpasses, curves which is turning left or right are merged to curves which are straight and then they are merged together (Figure 6). The longest common subsequence and heading similarity are used to detect adjacent curves with similarity directions. For roundabout, there is a little difference. Firstly, the longest common sub subsequence of similar directions are
detected to get the “circle” of the intersection and each trajectory is separated into entry-part and exit-part. In the cycle, the shortest length of the entry-part is the final entry-part and so is the exit-part. Then, the entry/exit-parts are clustered to get road shapes and the points of circles are fitted to get the ring of the roundabout.
(a) possible traffic mode of intersections
(b) sub sequences of right-turn are merged with straight roads
(c) finally geometry of intersections
U-turn right-turn straight left-turn
U-turn right-turn straight left-turn exit entrance
A B C
D
E
Circle-part Entry-part Exit-part
A B C
D
E
curve1 curve2
(d) two tracks within roundabout
(e) sub sequences of curves are merged
Figure 6. The merging process of principle curves (a-c: merging process of crossroad; d-e: merging process of roundabout)
4. EXPERIMENTS AND DISCUSSION 4.1 Study area and datasets description
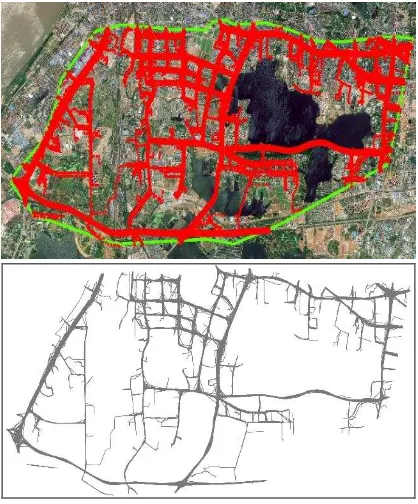
In this paper, taxi tracking dataset of a piece of area of Wuhan city(114.3° E, 30.48° N), May 1, 2014, a total of about 0.6 million taxi tracking points is used to implement the experiment in order to verify the effectiveness of this method with trajectory data sampling interval 20-100 seconds, precision 5-20 meters.
Figure 7. Study area and tracks within the area in Wuhan
.
4.2 Study area and datasets description
The finally result of this experiment can be shown as figure 8 with all kinds of road intersections detected.
A:overpass B:T-junction
E:T-junction D:T-junction
C:crossroad
F:roundabout
Figure 8. Finally geometry and traffic rules of different road intersections(red: entrances, blue: exit)
4.2.1 Overpass
The geometries of the overpass are generally complex. The height of vertical roads of overpasses are generally different, because of which special rings of roads of left and right turns need to built at junctions. Figure 9-a shows the original trajectories of Qingling overpass of Wuhan and Figure 9-b shows the clustering result and each cluster of result is shown as Figure 9-d-n.
K-segment principle curve algorithm is used to fit the points of each cluster and the figure below shows the result of fitting and the final extracted geometry and the points of entry and exit of left/right turning roads of Qingling overpass after merging. Roads turning left and right are merged into the straight roads. After overlapping the road map with a Google map, we observed that the shapes of the road intersection matched with those of the background image, clearly delineating turning paths in different directions. The entry and exit points of turns left and right turns of the overpass are clearly expressed and the topology of roads of overpass is kept which is siutable for navigable and routable road networks. we can see that this is closer to the actual geometry of road intersection.
Figure 10. Geometry of overpass and roundabout using K-segment fitting
4.2.2 Roundabout
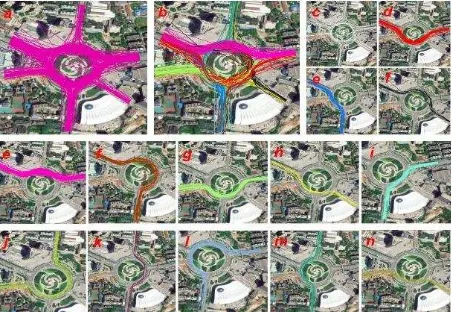
Another type of road intersections is roundabout and in the study area, there is a roundabout near the Guanggu Square. The trajectories (Figure 11-a) of Guanggu Square are clustered(Figure 11-b) and 13 clusters are extracted which indicate the traffic mode of Guanggu Square. Each cluster of result is shown as Figure 11-d-n.
Figure 11. Clustering results of Guanggu square roundabout in Wuhan(a: original tracks; b: Clustering result; c: noise of cluster; d-n:
each cluster is shown)
K-segment principle curve is used to fit the points of each cluster and the figure 10 below shows the result of fitting and the final extracted geometry and the points of entry and exit of left/right turning roads of Gunaggu Square after merging. The topology of roads of roundabout is kept which is siutable for navigable and routable road networks. The final map of roundabout is closer to the actual geometry of road intersection.
5. CONCLUSIONS
In this paper, we propose a method to extract complex intersections based on low-frequency trajectory data. We calculate the longest common sub-sequence and trajectory travel directions to measure the similarity between trajectories, which provides a basis for reasonable clustering of trajectories. Then, the traffic rules at road intersections are extracted and K-segment principle curve fitting algorithm is used to extract the geometric shape of the road intersections based on low frequency sampling tracking data. The experimental results show the effectiveness of the proposed method. Generally speaking, the proposed method can extract detailed geometry structures and traffic rules of road intersections with an effective way. Our research is important because the connectivity of road networks is mainly determined by the topological geometry of road intersections. This is of great significance for automatic production of navigable and routable electronic maps. The author believes that the continuous enrichment of semantic and geometric information is an important development direction of future electronic map, which is the foundation of smart city.
ACKNOWLEDGEMENTS (OPTIONAL)
This work was jointly supported by the projects from NSFC (No. 41601495, 41471385, and 41301515), the national key research and development program of china (No. 2017YFB0503500), and supported by the open research funds of state key laboratory of information engineering in surveying, mapping and remote sensing, and State Key Laboratory of Resources and Environmental Information System.
REFERENCES
Banfield, J. D., & Raftery, A. E., 1992. Ice Floe Identification in Satellite Images Using Mathematical Morphology and Clustering About Principal Curves.
Journal of the American Statistical Association, 87(417), pp.7-16.
Bruntrup, R., Edelkamp, S., Jabbar, S., & Scholz, B., 2005. Incremental map generation with GPS traces. Paper presented at the Intelligent Transportation Systems,
Proceedings. 2005 IEEE.
Chen, C., & Cheng, Y., 2008. Roads digital map generation with multi-track GPS data. Paper presented at the Education Technology and Training, 2008. and 2008 International Workshop on Geoscience and Remote Sensing. ETT and GRS.
Davies, D. L., & Bouldin, D. W., 1979. A cluster separation measure. IEEE transactions on pattern analysis and machine intelligence(2), pp.224-227.
Deng, M., Liu, Q., Cheng, T., & Shi, Y., 2011. An adaptive spatial clustering algorithm based on delaunay triangulation.
Computers Environment & Urban Systems, 35(4), pp.320-332.
Goodchild, M. F. (2007). Citizens as sensors: the world of volunteered geography. GeoJournal, 69(4), pp.211-221.
Guo, T., Iwamura, K., & Koga, M., 2007. Towards high accuracy road maps generation from massive GPS traces data. Paper presented at the Geoscience and Remote
Sensing Symposium, IGARSS 2007. IEEE International.
Hastie, T., 1984. Principal curves and surfaces: DTIC Document.
Hastie, T., & Stuetzle, W., 1989. Principal Curves. Journal of the American Statistical Association, 84(406), pp.502-516.
Kégl, B., & Krzyzak, A., 2000. Principal curves.
Karagiorgou, S., & Pfoser, D., 2012. On vehicle tracking data-based road network generation. Paper presented at the Proceedings of the 20th International Conference on Advances in Geographic Information Systems.
Krzyzak, A., & Kegl, B., 1999. Principal Curves: Learning, Design, And Applications. Computer Science & Software Engineering.
Kuntzsch, C., Sester, M., & Brenner, C., 2016. Generative models for road network reconstruction. International
Journal of Geographical Information Science, 30(5),
pp.1012-1039.
Li, J., Qin, Q., Xie, C., & Zhao, Y., 2012. Integrated use of spatial and semantic relationships for extracting road networks from floating car data. International Journal of
Applied Earth Observation and Geoinformation, 19,
pp.238-247.
Liu, X., & Ban, Y., 2013. Uncovering Spatio-Temporal Cluster Patterns Using Massive Floating Car Data. ISPRS
International Journal of Geo-Information, 2(2), pp.371-384.
Liu, X., Zhu, Y., Wang, Y., Forman, G., Ni, L. M., Fang, Y., & Li, M., 2012. Road recognition using coarse-grained vehicular traces. HP Labs, HP Labs2012.
Müllner, D., 2016. fastcluster : Fast Hierarchical, Agglomerative Clustering Routines for R and Python.
Journal of Statistical Software, 53(9), pp.1-18.
Ord, J. K., & Getis, A., 1995. Local Spatial Autocorrelation Statistics: Distributional Issues and an Application.
Geographical Analysis, 27(4), pp.286-306.
Rosenblatt, M., 1956. Remarks on some nonparametric estimates of a density function. The Annals of Mathematical Statistics, 27(3), pp.832-837.
Sainio, J., Westerholm, J., & Oksanen, J., 2015. Generating Heat Maps of Popular Routes Online from Massive Mobile Sports Tracking Application Data in Milliseconds While Respecting Privacy. ISPRS International Journal of Geo-Information, 4(4), pp.1813-1826.
Schroedl, S., Wagstaff, K., Rogers, S., Langley, P., & Wilson, C., 2004. Mining GPS traces for map refinement.
Data mining and knowledge Discovery, 9(1), pp.59-87.
Shi, W., Shen, S., & Liu, Y., 2009. Automatic generation of road network map from massive GPS, vehicle trajectories.
Paper presented at the Intelligent Transportation Systems, 2009. ITSC'09. 12th International IEEE Conference on.
Tang L L, Liu Z, Yang X,Kan Z H, et.al., 2015. A method of spatio-temporal trajectory fusion and road network genaration based on cognitive Law. Acta Geodaetica et
Cartographica Sinica, 44(11), pp.1271-1276.
Tibshirani, R., 1992. Principal curves revisited. Statistics
and Computing, 2(4), pp.183-190.
Verbeek, J. J., Vlassis, N., & Kröse, B., 2002. A k-segments algorithm for finding principal curves. Pattern Recognition Letters, 23(8), pp.1009-1017.
Wang, J., Rui, X., Song, X., Tan, X., Wang, C., & Raghavan, V., 2015. A novel approach for generating routable road maps from vehicle GPS traces. International
Journal of Geographical Information Science, 29(1),
pp.69-91.
Wang, J., Wang, C., Song, X., & Raghavan, V., 2017. Automatic intersection and traffic rule detection by mining motor-vehicle GPS trajectories. Computers, Environment
and Urban Systems, 64, pp.19-29.