ANALYZING IMPACT FACTORS OF AIRPORT TAXIING DELAY BASED ON ADS-B
DATA
J. Lia, X. Wanga,*, Y. Xub, Q. Lia, C. Hea, Y. Lia a
College of Geoscience and Surveying Engineering, China University of Mining and Technology, Beijing 100083 China – [email protected], *[email protected], (qingqili, cqhe, ypli)@student.cumtb.edu.cn
b
China Academy of Civil Aviation Science and Technology, Beijing 100028, China – [email protected]
Commission IV, WG IV/3
KEY WORDS: Taxiing delay, Impact factors, ADS-B data, Traffic flow, Map matching, Correlation analysis
ABSTRACT:
Identifying the factors that cause taxiing delay on airports is a prerequisite for optimizing aircraft taxiing schemes, and helps improve the efficiency of taxiing system. Few of current studies had quantified the potential influencing factors and further investigated their intrinsic relationship. In view of these problems, this paper uses ADS-B data to calculate taxiing delay time by restoring taxiing route and identifying key status points, and further analyzes the impact factors of airport taxiing delay by investigating the relationship between delay time and environmental data such as weather, wind, visibility etc. The case study in Guangzhou Baiyun Airport validates the effectiveness of the proposed method.
1. INTRODUCTION
China’s aviation industry has been experiencing a rapid development since the reform and opening-up policy. The aviation traffic is continuously increasing including both passenger and cargo traffic, and the growth rate is much higher than that for other modes of transport such as railway and road transport. Accompanied with the advancement of civil aviation industry is the rapid rise of flight delay rate. According to FlightStats, an American service provider of flight data statistics, China's flight punctuality rate dropped to 68.33% in 2015 from 82.79% in 2007. Especially in the year of 2015, China's average flight punctuality rate was the worst among Asian countries. By contrast, the punctuality rates of most Japanese airports are as high as 90%. Flight delays are divided into two types: air delay and airport taxiing delays, of which the latter one is usually a major cause of flight delays, and therefore, it is a hot research topic. Identifying the main factors that cause taxiing delay in airports is a prerequisite for optimizing aircraft taxiing schemes, and is helpful to improve the efficiency of taxiing system and further to reduce flight delay rate.
Domestic and foreign scholars have carried out a lot of research in taxiing optimization. Krozel et al. analyzed the seasonal features of departure delay, arrival delay, taxiing delay and weather related delays using various kinds of data sources such as the FAA’s Aviation System Performance Metrics (Krozel et al., 2003). Markovic et al. used hybrid regression/time series modeling to analyze the relationship between total daily punctuality at Frankfurt Airport and weather, traffic flow and airport system state. They identified the terminal-specific delay impact factors and discussed the possibility of forecasting the punctuality rate within 24 hours (Markovic et al., 2008). Zhang et al. used the features of traffic demand and weather to develop a fuzzy linear regression model for airport arrival delay, and calculated the estimated delay. They found that the features of traffic demand and weather have a strong linear relationship with airport arrival delay (Zhang et al., 2010). Feng et al. used multiple sources such as
flight operation information, conventional meteorological observations, intensive observations of automatic weather observation, satellites, radars and model analysis products to study a historically rare incidence of extensive flight delays at Guangzhou Baiyun Airport and the associated process of severe convective weather (Feng et al., 2014).
Although scholars have done a lot of research on airport taxiing delays, they mainly use the flight delay statistics from airlines which cannot reflect the accurate taxiing route of aircrafts and cannot analyze the impact of spatial factors on taxiing delay, e.g. taxi route selection and parking location of aircrafts. Moreover, most of current studies focus on a qualitative analysis of the influence of potential factors (weather, visibility etc.) on airport taxiing efficiency. Few studies had quantified the potential influencing factors and further investigated their intrinsic relationship.
The popularity of global satellite positioning technology has led to the widespread use of Automatic Dependent Surveillance-Broadcast (ADS-B) in civil aviation, which is a new air traffic control technology based on GPS. ADS-B uses air-to-ground, air-to-air data link to implement traffic monitoring and information transmission (Xu et al., 2015). It can obtain the location and movement parameters of aircrafts in real time, and provide a technical basis for fine-grained analysis of taxiing process of aircrafts. This paper aims to use ADS-B data and environmental data in the same period, to establish a potential influencing factor dataset, and identify the major influencing factors and effects of taxiing delay by correlation analysis and regression analysis.
2. METHODOLOGY
environmental factors related to taxiing process such as weather events, visibility, affiliated airlines etc. are collected and quantified, and then the important factors affecting taxiing
delay time and the corresponding influence effect are analyzed by correlation analysis methods.
Traffic control events
Atmospheric visibility Traffic flow
Rainfall Parking location Wind speed,
direction
Airlines ……
Environmental factors
Airport traffic
network ADS-B Data
Correlation analysis between taxiing delay and environmental factors
Map matching
Taxiing start and end point extraction
Taxiing delay time Indicator quantification
Impact mode of taxiing delay Taxiing
schedule
Figure 1. General workflow
Table 1. Sample ADS-B data We chose Guangzhou Baiyun International Airport as a
case study, and collected the vector map of airport traffic network including taxiway, runway, parking lots, etc., as shown in Figure 2. The ADS-B data collected from September to November 2016 were also used. Table 1 shows a sample ADS-B dataset on this airport.
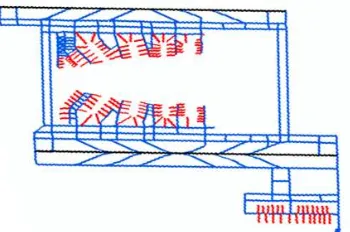
Figure 2. Traffic network of Guangzhou Baiyun Airport In view of the characteristics of taxiway network, we proposed a map matching model based on (Zhao et al., 2012), which is composed of three matching rules: (a) Distance criteria: the distance between a target and its matching taxiway is closest; (b) direction criteria: the movement direction is closest to the direction of its matching taxiway; (c) connectivity: the matching taxiways of adjacent points are consistent. A map matching result is shown in Figure 3.
(a)
(b)
Figure 3. ADS-B data before (a) and after (b) map matching An aircraft is in a stationary state before take-off, and then switches to the accelerated state after taxiing, and taxies on taxiways until it enters the runway. When the moving speed of aircraft reaches to a certain threshold, it begins to take off and owns a vertical speed. Therefore, for the continuous ADS-B data of any aircraft, the start and end point of taxiing process can be determined by the ground speed and vertical velocity, and the taxiing delay time is calculated.
Address
code Airlines Lon. Lat. VSpeed GSpeed Altitude Flight No. Direction Time
78067D SZAir 113.3053 23.36052 -195 261 129 9C8514 13.9378 2016-9-16
00:46:39
7BB0FF SZAir 113.2926 23.40356 -195 35 53 CA433U 14.0625 2016-10-18 13:14:50
7809BE SZAir 113.2924 23.39616 -214 19 60 MU2301 14.0625 2016-9-14
The environment of aircraft taxiing process includes its own attributes (such as associated airlines), airport environment (traffic flow, parking position), meteorological condition (such as wind speed, wind direction, atmospheric visibility, rainfall, weather, etc.). The calculated taxiing delay time and its associated environmental factors is shown in Table 2.
According to the type of influencing factors, the factors that have important influence on taxiing delay are selected, and the influence of each factor on delay is analyzed.
Weather
The most frequent weather in Guangzhou Baiyun Airport from September to November of September 2016 are cloudy, including mostly cloudy, Scattered Clouds, Partly Cloudy and Overcast. It occurred 12319 times and the percentage is 36.17%. The lowest frequency of weather is heavy rain, it only occurred 18 times, and its frequency is 0.05%, as shown in Figure 4.
Table 2. Taxiing delay time and associated environmental factors
Figure 4. Occurrence percentage of different weather Classifying cloudy, haze, thunderstorms, and precipitation as bad weather and classifying other weathers as ordinary weather. The probability of taxiing delay in bad weather is 78.78%, while that in ordinary weather is 67.39%. It can be seen from Table 3 that the proportion of taxiing delay in ordinary weather is significantly lower than that of bad weather.
Weather Count Percentage of
occurrence
Percentage of delay
Clear 7864 23.06% 62.52%
Partly Cloudy 3655 10.72% 64.49%
Scattered Clouds 4450 13.05% 66.11%
Mostly Cloudy 7676 22.51% 66.25%
Table 3. Flight taxiing delay ratio under different weather conditions
Wind power
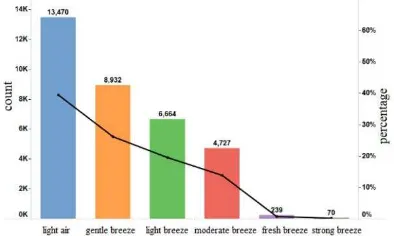
The maximum wind speed is 43.2km/h in Guangzhou Baiyun Airport from September to November of September 2016, and the minimum wind speed is 3.6km/h. Classifying the winds, as shown in Figure 5. The frequency of strong winds is the lowest with a frequency of 0.21%. The frequency of light air is the highest, and its frequency is 39.50%.
Figure 5. Occurrence percentage of different levels of wind
The effect of wind at each level on taxiing delay is not obvious as shown in Table 4.
Wind power Count Taxiing delay
ratio
light air 6664 69.19%
Breeze 13470 68.63%
gentle breeze 8932 68.91%
moderate breeze 4727 68.44%
cool breeze 239 66.57%
Gale 70 65.71%
Table 4. Taxi delay ratio under wind power
Wind direction
The number of occurrences of each wind direction is shown in Figure 6.
Flight No. Actual take-off time Delay time
/seconds Lon. Lat. Airlines
3U8162 2016/9/14 13:37:09 1029 113.3075 23.38364 Sichuan Airline 10 NNW 25.2 Partly Cloudy
3U8162 2016/9/16 13:34:56 896 113.3081 23.38583 Sichuan Airline 10 North 18 Mostly Cloudy
3U8162 2016/9/26 13:38:33 1113 113.2898 23.4001 Sichuan Airline 4 WSW 7.2 Haze
3U8162 2016/9/28 13:39:23 1163 113.2867 23.38882 Sichuan Airline 8 NW 32.4 Mostly Cloudy
3U8162 2016/10/2 13:40:25 1225 113.2856 23.38466 Sichuan Airline 10 ENE 7.2 Partly Cloudy
Figure 6. The number and proportion of wind direction
The three runways at Guangzhou Baiyun Airport are distributed in parallel. The wind direction that is the same as the aircraft take-off direction is defined as downwind, while the wind direction that is opposite to the take-off direction is defined as upwind. The other wind directions are defined as crosswinds as shown in Table 5. The taxiing efficiency of the upwind flight is obviously better, while that of the crosswind flights is slightly higher than that of the downwind flights.
Port No of 01R-19L-01R 14422 1965.264 1871.975 1918.629
01R-19L-19L 3049 1632.763 1513.634 1534.92
02L-20R-02L 12561 1818.843 1405.966 1478.643
02L-20R-20R 2767 1610.515 1562.279 1638.323
Table 5. The average delay time of each port in different wind directions
Visibility
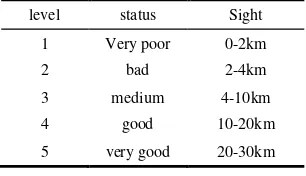
The range of visibility in the study area is 0.9 to 30 km, and they are classified into five grades according to the sight distance as shown in Table 6.
level status Sight
Table 6. Visibility levels
The taxiing delay rate increases as the visibility decreases as shown by Table 7.
Table 7. Percentage of taxiing delays under different visibilities
Airline Company
In Guangzhou Baiyun Airport, Southern Airlines owns the largest share (42.98%) in terms of flight, and its flight taxiing delay rate is 62.77%. The airline with the lowest share (0.28%) is Malaysia Airlines, but the flight delay is as high as 98.48%. Airlines are classified according to the airline's taxi delay ratio as shown in Table 8. It can be seen that the number of flights is not a direct cause of taxiing delay. The operation efficiency of airline is probably a major factor affecting taxiing delay.
level airline Delay ratio
Very poor
Malaysia Airlines 98.48%
Thai International Airways
Limited 95.97%
bad
China International
Airlines 80.26%
Indonesia Eagle Airlines 82.24%
medium
China West Airlines
Limited Liability Company 61.11% China Southern Airlines 62.77%
good
Chongqing Airlines 53.41%
Zhejiang Changlong
Aviation Co., Ltd 53.33%
Table 8. Taxiing delay ratio for different airlines
3. CONCLUSION
In order to obtain the quantitative impact effect of various factors on taxiing delay, this paper uses ADS-B data to calculate taxiing delay time by restoring taxiing route and identifying key status points, and further analyzes the impact factors of airport taxiing delay by investigating the relationship between delay time and environmental data such as weather, wind, visibility etc. The proposed method is applied to the Guangzhou Baiyun Airport. The experimental results validate the effectiveness of the proposed method.
ACKNOWLEDGEMENTS
This work was supported by the joint fund of the National Natural Science and Civil Aviation research foundation of China (No. U1533114), and the National Natural Science Foundation of China (No. 41601485).
REFERENCES
Feng, Y., Li, C., Wen, D., 2014. A historically rare incidence of extensive flight delays at Baiyun Airport on March 30-31, 2014, and analysis of characteristics of the associated process of severe concvection. Guangdong Meteorology, 36, pp. 6-10.
Krozel, J., Hoffman, B., Penny, S., Butler, T., 2003. Aggregate statistics of the national airspace system. AIAA Guidance, Navigation and Control Conference, Austin, Taxas.
Markovic, D., Hauf, T., Rohner, P., Spehr. U., 2008. A statistical study of the weather impact on punctuality at Frankfurt airport. Meteorological Applications, 15, pp. 293-303.
Zhang, J., Xu, X.H., Wang, F., Wei, D., 2010. Airport delay performance evaluation based on fuzzy linear regression model. Journal of Traffic and Transportation Engineering, 10, pp. 109-114.