APPLYING THIESSEN POLYGON CATCHMENT AREAS AND GRIDDED
POPULATION WEIGHTS TO ESTIMATE CONFLICT-DRIVEN POPULATION
CHANGES IN SOUTH SUDAN
Lisa Jordan
*Spatial Data Center, Drew University, Madison, New Jersey 07940
–
[email protected]
KEY WORDS:
Population Estimation
,
Internally Displaced Persons
,
South Sudan
,
Conflict
,
GIS
ABSTRACT:
Recent violence in South Sudan produced significant levels of conflict-driven migration undermining the
accuracy and utility of both national and local level population forecasts commonly used in demographic
estimates, public health metrics and food security proxies. This article explores the use of Thiessen
Polygons and population grids (Gridded Population of the World, WorldPop and LandScan) as weights for
estimating the catchment areas for settlement locations that serve large populations of internally displaced
persons (IDP), in order to estimate the county-level in- and out-migration attributable to conflict-driven
displacement between 2014-2015. Acknowledging IDP totals improves internal population estimates
presented by global population databases. Unlike other forecasts, which produce spatially uniform
increases in population, accounting for displaced population reveals that 15 percent of counties (
n
= 12)
increased in population over 20 percent, and 30 percent of counties (
n
= 24) experienced zero or declining
population growth, due to internal displacement and refugee out-migration. Adopting Thiessen Polygon
catchment zones for internal migration estimation can be applied to other areas with United Nations IDP
settlement data, such as Yemen, Somalia, and Nigeria.
1. BACKGROUND
The current armed conflict in South Sudan began in December 2013 in the capital, Juba (1). By the end of March 2017, 1.9 million people, over ten percent of the population, had been internally displaced, and 1.74 million South Sudanese had fled the country (OCHA South Sudan, 2017). Understanding the internal demographic dynamics, such as which counties have experienced increases or decreases in population, provides an important basis for negotiations on how to distribute limited humanitarian resources within South Sudan.
Though a wealth of research surrounds the demographic impact of conflict or disasters, see for example the edited volume
Famine Demography: Perspectives from the Past and Present
(Dyson & O Grada, 2002), most published work responds well after the events, in order to verify and validate the specific population impacts. Nevertheless, the humanitarian operations responding on the ground, during conflict, increasingly collect and distribute information about populations in UN designated sites, informal settlements that arise in response to conflict, and refugee camps (see, for example, (Inter-Agency Stading
* Corresponding author
1The Economist. 2014. “Destroying itself from within.” January 4 [downloaded 27 October, 2014].
Committee (IASC), 2010)). These numbers are essential to calculating food aid needs, appropriate medical responses, fund raising needs, and the distribution of limited monetary and human resources in ways that will be most effective (National Research Council, 2007; National Research Council, 2007). However foolhardy, this article seeks to honor the work of the many individuals and organizations invested in mitigating the worst suffering from conflict and disasters, by making an effort to document statistical techniques to estimate internal population change during conflict.
Official census estimates frequently form the basis for moving forward in discussions on mid- and post-disaster resource allocation, particularly when humanitarian collaborations involve local government response. The last official census of South Sudan was last taken in 2008, prior to independence from
Sudan. The Republic of South Sudan’s National Bureau of
In 2014, the National Bureau of Statistics produced population forecasts for counties for 2015-2020 (SSCCSE, 2014). Following official data, several organizations, including the
United Nations and the US Census Bureau’s International
Division, produced forecasts for South Sudan’s total population.
The 2014 estimates range between 11.296 and 11.563 million for South Sudan (United Nations, Department of Economic and Social Affairs, Population Division, 2013; United States Census Bureau, 2012), an increase by over 35 percent in five years.
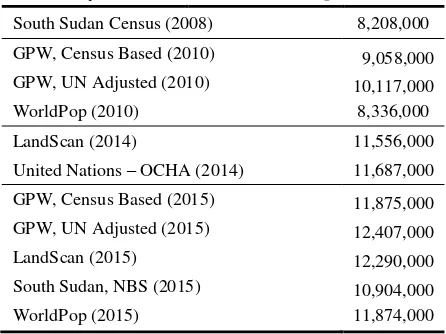
Several forecast models combine geographic information with age-sex distributions to generate estimates of population in South Sudan at the county level and for even smaller regional units, known as Payams. These estimates vary considerably for both national and local populations. The WorldPop database (WorldPop, 2013) contains population estimates, by age and sex, at 100 meter resolution for 2010 and 1 kilometer resolution for 2015 and 2020. Using GIS software, the high-resolution population grids can be totaled by county boundary, using zonal statistics, to produce county-level estimates for population totals. LandScan (Oak Ridge National Laboratory (ORNL), 2014), an annually updated global, demographic data set, also provides 1 kilometer forecasts for 2010-2015. For 2010, 2015 and 2020, Gridded Population of the World (GPW, version 4) created two sets of 1 km population grids: one set totals to UN Population Prospects Estimates and the other set totals to local census data. The South Sudan county estimates extracted from these data sets, as well as forecasts made by the United Nations to simply project county population growth from 2008 to 2020, using a constant growth rate, provide several different reference points. All of the forecasted population projections for South Sudan, displayed in Table 1, fail to incorporate the severe demographic disruption caused by conflict.
Data Set (year) Population Total
South Sudan Census (2008) 8,208,000
GPW, Census Based (2010) 9,058,000
GPW, UN Adjusted (2010) 10,117,000
WorldPop (2010) 8,336,000
LandScan (2014) 11,556,000
United Nations – OCHA (2014) 11,687,000
GPW, Census Based (2015) 11,875,000
GPW, UN Adjusted (2015) 12,407,000
LandScan (2015) 12,290,000
South Sudan, NBS (2015) 10,904,000
WorldPop (2015) 11,874,000
Table 1. Population Totals for South Sudan from Multiple Sources (excluding the Abyei region2)
In developing baseline county population estimates, UN OCHA (United Nations Office for the Coordination of Humanitarian Affairs) estimates were used because they reflect values that actors in the provision of humanitarian aid came to agree upon
2Hamer, Ashley. 2015. “Abyei, a non-state entity of post-war
Sudanese divide.” Al Jazeera, 1 July 2017.
(see Figure 1 for thematic map of county population estimates). However, the other reference points from WorldPop, Gridded Population of the World (version 4), LandScan, and the South Sudan National Bureau of Statistics demonstrates the significant uncertainty in estimating population. Table 1 lists the total population count values (for 2008) and forecasts (for 2010-2015), to compare different sources. For 2015, the values range from a minimum of 10.9 million from NBS to a maximum of 11.875 million from GPW.
In area, the country of South Sudan is slightly smaller than the state of Texas, at 619,000 km2. The smallest county in South
Sudan, with around ten thousand residents, is Nagero. The largest county is Juba in all estimates, except in UN OCHA estimates, where Aweil West is the largest, with a population less than 0.5 million. The relatively small county populations demonstrate the rural character of the country, where agrarian livelihoods dominate. The UN OCHA estimates differ from other UN estimates published by the population division. Again, the choice of estimates used has a great deal to do with compromise and negotiation among numerous actors. The county values also differ, so that the WorldPop figures, which are adjusted to match UN Population Prospects forecasts (WorldPop, 2013), predict lower county populations in the counties with the smallest and largest populations, compared with the UN OCHA estimates. The discrepancies between WorldPop and UN OCHA are further highlighted in Figure 1, where the WorldPop estimates for 20 of 78 counties are either twenty percent higher (16 cases) or lower (4 cases) than the UN OCHA estimates.
Often referred to as “propagation of error” in spatial analysis
(Haining, 1990), errors in data products compound when multiple data sources are compiled to create new data sets. Therefore, it is helpful to be cognizant of the potential disagreement in population estimates from different sources at the outset. All sources presented here report values with high precision; however, any informed observer should interpret the values with caution, perhaps on the order of two to three significant digits.
Spatial data have been used to generate information about populations in refugee camps, either though remote sensing (Checchi, et al., 2013; Lang, et al., 2010) or field surveys (Grais, et al., 2006), for individual sites. And, new research on tracking population movement through cell phone usage appears promising (Deville, et al., 2014). Figure 2 illustrates the WorldPop (2016) estimated internal migration flows for South Sudan, from 2005-2010, derived from a gravity-based model that applied census migration patterns from across the continent to South Sudan (Sorichetta, et al., 2016). The charts in Figure 2 suggest that prior to the most recent conflict, Jonglei likely received significantly more in-migration than out-migration, while Western Bahr el Ghazal produced substantively more out-migration than in-out-migration.
Figure 2. WorldPop Internal Migration Estimates, 2005-2010
For conflict-driven population changes that occur at the scale of counties, no best practices or guidelines for documenting short term population shifts, which use unclassified and accessible data sources, have been developed. This article sets out to remedy this gap by describing a geostatistical model for estimating monthly or quarterly shifts in sub-regional population totals due to internal displacement or refugee exodus. The opportunities to improve this process are many, and hopefully this article can serve as a starting point for ways to better understand demographic movements in the midst of conflict.
2. DATA
The reference population data from UN OCHA have been described, but several other spatial data sets complement the demographic baselines. The UN cartographic files for South Sudan are used (UNOCHA, 2008), and provide information about important geographic measurements, such as distance between settlements and the size (km2) of each county. Global
data from Natural Earth provide the boundaries for neighboring countries (Patterson & Kelso, 2014).
2.1 OCHA/IOM data
The UN Office for the Coordination of Humanitarian Affairs and International Organization for Migration (IOM) enlists an Information Management Officer to organize information collection, analysis, and distribution during a crisis. The
information officer for the South Sudan crisis from 2014-2015, Ambika Mukund, maintained an excel spreadsheet described as
a “Displaced Count Monitor” (UN OCHA, 2014), or more
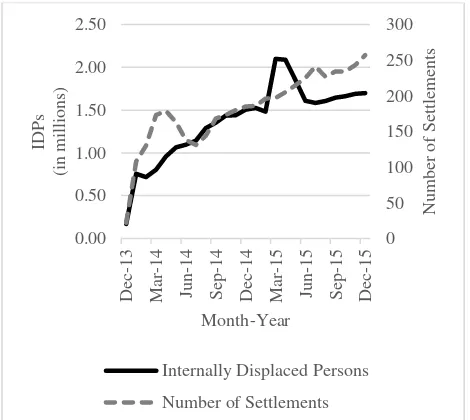
recently described as the “Displacement Tracking Matrix” (IOM, 2017). This spreadsheet contains settlement name, type, location (latitude and longitude), county, verification status, and number of IDPs (Internally Displaced Persons), beginning with the start of the conflict, December 23, 2013. Temporal updates on IDP numbers range from 1 to 20 day updates. On the first day of record keeping, eight IDP settlements were reported, and by December 2015, IOM had indexed over 250 settlements with IDP populations. Figure 3 charts the IDP population count and the number settlements over time. By the end of 2015, information on return refugee and IDP populations back to county of origin are also documented. The details on the displaced count monitor data speak to the emergence of information and record keeping that takes place upon onset of a crisis. Both population information and IDP information comprise part of the Common Operations Datasets (CODs) that can be obtained from the information officer for any disaster (Inter-Agency Stading Committee (IASC), 2010).
Figure 3. Internally Displaced Population Totals and Number of IDP Settlements in South Sudan, December 2013-2015
For a handful of counties, very detailed survey data provides county of origin information for nearly a complete population of refugees living in a small selection of camps. At this point though, not enough information exists to construct a county-by-county origin-destination migration matrix, which is ideal for best estimating population redistribution. However, the potential exists for the detailed household camp surveys to help better inform models of the way that populations respond to disaster. It should be noted though that these data are highly sensitive, and may include the full names of individuals and even children, along with very sensitive attributes, such as age, sex, county of origin, nationality, and pregnancy status.
2.2 UNHCR data
The UNHCR (2017) maintains a public access data portal for crisis areas, where updated information about refugees or IDPs
can be accessed. As of April 2017, of the 1.82 million refugees from South Sudan, 48.6 percent reside in Uganda, 21.4 percent in Sudan and 20.4 percent in Ethiopia (UNHCR, 2017). The remaining ten percent are in Kenya, the Democratic Republic of the Congo, and the Central African Republic. Refugee numbers are updated regularly, by country of destination (UNHCR, 2017). In many cases, refugee counts for specific camps within destination countries are also regularly updated. Origin information for refugees varies by destination. County of origin data for South Sudan refugees in Uganda were made fully available (UNHCR, 2014). In contrast, origin information for refugees in Ethiopia is qualitative. For example, situation reports (UNHCR, 2014), and communications with USAID Famine Early Warning System Network staff, mention interviews with people from Bor, Akobo, Ayod, and Nyior from Jonglei State, Maiwut, and Nasir from Upper Nile, and also reports of refugees coming from Guit and Koch of Unity. No information on county of origin for refugees in Kenya or Sudan has been identified.
2.3 ACLED
The Armed Conflict and Location Event Data (ACLED) Project records conflict events by date and by location, as well as the number of reported fatalities (Raleigh, et al., 2010). The database is produced by consolidating media reports that identify conflict events, the actors involved, the locations of the conflicts, and the fatalities from each event. As with the other data sources listed, the quality of the data may vary by location, timing, and reporting of the events; however, ACLED provides a very useful impression of the spatial and temporal dimensions that localized conflict take.
3. METHODS
The approach presented here illustrates the use of separate methods for identifying refugee flows and internal displacement flows. First, refugee flows to Kenya, Uganda, Ethiopia, and Sudan from each county are estimated using UNHCR Ugandan county of origin refugee data and ACLED in a linear regression. Second, a catchment model, using Thiessen polygons surrounding IDP camps, is used to predict the distribution of in- and out- movement of IDPs. Total out and in- estimates are used to generate an updated estimate of county population. Though longer term demographic models are driven by changes in fertility and mortality, the short term population change estimates include only changes generated by population movement. The ad hoc nature of the methods discussed reflects the disparity in data availability and quality across counties in South Sudan, but could be adapted easily to other situations with similar data gaps.
3.1 Refugee Estimation
To benefit from the quality of Ugandan refugee information, a simple OLS regression model was constructed, so that the rate of refugees from each county to Uganda was predicted using average distance to Uganda (from the centroid of the county of origin to the nearest refugee camp in hundreds of kilometers), county population density (persons per km2), number of conflict
events recorded in ACLED for 2014 by county, and number of fatalities recorded in ACLED, also for 2014 by county, up through July. The model explained 46 percent of the variation
in refugee rates. The coefficients for the model were applied to distance data for Kenya, Ethiopia and Sudan, and proportional rates were applied to generate total estimates of refugees to those states (UNHCR, 2014).
Variable (County of Origin)
Standardized Coefficient
Population Density (persons/km2) -0.165*
Number of Conflict Events 0.454***
Total Conflict Fatalities 0.286**
Table 2. Ordinary Least Squared Regression Results Predicting Refugee Rates from South Sudan Counties (n = 78) to Uganda
3.2 Estimating Baseline Population Distribution
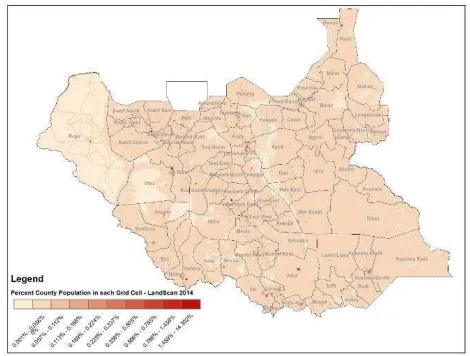
To estimate the baseline population distribution across South Sudan, the LandScan 2014 grid was used simply because it matched the year of UN OCHA estimates. First, the centroids of each grid cell were joined to UN OCHA administrative boundaries and population estimates for 2014. The proportion of county population residing in each LandScan grid cell was calculated (shown in Figure 4), and multiplied by the UN OCHA county estimate. The new surface produced uses the LandScan population distribution, where the county population totals match the UN OCHA values.
Figure 4. Proportion of County Population per Grid Cell
3.3 IDP Estimation of Internal Migration
The IDPs included in this count may have been dislocated within their own county, or they may have moved from another county. Catchment areas were generated for each IDP site, by creating Thiessen polygons in ArcGIS 10.1 (Figure 5). These areas provide a very simplified visualization of regions served by each IDP settlement. Sometimes the closest settlement is in the same county; sometimes it is in a different county.
Thiessen polygons, also known as Voronoi diagrams, proximal zones, or catchment areas, are created when, for a set of points,
the “zones represent full areas where any location within the
zone is closer to its associated input point than to any other input point” (ESRI, 2012). Centroids of neighboring countries were used to form the outer boundary for polygons along the edges, and the set of polygons were clipped by the political boundaries for South Sudan.
Figure 5. Thiessen Polygons for IDP Sites (December, 2015) and IDP Population by Catchment Area
There are a number of limitations to using Thiessen polygons as catchment areas. Mainly, there are numerous different ways to determine which settlement is closest or most accessible to any individual, besides distance: terrain (elevation and the presence of rivers, waterways, mountains, which may serve to expedite or impede transit), the presence of paths and roadways, access to cars or buses or other forms of transportation, familiarity with an area, in terms of its language, culture, or ties to family or extended family, and of course the many, varied socioeconomic barriers that render some options for movement unattainable. Perhaps the only advantage of the Thiessen polygon catchment model is its simplicity. As settlements increase or decrease in number, the polygon surface can be redrawn each time to reflect the nearest IDP settlement. Again, concerns about the propagation of error resurface with the catchment model approach. Unreported settlements and incomplete or inaccurate information about each settlement creates an additional source of error in estimating county population changes.
Importantly, close examination of the county-level summary statistics reveals that IDP camps report populations equivalent, or even larger than county population totals. From this alone, there is strong evidence indicating significant internal population disruption. For example, in Panyijar County, in Unity State, the December IDP population totaled 106,161, but even the highest estimate for the county population estimated a population of
74,734. Therefore, with the IDP data alone, county populations can be revised and improved from their last estimate.
For each catchment area, population proportions per grid cell were calculated, using the UN OCHA adjusted LandScan grid (Figure 6). The IDP totals for each polygon were then multiplied to LandScan grid proportional values, producing a population weighted distribution of IDP settlers across the catchment region. Next, a union between county boundaries and the catchment areas created single feature. Catchment areas for IDP sites lying outside the origin county boundaries were totaled to estimate in-migration to the county. Conversely, those values were used to calculate out-migration from counties, in cases where the nearest IDP site is located in a neighboring county.
Figure 6. Population Proportions within Catchment Areas
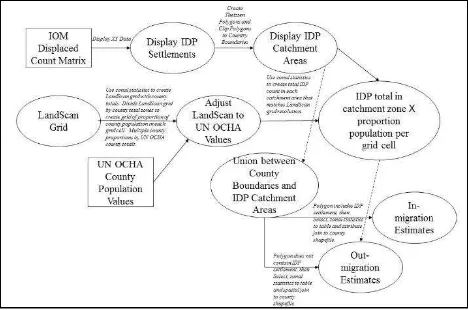
To summarize, Figure 7 presents a conceptual diagram of the sequence of steps used to generate internal migration estimates for each county. From the 2014 county population totals, net internal migration and net refugee migration is added to generate 2015 population estimates for each county. The values for each county are then reviewed by international offices and local field offices. Such feedback reveals newer or more reliable information, and the model estimates are iteratively updated to reflect improved data and knowledge about the region.
4. RESULTS
Internal net migration for each county can be estimated from internal displacement totals: internal in-migration minus internal out-migration. The counties with positive or negative net migration are highlighted in Figure 8. Areas experiencing the largest net changes in migration totals (Figure 8) and proportional population changes (Figure 9), such as Panyigar, Leer, Fangak, and Rubkona (increases) and Mayendit (decreases), map closely to emergency and famine food security classifications for mid-2017 (USAID, 2017).
Figure 8. Internal Migration Estimates for 2015
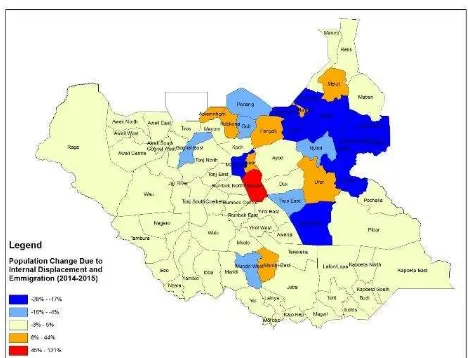
The results of internal migration were combined with the international out-migration estimates from the refugee model, which are shown in Figure 9. These values summarize the key regions of disruption, caused by conflict, based on modeling with existing data on IDPs and refugees. Unlike other forecasts, which produce spatially uniform increases in population; accounting for displacement population reveals that 15 percent of counties (n = 12) increased in population over 20 percent, and 30 percent of counties (n = 24) experienced zero or declining population growth, due to internal displacement and refugee out-migration.
Figure 9. Population Change Due to Internal Displacement and Refugee Out-Migration
5. CONCLUSIONS
In times of conflict, significant internal displacement may make estimating local populations extremely difficult. This is particularly problematic when even peace time estimates may suffer from high uncertainty as in South Sudan, where population projections differed by as much over 1.5 million people for 2015 (12 percent of the estimated population). Using limited data on the ground from various agencies, this article develops the use of population weights in Thiessen Polygon catchment areas for making local population estimates in times of high uncertainty and incomplete information.
There are numerous limitations to the approaches discussed here: some due to data constraints and some due to methodology. First, the initial UN estimates differ substantively from other mid-2014, non-conflict population estimates, based on comparisons from several other sources, including WorldPop (based on UN Population Division estimates), LandScan, Gridded Population of the World, the US Census International Program, and South Sudan’s NBR. Second, all approaches stemming from UN approved estimates do not apply a changing growth rate (e.g. changes in both fertility and mortality in the past year), which also may have a substantive impact on county populations.
Ideally, the process to import estimates for IDP settlements and refugee information can be systematized to more quickly produce county updates. As input data sets are updated on a monthly or quarterly basis, perhaps estimates for county population dynamics could also be generated with similar speed. To reiterate, these numbers then provide a starting point for negotiation and discussion among experts in the region that can comment on and correct errors due to model simplicity. Nevertheless, IDP settlement data alone directly confronts the validity of international database estimates used in gridded population databases, such as LandScan, WorldPop, and the Gridded Population of the World.
REFERENCES
Checchi, F., Stewart, B. T., Palmer, J. J. & Grundy, C., 2013. Validity and fesibility of a satellie imagery-based method for rapid estimation of displaced populations. International Journal of Health Geographics, 12(4), pp. 1-13.
Deville, P. et al., 2014. Dynamic population mapping using mobile phone data. PNAS, 11 November.pp. 15888-15893.
Dyson, T. & O Grada, C., 2002. Famine Demography: Perspectives from the Past and Present. New York: Oxford University Press.
ESRI, 2012. Create Thiessen Polygons, s.l.: s.n.
Grais, R. F. et al., 2006. Are rapid population estimates accurate? A field trial of two different assessment methods.
Disasters, 30(3), pp. 364-376.
Haining, R., 1990. Spatial Data Analysis in the Social and Environmental Sciences. Cambridge: Cambridge UP.
Inter-Agency Stading Committee (IASC), 2010. IASC Guidelines Common Operational Datasets (CODs) in Disaster Preparedness adn Response, Geneva: IASC.
IOM, 2017. Displacement Tracking Matrix, Geneva, Switzerland: s.n.
Lang, S. et al., 2010. Earth observation (EO)-based ex post assessment of internally displaced person (IDP) camp evolution and population dynamics in Zam Zam, Darfur. International Journal of Remote Sensing, November, 31(21), pp. 5709-5731.
National Research Council, 2007. Successful Response Starts with a Map: Improving Geospatial Support for Disaster Management. Washington, DC: The National Academies Press.
National Research Council, 2007. Tools and Methods for Estimating Populations at Risk from Natural Disasters and Complex Humanitarian Crises. Washington, DC: The National Academies Press.
Oak Ridge National Laboratory (ORNL), 2014. LandScan (2012) High Resolution Global Population Data Set, Oak Ridge: s.n.
OCHA South Sudan, 2017. South Sudan: Humanitarian Dashboard, s.l.: United Nations.
Patterson, T. & Kelso, N. V., 2014. Natural Earth 1:10m Cultural Vectors Admin 0 - Countries, version 3.1.0, s.l.: s.n.
Raleigh, C., Linke, A., Hegre, H. & Karlsen, J., 2010.
Introducing ACLED-Armed Conflict Location and Event Data.
Journal of Peace Research, 47(5), pp. 1-10.
Sorichetta, A. et al., 2016. Mapping Internal Connectivity through Human Migration in Malaria Endemic Countries.
Scientific Data 3.
SSCCSE, 2009. 5th Sudan Population and Housing Census - 2008: Priority Results, s.l.: Central Bureau of Statistics (CBS).
SSCCSE, 2010. Statistical Yearbook for Southern Sudan, Juba: Southern Sudan Center for Census, Statistics and Evaluation.
SSCCSE, 2014. Population Projections for South Sudan by County by Sex from 2008-2015, Juba: National Statistics Bureau.
UN OCHA, 2014. South Sudan: IDP Sites, Geneva: s.n.
UNHCR, 2014. Ethiopia: UNHCR Operational Update,
Geneva: s.n.
UNHCR, 2014. South Sudan Emergency: Regional overview of refugees from South Sudan, Geneva: s.n.
UNHCR, 2014. South Sudan: Areas of origin of newly arrived refugees in Uganda [15 Dec 2013 - 06 May 2014], Geneva: s.n.
UNHCR, 2017. UNHCR Data Portal. [Online] Available at: http://data2.unhcr.org/en/situations [Accessed 12 May 2017].
UNHCR, 2017. UNHCR South Sudan Situation: Regional overview of population of concern, s.l.: s.n.
United Nations, Department of Economic and Social Affairs, Population Division, 2013. World Population Prospects: The 2012 Revision, Volume 1: Comprehensive Tables, New York: United Nations.
United States Census Bureau, 2012. International Data Base,
Washington DC: s.n.
USAID, 2017. Famine Early Warning Systems Network (FEWS NET) Food Security Outlook Update: Conflict displaces well over 100,000 in April as extreme levels of food insecurity persist, Washington, DC: s.n.
WorldPop, 2013. Alpha version 2010 estimates of numbers of people per grid sqare, with national totals adjusted to match UN population division estimates, s.l.: s.n.
WorldPop, 2016. Africa: Internal Migration Flows 2010,