DOI: 10.12928/TELKOMNIKA.v15i3.5133 1389
Managers Perceptions towards the Success of
E-performance Reporting System
A’ang Subiyakto*1, Ditha Septiandani2, Evy Nurmiati3, Yusuf Durachman4, Mira Kartiwi5, Abd. Rahman Ahlan6
1,2,3,4Syarif Hidayatullah State Islamic University Jakarta, Indonesia
Jl. Ir. H, Juanda No. 95, 15412, Tangerang, Indonesia Ph/Fax: +6221 7401925/+6221 7493315
5,6International Islamic University Malaysia, Malaysia
Jl. Gombak, 50728, Kuala Lumpur, Malaysia. Ph./Fax: +60 361964000 /+60 361964053
*Corresponding author, e-mail: [email protected], [email protected],
evy.nurmiati@uinjkt.ac.id3, [email protected], [email protected], [email protected]
Abstract
Managers are the key informants in the information system (IS) success measurements. In fact, besides the determinant agents are rarely involved in the assessments, most of the measurements are also often performed by the technical stakeholders of the systems. Therefore, the results may questionable. This study was carried to explain the factors that influence the success of an e-performance reporting system in an Indonesian university by involving ± 70% of the managers (n=66) in the sampled institution. The DeLone and McLean model was adopted and adapted here following the suggestions of the previous meta-analysis studies. The collected data was analyzed using the partial least squares-structural equation modelling (PLS-SEM) for examining the four hypotheses. Despite the findings revealed acceptances of the overall hypotheses, the weak explanation of the user satisfaction variable towards the net benefit one had been the highlighted point. Besides the study limitations, the point may also be the practical and theoretical considerations for the next studies, especially for the IS success studies in Indonesia
Keywords: IS success, manager perspectives, e-performance reporting system, PLS-SEM
Copyright © 2017 Universitas Ahmad Dahlan. All rights reserved.
1. Introduction
One of the parameters for assessing the IS success is the manager perspectives [1-4], in respect of their key informant roles [5-7] across the system development life cycle [8-10]. It is reasonable why the popular IS success model adopted the issue within the system use dimension [11-14] by emerging the use and its user satisfaction constructs in particular. On the other side, most system practically tended to be implemented by ignoring this issue. Despite the fact that the people are involved in the pre-implementation assessments, the works are carried out by the system developers themselves. Not unsurprisingly, the results may have presented the questionable indications [15]. Besides the preliminary literature review indicated that the similar studies is still rare to be found in the context of e-performance reporting system [16] as one of the e-government applications in developing countries [17, 18], this study was also performed for responding the mentioned issues.
The study was employed to know what factors that affected the performance of the e-performance reporting system based on the manager perspectives in an Indonesian university. The system has been used by the internal auditor unit of the institution since 2013, in regard to implement the Government Regulation No. 46/2011 on “Assessment of the civil servant performance,” as an evaluation system of the employee performances. The DeLone and McLean’s [11] IS success model was adopted, excluding the use construct because of the mandatory issue [19, 20]. It was conducted based on recommendations of several meta-analysis study [4], [10], [12], [14]. The four relational research questions and its hypotheses were then formulated in regard to reaching the above mentioned purpose by considering the instrument, data, and its analysis method using PLS-SEM method.
objective of the research. The second one elucidates the literature review, including the theoretical framework and its hypothesis development. It is then followed by the research method section. The fourth section presents the results of the descriptive and its inferential analyses. The fifth section discusses the findings, contributions, limitations, and the recommendations of the study. Lastly, the paper is closed by the conclusion section.
2. Literature Review
An expensive price may have paid by many institutions which failed to implement IS in their businesses [21, 22]. The failures can even jeopardize the business, as it was reported by the previous studies [9], [23, 24]. This may be why many scholars [25] revealed that IS has been a competitive weapon in business, not only the business tools since the early 1980s. Referring to the IS definition of [26], it is not only about a technological entities, IS is also about the managerial and organizational domains. DeLone and McLean [11] clearly described that, their reputed model is developed referring to the three dimensions of its processional and causal model, that is the system creation, system usage, and the system impact dimensions. In the context of the similar logic, the creation dimension is related to the technological domains, that is the products of the IS development project [27]. Further dimensions are the managerial and organizational domains, in respect of the project management parts [27]. On the other word, despite the fact that many IS are revealed technologically as the success one, they may present the failures, in regard with the management, organization, and human issues [27].
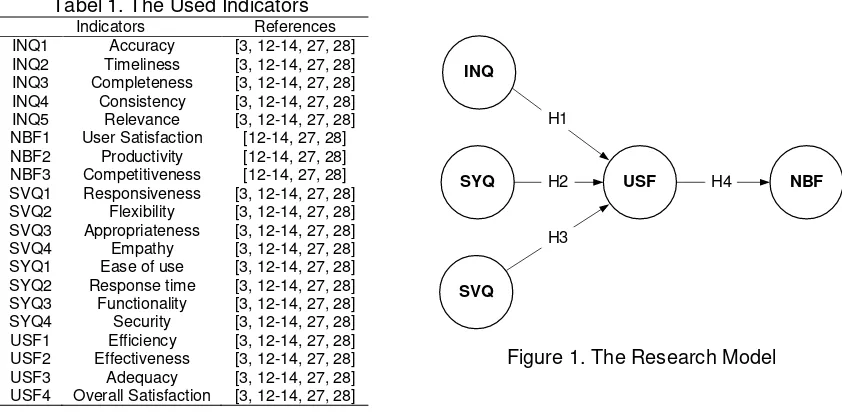
In this study, the popular IS success model [11] was adopted by following the suggestions of the previous meta-analysis studies [12-14], which described the comprehensiveness and validity of the model. In respect of both points, the researchers adopted the overall variables of the model, excluded the system use variable. It is related to the compulsory concept of the variable use, as it was previously indicated by Davis [19] and Seddon and Kiew [20]. Table 1 shows list of the used indicators referring to a number of the prior similar studies [3], [12-14], [28, 29]. In term of the linear processional and causal model of the adopted model [11] and considering also the sample number of the study [30]. Four hypotheses about the relationships among the five variables of the model (Figure 1) are determined , that is:
H1: Information Quality significantly affects User Satisfaction. H2: System Quality significantly affects User Satisfaction. H3: Service Quality significantly affects User Satisfaction. H4: User Satisfaction significantly affects Net Benefits.
INQ
SVQ
USF
SYQ H2 NBF
H1
H4
H3
Figure 1. The Research Model Tabel 1. The Used Indicators
The first three hypotheses demonstrate the path assessments between variables of the system creation dimension and variable of the system utilization one. Further, the last hypothesis describes the path examination between variables of the product utilization and its impact dimensions [12-14]. Here, the system is assumed as the product of the project development. In short, besides the adoption of the comprehensive and valid model following to the recommendations of above mentioned studies [12-14], the involvements of the key users as the research respondents are hoped for reaching the quality of the research findings. As it is indicated by Eddy et al [31] and Putra et al [10], besides the findings themselves, the research process points are also essential consideration for ensuring the quality of a research.
3. Research Method
This study was performed across its eight gradual stages, from the literature review in the first step into the report writing in the last one. Figure 2 presents the sequential implementation of the procedure, including the output of each one. Referring to Eddy, Hollingworth [31] and Putra, Subiyakto [10] around the clarity process of the research method; besides the result validity, the transparency of the implementation can be used to justify the research quality.
Figure 2. The Research Procedure
The data of the managerial positions (N= ± 130) were identified based on the human resource department database of the year 2016 in the sampled institution. Around 66 (± 70%) valid answers were then collected by employing the direct invitation survey. The survey was conducted by using a purposive sampling technique following the recommendation and permission of the internal auditor unit, which directly operates the system. It was in respect of the key informant aspect of the used sample [5-7]. The instrument of the data collection technique was a questionnaire set, which was consisted of its two main parts, i.e. the invitation letter page and its question pages. The question part was consisted of the five demographic questions and its 28 five-point linkert scale questionnaires [32]. Sequentially, the researchers mainly analysed the processed data by using the PLS-SEM method with the SmartPLS 2.0 , is used by many previous studies [33-38]. In the descriptive part of the analysis stage, the researchers analysed the demographic data by using the Microsoft Excel 2007 in order to looking the dissemination of the collected data, in regard to the estimation of the data [39] rather than its examination. In addition, the inferential analysis was then performed through two assessments; that is the measurement and the structural model assessments following the above mentioned the PLS-SEM studies. The first assessment was carried out by employing the indicator reliability, internal consistency reliability, convergent validity, and discriminant validity evaluations, in order to assess the psychometric properties of the outer model. On the other side, the second one was performed by implementing the path coefficient (β), coefficient of determination (R2), t-test, effect size (f2), predictive relevance (Q2), and the relative impact (q2) assessments for evaluating its inner model.
4. Analysis Results
4.1. The Demography Information
Table 2 shows the three parts of the information, including the gender, unit, and the managerial position of the sampled people. First, most of them (40 people, ±61%) were the female respondents and the rest were the male ones. Second, the distribution of the used sample spread out evenly across the faculties of the institution, within around six percentages (±9.09%) each faculty. Lastly, despite the involvement number of the administration unit supervisors was the highest one among the five managerial positions sampled in this study, the data distribution tended evenly within the listed positions.
Table 2. Demographic Information referring to the prior PLS-SEM literature [33-38].
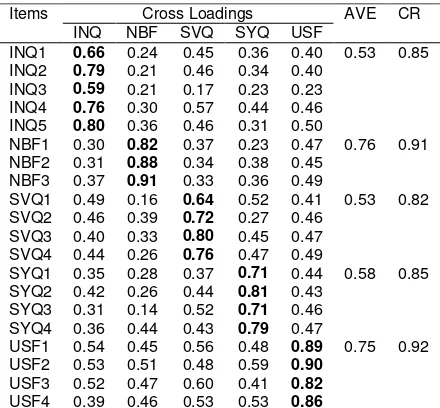
First, across the four assessments of the outer model the results revealed that the model part statistically demonstrates its psychometric properties without any the indicator deletions (Table 3, Table 4, and Figure 3). Table 3 and Figure 3 present that, overall loading values of the used indicators fulfilled the required threshold (>0.4) of the indicator reliability assessment. Results of the internal consistency reliability assessment revealed that, the CR values of the variables meet the determined threshold value (>0.7), as it is presented by Table 3. Results of the convergent validity assessment have also showed the similar tendency with the previous assessment. The AVE values of the five variables (Table 3) were higher than the minimum requirement value (>0.5). Table 4 shows results of the discriminant validity assessment, which fulfilled the Fornell and Larcker’s [40] “square root” formula.
Table 4. Fornell-Larcker Criterion
Items INQ SSC SVQ SYQ USF
INQ 1.00
NBF 0.37 1.00
SVQ 0.61 0.40 1.00
SYQ 0.47 0.37 0.58 1.00
USF 0.57 0.54 0.62 0.59 1.00
Second, Table 5 shows the inner model assessment results by using the path modelling, bootstrapping, and the blindfolding procedures [33-38].
1) The significance of the path coefficient were accounted using the path modelling procedure based on value of exceed 0.1 as the significant path and the results revealed that, the overall paths are the significant ones.
2) The hypothesis test was conducted using bootstrapping procedure and the results showed acceptances of the overall hypotheses with two-tailed and 5% standard error. 3) R2 was considered substantially around 0.67, averagely about 0.33, and weakly
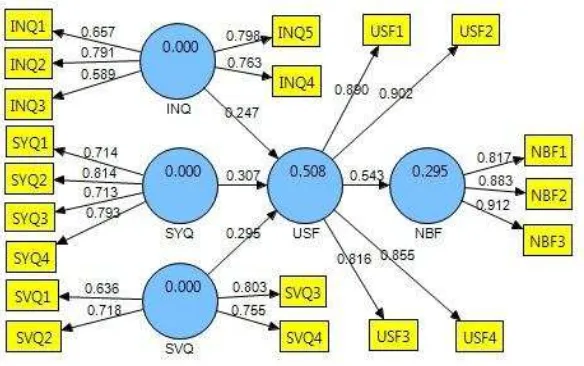
approximately 0.19 and lower. Figure 3 shows that, INQ, SYQ, and SVQ explained averagely (50.8%) of the USF variance and USF described weakly (29.5%) of the NBF variance.
4) The effect size of each path was calculated using the Cohen’s formula with thresholds of 0.02, 0.15, or 0.35 for the small, medium, or the large sizes. The results presented that, among the four paths, it was only USFNBF which has the large effect size. 5) In the predictive relevance examination, the positive values used for confirming the
predictive relevance of a path. The results indicated that, overall paths are predictive relevance.
6) Similar to the effect size, the relative impact of the predictive relevance was calculated by using values of 0.02, 0.15, or 0.35 for the small, medium, or the large sizes. The results showed that, the first three paths have the small impacts and the last one has medium impact.
Figure 3. Results of the Outer Model Assessment
Table 5. Results of the Structural Model Assessments H β t-test R2
(R2 in)
f2 Q2 (Q2
in)
q2 Analyses
R2 ex ∑ f2
Q2
ex ∑ q2 β
t-test R2 f2
5. Discussions
First, although the demography information of the study was only described within its three data entities, but its consistency and the even distribution of the data with the existing phenomena of the sampled institution may have been the highlighted point of the this study. For example, the presented information of the gender and job compositions tended to represent the real data. Besides the number of the woman employees is bigger than the man ones, the total of the supervisor position is also the biggest one among the managerial positions in the sampled institution. On the other part, the even tendency of the sample distribution has also referred to the number of faculty unit of the institution. Referring to Christopher et al [29], despite the fact that the information was only limited within its three data entities, the representation can be used to estimate the findings of the study. Thus, it is recommended for the future studies to use the more data in the demographic part. The more data types may be more helpful for estimating the research findings.
Second, the psychometric properties of the measurement model supported structural model assessments [33-38]. In the second inferential analysis part, the two tendencies of these assessments are relate to the similar indications among the first three paths of the model in the six assessments and the contradiction results of the fourth path (Table 5). Besides their coefficients were significant, the hypotheses were accepted, coefficient of the determinations were average, the effect sizes were small, and the predictive relevance were predictable, the relative impacts of the paths were also small. Like the first three paths, the path coefficient, its hypothesis, and the predictive relevance of the fourth path have also presented the similar indication. But, it was different in the rest explanation results. Although the effect size was large and its relative impact was also medium, but the coefficient of its determination was weak. In term of the hypothetical results, despite the acceptance of the four paths are confirmed by the prior three meta-analysis studies [11, 12], [41], but two of the paths (i.e. SYQUSF and USFNBF) are inversely confirmed by the previous researches [1, 29].
Besides the psychometric status, the zero deletion is also not unsurprisingly. It may relate to the used research model, which was adopted from the previous popular model [11, 12], [41], in the term of IS success measurement studies. As it is indicated by the tendencies of the structural model measurement results, the relationship may also happen to the measurement part. However, the different impact may have revealed by the fourth path, as it is presented by the weak coefficient of the path determination and the two prior studies [1, 33]. The researchers hypothesize that; it may in regard to the instrument and data used in this study. Another possibility, this may also relate to the phenomena of the sampled institution. It can be seen that, these study limitations may be one of the consideration of the future study implementation.
Despite the fact that, the research findings may not theoretically contribute to the IS success model development, but the findings are still interesting how to see the IS success perspective, especially from the perspectives of e-performance reporting system in the developing countries, like Indonesia. Practically, referring to the presented research findings, stakeholders of the sampled institution can consider that; although the INQ, SYQ, and SVQ variables effect together toward the variable of USF, but the explanations are only around 50.8% of the dependent variable. The rest explanations are not yet to be presented here. Moreover, it is also happen on the influence of the USF variable towards the NBF one. It is 69.5% of the NBF explanations, which are also yet presented by the research finding. Therefore, the next studies are needed to be conducted in order to explain the matter.
6. Conclusion
References
[1] Subiyakto A, Ahlan AR, Kartiwi M, Sukmana HT. Measurement of Information System Project Success Based on Perceptions of the Internal Stakeholders. International Journal of Electrical and Computer Engineering (IJECE). 2015; 5(2): 271-9.
[2] Subiyakto A, Ahlan AR, Kartiwi M, Sukmana HT. Influences of the Input Factors towards Success of An Information System Project. TELKOMNIKA Indonesian Journal of Electrical Engineering. 2015; 13(2): 686-93.
[3] Subiyakto A, Ahlan AR, Kartiwi M, Putra SJ, Durachman Y. The User Satisfaction Perspectives of the Information System Projects. Indonesian Journal of Electrical Engineering and Computer Science. 2016; 4(1).
[4] Nguyen TD, Nguyen TM, Cao TH, editors. Information Systems Success: A Literature Review.
International Conference on Future Data and Security Engineering; Springer. 2015:
[5] Homburg C, Klarmann M, Reimann M, Schilke O. What drives key informant accuracy? Journal of Marketing Research. 2012; 49(4): 594-608.
[6] Beringer C, Jonas D, Kock A. Behavior of internal stakeholders in project portfolio management and its impact on success. International Journal of Project Management. 2013; 31(6): 830-846.
[7] Sharma A, Altinay L, O'Neill JW. Using focus groups as a tool to develop a hospitality work-life research study. International Journal of Contemporary Hospitality Management. 2012; 24(6): 873-885.
[8] Jugdev K, Müller R. A retrospective look at our evolving understanding of project success. Project Management Journal. 2005; 36(4): 19-31.
[9] Subiyakto A, Ahlan AR, editors. A coherent framework for understanding critical success factors of ICT project environment. International Conference on Research and Innovation in Information Systems, ICRIIS; 2013; Kuala Lumpur.
[10. Putra SJ, Subiyakto A, Ahlan AR, Kartiwi M. A Coherent Framework for Understanding the Success of an Information System Project. TELKOMNIKAIndonesian Journal of Electrical Engineering. 2016; 14(1): 302-308.
[11] Delone WH, McLean ER. The DeLone and McLean model of information systems success: a ten-year update. Journal of management information systems. 2003; 19(4): 9-30.
[12] Petter S, DeLone W, McLean E. Measuring information systems success: models, dimensions, measures, and interrelationships. European journal of information systems. 2008; 17(3): 236-63. [13] Urbach D-W-IN, Smolnik S, Riempp G. The state of research on information systems success.
Business & Information Systems Engineering. 2009; 1(4): 315-25.
[14] Urbach N, Müller B. The updated DeLone and McLean model of information systems success.
Information systems theory: Springer. 2012. p. 1-18.
[15] Remencius T, Sillitti A, Succi G. Assessment of software developed by a third-party: A case study and comparison. Information Sciences. 2016; 328: 237-49.
[16] Al-Raisi A, Amin S, Tahir S. Evaluation of e-performance analysis and assessment in the United Arab Emirates (UAE) Organizations. Journal of Internet and Information Systems. 2011; 2(2): 20-7. [17] Wahid F. The current state of research on eGovernment in developing countries: A literature review.
International Conference on Electronic Government; Springer. 2012.
[18] Wahid F. Themes of research on eGovernment in developing countries: Current map and future roadmap. System Sciences (HICSS), 2013 46th Hawaii International Conference on; 2013: IEEE. [19] Davis FD. Perceived usefulness, perceived ease of use, and user acceptance of information
technology. MIS quarterly. 1989: 319-340.
[20] Seddon P, Kiew M-Y. A partial test and development of DeLone and McLean's model of IS success.
Australasian Journal of Information Systems. 1996; 4(1).
[21] Mkoba E, Marnewick C. IT Project Success: A Conceptual Framework for IT Project Auditing Assurance. Proceedings of the Annual Conference of the South African Institute of Computer Scientists and Information Technologists; 2016: ACM.
[22. Rus S, Mocan M, Ardelean B-O, Ivascu L, Cioca LI. Conceptualization and Examination of Success Factors in the Banking System. Procedia Economics and Finance. 2016; 39: 679-684.
[23] Clancy T. The Standish Group CHAOS Report. Project Smart. 2014.
[24] Xu X, Zhang W, Barkhi R. IT infrastructure capabilities and IT project success: a development team perspective. Information Technology and Management. 2010; 11(3): 123-142.
[25] McFarlan F. The Computer: Your Strategic Business Weapon. Retail Contml. 1986; 54(2): 2-28. [26. Bouwman H, Van Den Hooff B, Van De Wijngaert L. Information and communication technology in
organizations: adoption, implementation, use and effects: Sage; 2005.
[27 Wateridge J. How can IS/IT projects be measured for success? International Journal of Project Management. 1998; 16(1): 56-63.
[29] Subiyakto A, Ahlan AR, Kartiwi M, Putra SJ. Measurement of the information system project success of the higher education institutions in Indonesia: a pilot study. International Journal of Business Information System. 2016; 23(2): 229-247.
[30] Marcoulides GA, Saunders C. Editor's comments: PLS: a silver bullet? MIS quarterly. 2006: iii-ix. [31] Eddy DM, Hollingworth W, Caro JJ, Tsevat J, McDonald KM, Wong JB. Model transparency and
validation a report of the ISPOR-SMDM Modeling Good Research Practices Task Force–7. Medical Decision Making. 2012; 32(5): 733-743.
[32] Kaptein MC, Nass C, Markopoulos P. Powerful and consistent analysis of likert-type ratingscales.
Proceedings of the SIGCHI Conference on Human Factors in Computing Systems; 2010: ACM. [33] Henseler J, Ringle CM, Sinkovics RR. The use of partial least squares path modeling in international
marketing. Advances in international marketing. 2009; 20(1): 277-319.
[34] Urbach N, Ahlemann F. Structural equation modeling in information systems research using partial least squares. JITTA: Journal of Information Technology Theory and Application. 2010; 11(2): 5-40. [35] Hair JF, Ringle CM, Sarstedt M. PLS-SEM: Indeed a silver bullet. Journal of Marketing theory and
Practice. 2011; 19(2): 139-152.
[36] Hair JF, Sarstedt M, Ringle CM, Mena JA. An assessment of the use of partial least squares structural equation modeling in marketing research. Journal of the academy of marketing science.
2012; 40(3): 414-433.
[37] Afthanorhan W. A comparison of partial least square structural equation modeling (PLS-SEM) and covariance based structural equation modeling (CB-SEM) for confirmatory factor analysis.
International Journal Engineering and Science Innovative Technologies (IJESIT). 2013; 2(5): 8. [38] Wong KK-K. Partial least squares structural equation modeling (PLS-SEM) techniques using
SmartPLS. Marketing Bulletin. 2013; 24(1): 1-32.
[39] Christopher J, Schertzer CB, Schertzer S. Accounting Faculty Internships: A Descriptive Study.
SAGE Open. 2013; 3(3): 1-18.
[40] Fornell C, Larcker DF. Evaluating structural equation models with unobservable variables and measurement error. Journal of marketing research. 1981; 18(1): 39-50.
[41] DeLone WH, McLean ER. Information systems success: The quest for the dependent variable.