1
The effect of Efficiency, Service Quality, Aesthetics, and Play against the Perceived Value, Satisfaction, and Loyalty at Ibis Hotels Indonesia
Andy Raymond Willyanto Juliani Dyah Trisnawati Prita Ayu Kusumawardani
Faculty of Business and Economics University of Surabaya
Abstract
This study aims to determine the effect of efficiency, service quality, play, and
aesthetics on perceived value, satisfaction, and loyalty at Ibis Hotels in Indonesia.
The data used in this study are primary data, ie data obtained from questionnaires.
Target population used in this study is customers who stayed at Ibis Hotels in
Indonesia. Characteristics of the population used in this study is male or female, at
least minimum education is high school, a minimum age of 18 years, domiciled in
Indonesia, stayed at Ibis Hotels in Indonesia at least 2 days 1 night, the last time to
stay at Ibis Hotels in Indonesia maximal 1 last year.
This study uses cedar measurement interval, ie nominal and ordinal scale of
measurement which also presents information about the differences quantity
concept of observation to another observation. Type of measurement scale used is
a numerical scale that uses five levels of response options that are already
available in every statement contained in the questionnaire. The number of
respondents used in this study was 285 respondents. This study using Structural
Equation Model (SEM) with AMOS 22.0 software for windows. The results of the
research results that efficiency, aesthetics direct and positive effect on perceived
value; service quality has no effect on perceived value, the play is not a positive
effect on perceived value; perceived value direct and positive impact on
satisfaction; satisfaction and positive direct effect on loyalty; service quality is not
a positive effect on loyalty; play a direct and positive effect on loyalty; Aesthetics
has no effect on loyalty.
Keywords: Perceived Value, Satisfaction, Loyalty.
1. Introduction
The development of tourism should be supported by the development of
2
travel somewhere more comfortable or easier to reach. The development of
accommodation is happening as it is today one of which is the development of the
hotel.
Research conducted by Clemes et al. (2011), Cronin et al. (2000) in Ren et
al. (2016) have demonstrated that the behavior of the next customer when it
comes to a place that is affected by customer satisfaction, where it was influenced
by the experiences they feel (Chen and Chen, 2010; Zins, 2002). The study of
value has shifted from an increase in the conceptual phase into the latest phase of
development and measurement methodologies. This phase has been considered to
have two main approaches (Gallarza and Gil-Saura, 2006: 438): intra-variable
approach that emphasizes differences in the nature dimension of value and
perspective of inter-variable using the final model to assess the relationship
between value and other variables.
The developments of hotel business that occurred in this era to make the
world's largest international hotel operator Accor Group Hotels targeting a total of
100 new hotels within the next five years almost 50% of whom are hotel brand
Ibis. Ibis Hotels which is part of the Accor Group Hotels has made a wide range
of variants of Ibis Hotels. Variants of Ibis hotels now into three brands, namely
Ibis, Ibis Styles and ibis budget. Ibis Hotels has reached more than 1800 hotels
with 3 brands that are scattered throughout the world, where 3 brand allows hotel
guests to choose which one best suits them.
2. Literature Review
2.1. Hotel
Hotel is a business that a person associated resting accommodation for
everyone who is able and willing to pay a reasonable amount of money for the
services and facilities provided and who is in such conditions that would be
acceptable (Benny Chan et al., 2013, p.30 ). Hotel classified as a commercial
building provides accommodation, food and other guest services. In some
countries, hotel built to serve families the middle class and, the general economy
boomed and increased room supply; Hoteliers then focused on customized
3
accommodations such as conventioneers, business groups, and for special events
such as a family event. Hotels very varied in both style and service received, from
luxury, business, resort, townhouse for boutique and budget.
2.2. Intra – variable value research
First, there are two classical approach is very relevant in this case: the
acquisition versus the difference in the value of transaction (Monroe, 1979, 1990
in Gallarza et al., 2015) and hedonic versus dichotomy utilitarian value (Holbrook
and Hirschman, 1982 in Gallarza et al., 2015). This dichotomy is also under
pinning of service logic - dominant, when distinguishing between value in use and
value in exchange (Vargo and Lusch, 2004 in Gallarza et al., 2015).
Secondly, another approach to multidimensional value is proposed Sheth et al.
(1991) in Gallarza et al. (2015), which considers the functional, emotional,
epistemic, conditional, and social dimensions. This job is the origin of PERVAL
scale development proposed by Sweeney and Soutar (2001) in Gallarza et al.
(2015) and then used in many service settings (Chi and Kilduff, 2011; Grace and
O'Cass, 2005; Wong and Dean, 2009 in Gallarza et al., 2015).
2.2.1. Efficiency
Efficiency is an additional functional benefits that are actively experienced
by consumers (Holbrook, 1999 in Gallarza et al., 2013). Efficiency in the context
of tourism will be felt cognitively, for example in the accuracy of the information
which the accuracy of the information is important in tourism.
2.2.2. Service Quality
Service Quality is the result of an evaluation process in which consumers
compare between their expectations with the service that has been felt / receipt
(Grőnoos, 1984 in Lai and Hitchcock, 2016). Grőnoos (1984 in Lai and
Hitchcock, 2016) has also identified two-dimensional constructs associated with a
given service quality which it also included the technical quality and functional
quality or associated with how a service was delivered.
2.2.3. Play
Play or which can be ascertained as the perception of entertainment,
4
Play is self-oriented experience to actively seek out and enjoy something for its
own sake (Holbrook, 1999 in Gallarza et al., 2013).
2.2.4. Aesthetics
Aesthetics is also involved in the tourism experience, because it is
associated with the perception of travel itself will lead to the aesthetics in place -
the sights (Moulin, 1996 in Gallarza et al., 2013). Aesthetics is the appreciation of
some of the consumption experience (like beauty) the intrinsic worth as a self-end
regardless of purpose is more practical (Holbrook, 1999 in Gallarza et al., 2013).
2.2.5. Perceived Value
Consumer experience with the hotel will result in certain consequences are
reflected in customer perceived value. According to Zeithaml (1988) in the Walls
(2013) Perceived Value is the overall consumer ratings and usefulness of products
or services based on the perception of what is acceptable and what is given.
2.3. Inter – variable value research
Conceptually and empirically, good value and satisfaction is considered the
main driver of consumer behavior, the value which is considered the best and
most related to satisfaction (Day and Crask, 2000; McDougall and Levesque,
2000; Oliver, 1999; Parasuraman, 1997; Woodruff, 1997 in Gallarza et al., 2015).
According Gallarza et al. (2011), Lin et al. (2005) in Gallarza et al. (2015) states
there is a natural link between the quality, value, and satisfaction. According to
Zeithaml and Bitner (1996) in Gallarza et al. (2015) states the relationship quality,
value, and satisfaction leads to loyalty as a result, in its various forms (positive
word-of-mouth, the willingness to pay more).
2.3.1. Customer Satisfaction
Customer Satisfaction means the evaluation of the relationship between
customer expectations and actual performance of services, the customer is
satisfied when the hotel services met or exceeded their expectations (Oliver, 1997
in Liu et al., 2013). Customer Satisfaction has an important role in the hospitality
business and also has made efforts to maintain and improve customer satisfaction
(Yuksel and Yuksel, 1990; Oliver and DeSarbo, 1988; Parasuraman et al., 1988 in
5 2.3.2. Loyalty
Loyalty is defined as a person's behavior that aims to do the looping / have a
positive word of mouth about the same service, and it could be the end result of
any other assessment (Cronin et al., 2000, in Gallarza et al., 2013). Loyalty on the
other hand can lead to a positive relationship with the brand (Jacoby et al., 1978;
Foxall, 1994; Reichheld, 2006 in Srivastava and Kaul, 2016), which suggests a
strong commitment to an attitude that is required for their brand loyalty.
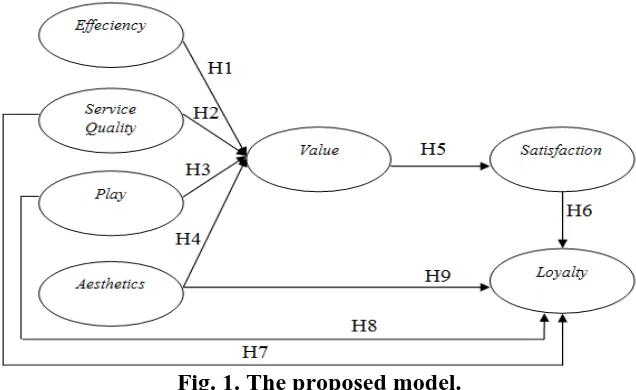
2.4. Model construction
Joint research inter-value and intra-value depends on the proposed structural
model supports three types hypothesis, the first two corresponding each - each
perspective of the value of research intra-variable and inter-variable, and the third
is the specific conditions in this study that seeks to explain loyalty not only
through a series of classic effects "quality service - customer satisfaction" but also
through the effect of direct and indirect effect on the value dimension in customer
loyalty.
Fig. 1 illustrates the structure of direct and indirect relationships proposed in
this study, where the construction of exogenous support inter – variable approach,
and construction of exogenous describe inter-variable approach to research value.
This picture was completed in the third group of hypotheses, which showed that
three of the four dimensions of value are also antecedents directly on customer
loyalty.
6
This study proposes the following hypothesis:
H1.Perceptions of efficiency directly and positively influence perceived value.
H2.Perceptions of service quality directly and positively influence perceived
value.
H3.Perceptions of play dimension directly and positively influence perceived
value.
H4.Perceptions of aesthetics directly and positively influence perceived value.
H5.Perceived value directly and positively influences customer satisfaction.
H6.Customer satisfaction directly and positively influences customer loyalty.
H7.Perceptions of the service quality dimension directly and pos-itively influence
loyalty.
H8.Perceptions of the play dimension directly and positively influence loyalty.
H9.Perceptions of the aesthetics dimension directly and positively influence
loyalty.
3. Research method
This type of research is causal research, which is research being done to find a
causal link and describe the phenomenon that occurs with based on the existing
theory (Zikmund et al., 2010, p.53). This research will be testing the causal
relationship: efficiency, service quality, play, aesthetics as the independent
variable and perceived value, satisfaction, loyalty as the dependent variable to the
Ibis hotels in Indonesia. This study uses a quantitative approach, which means
primary data collected will then be performed if the data using statistical analysis.
Primary data is data obtained by the distribution of questionnaires to the
respondents.
Questionnaires were distributed related to efficiency, service quality, play,
aesthetics, perceived value, satisfaction, and loyalty at Ibis Hotels in Indonesia.
Questionnaires were distributed to the respondents who stayed at Ibis Hotels in
Indonesia, education last a minimum of senior high school, a minimum age of 18
years, domiciled in Indonesia, stayed at Ibis Hotels in Indonesia at least 2 days 1
night, the last time to stay at Ibis Hotels in Indonesia maximum 1 last year. This
7
judgment on the statement that is measured in a scale of 5 levels. Values are
getting close to 1 means "strongly disagree" to the statement given, while the
value is getting closer to the number 5 means "strongly agree" with the statement
given.
This study uses non – probability sampling and sampling technique chosen is
judgment sampling, which this research select respondents based on certain
characteristics (Zikmund et al., 2010). Referring to Hair et al. in Ferdinand (2002,
47) suggests a sample size of 100-200 is the most appropriate. This study using
SPSS 18.0 for windows and AMOS 22.0 for windows to process the data that has
been obtained. SPSS 18.0 for windows used for data processing methods to test
the validity, reliability test, mean, standard deviation. AMOS 22.0 for windows
used for the data processing method of measurement model, structural model and
hypothesis testing.
4. Results and discussin of findings
Based on the respondent data that has been obtained is known that most of
the respondents who stayed at Ibis Styles, respondents were female, aged 18-25
years, with the last high school education, has the job of student / student.
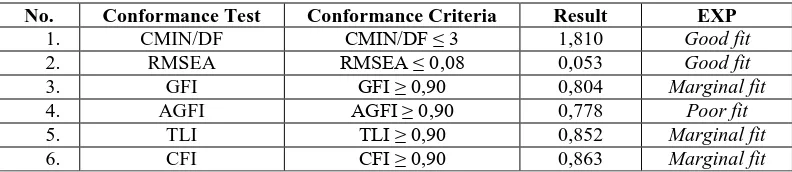
4.1. The measurement model evaluation
Table 1. Result of Measurement Model
No. Conformance Test Conformance Criteria Result EXP
1. CMIN/DF CMIN/DF ≤ 3 1,810 Good fit
2. RMSEA RMSEA ≤ 0,08 0,053 Good fit
3. GFI GFI ≥ 0,90 0,804 Marginal fit
4. AGFI AGFI ≥ 0,90 0,778 Poor fit
5. TLI TLI ≥ 0,90 0,852 Marginal fit
6. CFI CFI ≥ 0,90 0,863 Marginal fit
Table 1 is based on test results match the measurement model, five the
value of six values of goodness of fit is in conformity with the existing provisions
so that it can be concluded that the model fit.
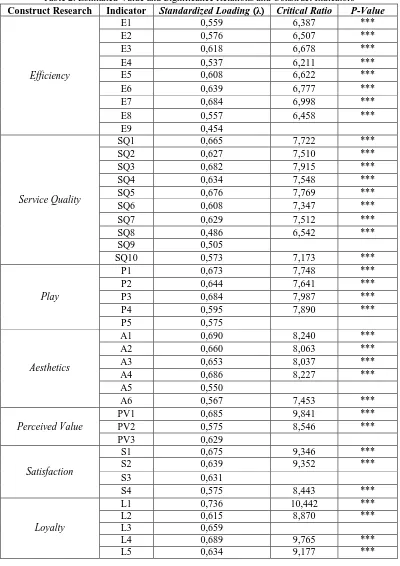
Table 2 shows the value of the standardized loading of each indicator.
Standardized loading value that has a value of ≥ 0.5 indicates that these indicators could be said to be valid. This study shows the results of the indicators E9 and
SQ8 have standardized loading value <0.5 is the E9 indicator amounted to 0.454
8
indicator for the indicators are not valid. After removal and counted again noted
that there is one more indicator that is said to be invalid, namely in SQ9. On
indicators SQ9 the removal and counted again.
Table 2. Estimated Value and Significance Relations and Construct Indicators Construct Research Indicator Standardized Loading (λ) Critical Ratio P-Value
9
Table 3. Measurement Model(Without E9, SQ8 and SQ9)
No. Conformance Test Conformance Criteria Result EXP
1. CMIN/DF CMIN/DF ≤ 3 1,811 Good fit
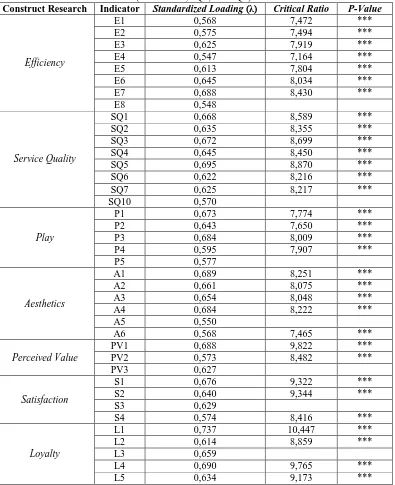
Table 4. Estimated Value and Significance Relations and Construct Indicators (Without E9, SQ8, and SQ9)
Construct Research Indicator Standardized Loading (λ) Critical Ratio P-Value
10
Table 3 is based on the test results match the measurement model, five the
value of six values of goodness of fit is in conformity with the existing provisions
so that it can be concluded that the model fit.
Table 4 shows the value of the standardized loading of each indicator.
Standardized loading value that has a value of ≥ 0.5 indicates that these indicators
could be said to be valid. This study shows that all the indicators are qualified. To
view the validity can also be seen from the AVE (Average Variance Extracted)
≥0,5. According Verhoeff et al. (2002) AVE value of 0.4 is enough to show a good construct validity.
Table 5. Average Variance Extracted (Without E9, SQ8 and SQ9)
Variabel (∑std. loading)2 ∑error AVE
Efficiency 2,908525 5,091475 0,363565625
Service Quality 3,302492 4,697508 0,4128115
Play 2,021188 2,978812 0,4042376
Aesthetics 2,432338 3,567662 0,405389667
Perceived Value 1,194802 1,805198 0,398267333
Satisfaction 1,591693 2,408307 0,39792325
Loyalty 2,232502 2,767498 0,4465004
Variable efficiency, perceived value and satisfaction despite having AVE
values below 0.5 or 0.4 can still be considered valid because the value of the
standardized loading that already have a value above 0.5. According to the table 4
can be shown that all the indicators of each variable of this study have shown
good validity as per indicators and per construct research. Measurement validity
have been met, then continued on the measurement reliability.
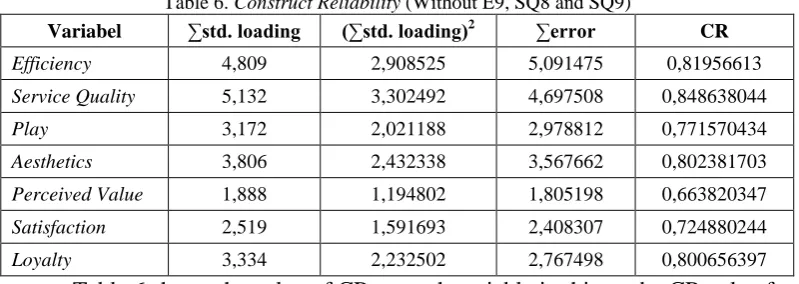
Table 6. Construct Reliability (Without E9, SQ8 and SQ9)
Variabel ∑std. loading (∑std. loading)2 ∑error CR
Efficiency 4,809 2,908525 5,091475 0,81956613
Service Quality 5,132 3,302492 4,697508 0,848638044
Play 3,172 2,021188 2,978812 0,771570434
Aesthetics 3,806 2,432338 3,567662 0,802381703
Perceived Value 1,888 1,194802 1,805198 0,663820347
Satisfaction 2,519 1,591693 2,408307 0,724880244
Loyalty 3,334 2,232502 2,767498 0,800656397
Table 6 shows the value of CR on each variable in this study. CR value for
each variable in this study has the value construct reliability ≥0,70 but there is one
11
value in the variable perceived value has a value of 0.663820347 where,
according to Hair et al. (2010) that has a variable CR values between 0.6 and 0.7
is acceptable.
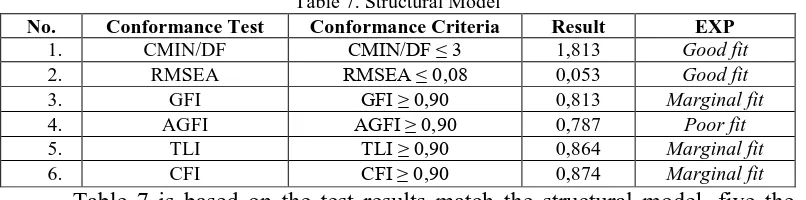
4.2.Structural Model
Table 7. Structural Model
No. Conformance Test Conformance Criteria Result EXP
1. CMIN/DF CMIN/DF ≤ 3 1,813 Good fit
Table 7 is based on the test results match the structural model, five the
value of six values of goodness of fit is in conformity with the existing provisions
so that it can be concluded that the model fit.
Table 8. Results Hypothesis Test
Hyphotesis Relation Estimate Value Critical Ratio P – Value EXP
H1 EPV 0,302 2,013 0,044 SUPPORTED
Based on table 8 can be known that H1 is supported by the estimate value of
the relationship between efficiency with the perceived value is 0.302 with a
critical ratio 2.013. Efficiency owned Ibis Hotels in Indonesia affecting customer
perceived value.
Based on table 8 can be known that H2 is not supported by the estimate value
of the relationship between service quality with the perceived value is 0.298 with
a critical ratio 1.792. Service quality possessed Ibis Hotels in Indonesia have not
been able to increase the perceived value of customers. Customers Ibis Hotels
after stay feel that the services provided are not too different from other hotels so
12
Based on the table 8 can be known that the H3 is not supported by the estimate
value of the relationship between play with the perceived value is -0.010 with a
critical ratio -0.081. The results of this study refers to the fact that as many as
86.7% of respondents aged 18-25 years, who are mostly students, causing them
tend to be less concerned with the activities of children/ family activities. The
results obtained have meant a play-owned Ibis hotels in Indonesia is getting better
is not necessarily able to make the perceived value of customers is also getting
better and customers feel that there are facilities provided were actually less
provide significant impact where facility that makes customers make sacrifices
more but the facilities are not as useful, like a room for the brand Ibis Budget
made less minimalist so that room is quite spacious but had a slightly more
expensive price.
Based on table 8 can be known that the H4 is supported by the estimate value
of the relationship between aesthetics with perceived value is 0.527 with critical
ratio value 3.655. Aesthetics Ibis Hotels in Indonesia that have been good at
making customer perceived value also increases.
Based on table 8 can be known that the H5 supported by the estimate value of
the relationship between perceived value constructs with satisfaction is 0.992 with
critical ratio 8.839. Perceived value owned Ibis Hotels in Indonesia that have been
good at making customer satisfaction is also getting better.
Based on table 8 can be known that H6 is supported with a value estimate of
the relationship between satisfaction with loyalty is 0.726 with critical ratio 4.345.
Satisfaction consumer at Ibis Hotels is good and loyalty that customers have also
good.
Based on table 8 can be known that the H7 are not supported by the estimate
value of the relationship between service quality with the loyalty is -0.183 with
critical ratio -1.168. Customers Ibis Hotels in Indonesia feel that the service
quality that either do not make the customer's own loyalty to the hotel, because
customers feel that the service on the premises with the Ibis Hotels in Indonesia
does have a quality service like that/ could be said not too much different from
13
Based on table 8 can be known that the H8 supported by the estimate value of
the relationship between the play with the loyalty is 0.325 with critical ratio 2.269.
Play possessed the better Ibis Hotels which could make customers have a loyalty
to the hotel.
Based on table 8 can be known that the H9 is not supported by the estimate
value of the relationship between the aesthetics of the loyalty is 0.102 with critical
ratio 0.538. The results of this study refers to the fact that as many as 86.7% of
respondents aged 18-25 years old who is a student, causing customer Ibis hotels
not have loyalty to hotel because customers felt that aesthetics that existed at Ibis
Hotels can still be quite good/ not a hotel that has an outstanding aesthetics. The
results obtained have meant that the aesthetics owned by Ibis Hotels have not been
able to make customers have a loyalty to the hotel.
5. Conclusion
Nine hypotheses, there are four hypotheses are not supported. The results of
this research has been done shows that efficiency, aesthetics directly and
positively affect the perceived value. Results of research conducted also showed
that service quality does not affect the perceived value, play not positive effect on
perceived value. The results of this research also shows that the perceived value
direct and positive effect on satisfaction. This research also shows that satisfaction
direct and positive effect on loyalty. The results of this study also showed that
service quality is not a positive impact on loyalty, play a direct and positive
impact on loyalty, and aesthetics has no effect on loyalty.
6. Limitation and Future Research
Suggestions from the results of research conducted was to brand Ibis hotels in
Indonesia can offer more activities for children, for the brand Ibis Hotels, Ibis
Budget need to make room more quiet and Ibis Styles need make bathroom more
space, Ibis Styles, Ibis Budget needs to train hotel employees to become more
skilled and have sufficient knowledge, Ibis hotels and Ibis Styles can add
activities for children at the hotel, Ibis hotels and Ibis Styles need to add useful
facility for guests, for example by providing a free pick up service from the
14
hotels and Ibis Styles need to make the architecture of the room/ space – room in
the hotel is made more unique and beautiful.
Suggestions for further research is research with complex models can use a
larger number of respondents, respondents who use could be more widespread
because in this study mostly students. Subsequent research could select objects
that are better suited to the questionnaire which is that the received data more
precise.
References
Anandya, Duddy, Suprihadi, 2005, Riset Pemasaran Prospektif dan Terapan, Bayumedia Publishing.
Chan, Benny dan Mackenzie, Muray., 2013, Introduction to Hospitality, Tourism and Hospitality Studies, Vol. 5
Chen, S dan Lin, C., 2015, The impact of customer experience and perceived value on sustainable social relationship in blogs: An empirical study, Technological Forecasting and Social Change, 40 - 50.
Ferdinand, Augusty, 2006, Structural Equation Modelling dalam Penelitian Manajemen, edisi 3, Badan Penerbit Universitas Diponegoro, Semarang.
Gallarza, Martina G., Irene G.S., 2006, value dimensions, perceived value, satisfaction and loyalty: an investigation of university students’ travel behavior, Tourism Management, Vol. 27: 437 – 452.
Gallarza, Martina G., Francisco, A., Irene, G.,2013, the quality – value - satisfaction – loyalty chain: relationships and impacts, Tourism Review, Vol. 68.
Gallarza, Martina G., Francisco, A., Giacomo, D.C., Irene, G.,2015, value dimensions in consumers’ experience: combining the intra and inter-variable approaches in the hospitality sector, International Journal of Hospitality Management, Vol. 47: 140 – 150.
Giovanis, Apostolos., Pinelopi, A., Evangelos, T., 2015, The role of service fairness in the service quality – relationship – customer loyalty chain, Journal of Service Theory and Practice, Vol. 25: 744 – 746.
Hair, Joseph F., William C. Black, Barry J. Babin, Rolph E. Anderson, 2010, Multivariate Data Analysis global edition, Pearson Prentince Hall: USA.
Hooper, Daire, Joseph Coughlan, Michael Mullen, 2008, structural equation modeling: guidelines for determining model fit, Electronic Journal of Business Research Methods, Vol. 6: 53 – 60.
15
Lin, Inggrid Y., 2016, effects of visual servicescape aesthetics comprehension and appreciation on consumer experience, Journal of Service Marketing, Vol. 30: 692 – 712.
Liu, Shaowu., Law, Rob., Rong, Jia., Li, Gang., Hall, John., 2013, analyzing changes in hotel customers’ expectations by trip mode, International Journal of Hospitality Management, Vol. 34: 359 – 371.
Ibarra, Herminia., Jennifer, L. Petriglieri., 2010, identity work and play, Journal of Organizational Change Management, Vol. 23: 10 – 25.
Ryu, Kisang., Hye – Rin, Lee., Woo, Gon, Kim., 2012, The influence of the quality of the physical environment, food, and service on restaurant image, customer perceived value, customer satisfaction, and behavioral intentions, International Journal of Contemporary Hospitality Management, Vol. 24: 200 – 223.
Sánchez-Fernández, Raquel., Iniesta-Bonillo, M. Angeles., 2009, efficiency and quality as economic dimensions of perceived value: Conceptualization, measurement, and effect on satisfaction, Journal of Retailing and Consumer Services, Vol. 16: 425 – 433
Srivastava, Mala dan Kaul, Dimple., 2016, exploring the link between customer experience – loyalty – consumer spend, Journal of Retailing and Consumer Services, Vol. 31: 277 – 286.
Sugiyono, 2006 Metode Penelitian Pendidikan: Pendekatan Kuantitatif, Kualitatif dan R&D, Alfabeta, Bandung.
Verhoef, Peter, C., Franses, P, H., and Hoekstra, J, P., 2002, The Effect of Relational Construct on Customer Referrals and Number of services Purchased from a Multiservice Provider: Does Age of Relationship Matter?, Journal ohe the Academy of Marketing Science, Vol. 30, No. 3, p. 202 – 216.
Walls, R. Andrew, 2013, A cross-sectional examination of hotel consumer experience and relative effects on consumer values, International Journal of Hospitality Management, Vol. 32: 179–192.
Waluyo, M., 2011, Panduan dan Aplikasi Structural Equation Modelling, PT Indeks, Jakarta.
Wijanto, Setyo Hari, 2008. Structural Equation Modeling dengan Lisrel 8.8 Konsep dan Tutorial, Graha Ilmu, Jakarta.
Zikmund, William, G., Babin, Bari, J.2010, Exploring Marketing Research, 10th edition, South – Western Cengage Learning.
Zikmund, William, G., 2011, Business Research Methods, 8th edition, The Dryden Press, Harcourt Brace College Publisher, Fort, Texas.
http://ekbis.sindonews.com/read/1080080/34/bisnis-perhotelan-diyakini- tumbuh-positif-1453721933 diunduh pada tanggal 22 Oktober 2016 http://koran.bisnis.com/read/20161007/449/590289/investasi-hotel-diyakini-naik-
minimal-10 diunduh pada tanggal 22 Oktober 2016
16