Development of a direct method for
local scale post-earthquake
multi-hazards susceptibility assessment
MD. SOHEL RANA
February, 2017
Development of a direct method for
local scale post-earthquake
multi-hazards susceptibility assessment
MD. SOHEL RANA
Enschede, The Netherlands, February, 2017
SUPERVISORS: Dr. Cees J. Van Westen Dr. Olga Christina Mavrouli
THESIS ASSESSMENT BOARD: Professor, Dr. V.G. Jetten (Chair)
Dr. Rens. van Beek, External Examiner, Utrecht University Thesis submitted to the Faculty of Geo-Information Science and Earth Observation of the University of Twente in partial fulfilment of the requirements for the degree of Master of Science in Geo-information Science and Earth Observation.
DISCLAIMER
considerably, due to many reasons, of a political, organizational and technical nature. Due to the widespread occurrence of co-seismic landslides, and the expectation that these may be aggravated or re-activated in future years during the intense monsoon periods, there is a need to evaluate for thousands of sites whether these are suited for reconstruction. In this evaluation multi-hazards, such as rockfall, debris slides, debris flow, and floods were taken into account. The application of indirect knowledge-based, data-driven or physically-based approaches is not suitable due to several reasons. Physically-based models generally require a large number of parameters, for which data is not available. Data-driven, statistical methods, depend on historical information, which is less useful after the occurrence of a major event, such as an earthquake. Besides, they would lead to unacceptable levels of generalization, as the analysis is done based on rather general causal factor maps. The same holds for indirect knowledge-driven methods.
However, location-specific susceptibility analysis of hazardous events is required using a simple method that can be used by many people at the local level. In this research, a direct scientific method was developed where local level technical people can easily and quickly assess the post-earthquake multi hazards susceptibility following a decision tree approach, using a Web-GIS app on a smartphone or tablet. The method assumes that a central organization, such as the Department of Soil Conservation and Watershed Management, generates spatial information beforehand that is used in the direct assessment at a certain location. Pre-earthquake, co-seismic and post-seismic landslide inventories are generated through the interpretation of Google Earth multi-temporal images, using anaglyph methods. Spatial data, such as Digital Elevation Models, land cover maps, and geological maps are used in a GIS to generate Terrain Units in an automated manner. Source areas for rockfall and debris flows are outlined from the factor maps, and historical inventory, and regional scale empirical runout model (Flow-R) are used to define areas that might be affected. This data is then used in the field in an application that guides the user through the decision tree by asking a number of questions, which can be answered by using the existing data, and by direct field observations. The method was applied in a part of Rasuwa district, which was seriously affected by co-seismic and post-earthquake mass movements, leading to the evacuation of a number of hydropower construction project.
this work.
I would like to express my heartfelt thanks to my first supervisor, Dr. Cees J. van Westen for his wisdom guidance and amazing ideas which guide me proceed in right direction to finish this thesis work. His inspiration learning knowledge has transformed me to think critically for solving every steps of this research work. Also, he has been kind enough to patience my thoughts and ideas which actually made the all discussions prolific.
The words cannot describe my thankfulness to my second supervisor, Dr. Olga Christina Mavrouli who always guided and supported me in all aspect. Her invaluable encouragement pushed me forward to complete this work. Even, in my field work, she always guided me and helped me to understand the physics of rock science. Her expert research knowledges facilitated me to test the decision tree in the field for multi-hazards susceptibility assessment which finally guide me to develop the improved one.
Many thanks to Dr. Jianqiang Zhang, Post. Doc Researcher, ITC for supporting me with his expedient thoughts and technical know-how. My sincere thanks to him also because of sharing his research generated landslides inventory and land cover data which has helped me to perform automated terrain analysis for this study. My deep gratitude to drs. Nanette Kingma, lecturer of my domain for her kindness to provide valuable suggestions and inspirations throughout entire MSc period. I would also like to express thanks to Japan Aerospace Exploration Agency (JAXA) for providing the ALOS 5m DEM freely for a part of my study area.
I also like to thank Ms. Susmita Dhakal, lecturer, Tribhuvan university of Nepal for supporting me in field work with her MSc. students and testing my decision tree. I should not forget Mr. Akash Acharya, MSc student, Tribhuvan University, Nepal for helping me to communicate with local people all time in the field work. Being a student of geological engineering, he also effectively tested my decision tree approach in the field.
Many thanks to my scholarship provider “Joint Japan/World Bank Graduate Scholarship” who fully financed my MSc. study. I would also like to thanks my organization (local Government Engineering Department of Bangladesh) for allowing me to study in Netherlands.
I am pleased to thanks my all classmates for the time that we shared together and continuous encouragement and support.
1.1 Background ...1
2.2 Different methods of landslides susceptibility assessment ...6
2.3 Decision tree approach for hazards assessment ... 10
2.4 Terrain unit mapping ... 11
2.5 Multi-hazards assessment using Google Earth ... 12
3. STUDY AREA AND DATA ... 14
4. DATA PROCESSING FOR DECISION TREE ... 21
4.1 Mass movements runout flow path assessment using Flow-R ... 21
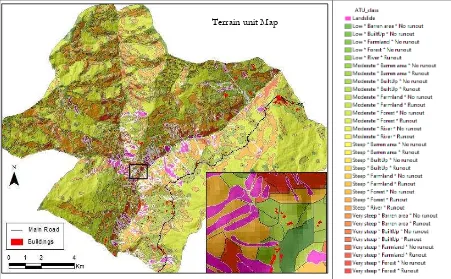
4.2 Terrain unit mapping ... 30
4.3 Homogeneous road segment mapping ... 37
5. DEVELOPMENT OF A DECISION TREE MULTI-HAZARDS SUSCEPTIBILITY ASSESSMENT ... 40
5.1 Initial Decision tree ... 40
5.2 Testing the decision tree in the field ... 41
5.3 Problems in decision tree testing ... 47
5.4 Improvement of the decision tree ... 48
6. APPLICATION OF THE PROPOSED DECISION TREE ... 51
6.1 Case examples results... 51
6.2 Discussions ... 54
7. TOWARDS AN APP FOR DECISION TREE IMPLIMENTATION ... 55
7.1 Structure of Mobile GIS ... 55
7.2 Framework of decision tree mobile Web-GIS app ... 56
7.3 Mock Web-GIS app of multi-hazards susceptibility decision tree ... 59
Figure 1.1: Flowchart of overall research approach of this study... 5
Figure 2.1: Different methods of landslides susceptibility assessment (Corominas et al., 2014)... 7
Figure 2.2: An example of decision tree which was used for evaluating potential landslide activity in Landslide Hazard Assessment for Situational Awareness (LHASA) model in Central America & the Caribbean (Kirschbaum et al., 2015). ... 11
Figure 3.1: Location map of study area ... 14
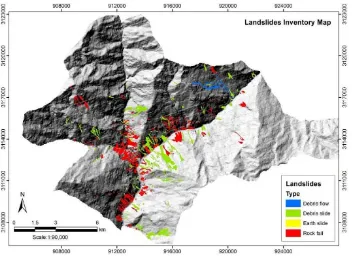
Figure 3.2: Landslides inventory of study area based on landslides type ... 16
Figure 3.3: Landslides inventory of study area based on triggering factors ... 17
Figure 3.4: Elevation map covering Dandagaun and Mailung area, showing with (a) 30m DEM (b) 5m DEM ... 17
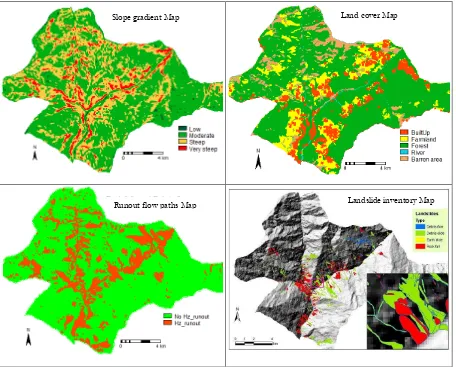
Figure 3.5: Slope map and histogram of study area based on 30m DEM ... 18
Figure 3.6: Comparison of two slope gradient maps, prepared by using 5m and 30m resolution DEM ... 19
Figure 3.7: Correlation of random sampling 1000 point slope gradient values between two slope data ... 19
Figure 3.8: Figure shows (a) land cover with five major classes and (b) bar chart of % area coverage of each land cover class ... 20
Figure 4.1: Illustration of spreading to the neighbour cells (Horton et al., 2013) ... 22
Figure 4.2: Co-seismic rockfall sources of Dandagaun and Mailung area ... 23
Figure 4.3: Potential rockfall runout paths considering different travel angles with varying maximum velocity ... 25
Figure 4.4: Potential (a) rockfall sources considering slope>600 and (b) runout spreading using the 5m DEM ... 26
Figure 4.5: Identification of (a) potential rockfall sources in area with slope gradient >70 degree (b) runout spreading by using 5m DEM ... 26
Figure 4.6: Identification of (a) potential rockfall sources in area with slope gradient >50 degree (b) runout spreading by using 30m DEM ... 27
Figure 4.7: Spreading probability of rock slides runout at Mailung area using (a) 5m ALOS and (b) 30m SRTM DEM ... 27
Figure 4.8: Spreading probability of debris flows at Ramche with alternatives parameters ... 28
Figure 4.9: (a) Debris slides inventory and sources of debris flows (b) Spreading probability of debris flows at Haku area . 29 Figure 4.10: Effect of debris flows susceptibility results in terrain unit at Haku area ... 30
Figure 4.11: Illustrations of different approaches for homogenous units (a) exposure based and (b) terrain based ... 31
Figure 4.12: Manual terrain units mapping of a part of study area ... 32
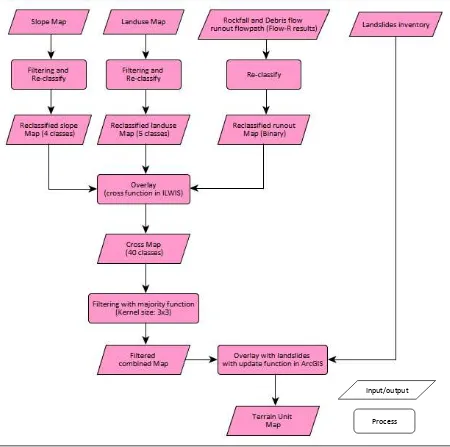
Figure 4.13: Methodological flow chart of automated terrain unit mapping analysis ... 33
Figure 4.14: The factor maps which were used in terrain units mapping analysis ... 34
Figure 4.15: Automated terrain units map of study area ... 35
Figure 4.16: Attribute information of selected automated terrain unit (a) other than landslide unit and (b) landslide unit.. 36
Figure 4.17: Interpretation between automated terrain unit and manually mapped terrain unit ... 37
Figure 4.18: Road condition of some segments of Pasang Lhamu Highway after the 2015 earthquake ... 38
Figure 4.19: Manually mapped of road segments of Pasang Lhamu Highway in the study area ... 39
Figure 5.1: A part of initial decision tree for multi-hazards analysis (Source: Dr. Cees van Westen) ... 41
Figure 5.2: Overall results of testing of decision tree at field work showing units having (a) different types of hazards (b) different level of hazards(DS=Debris slide, DF=Debris flow and RF=Rockfall). ... 42
Figure 5.3: Results of initial decision tree at Mailung village (a) pre-earthquake Google Earth image (b) post-earthquake Google Earth image (c) photo from field observation (d) susceptibility assessment flow ... 43
Figure 5.7: The proposed decision tree of multi-hazard susceptibility assessment ... 50
Figure 6.1: Results of the proposed decision tree for multi-hazard susceptibility assessment at Mailung area ... 51
Figure 6.2: Results of the proposed decision tree for multi-hazard susceptibility assessment in Gogani village ... 52
Figure 6.3: Results of the proposed decision tree for multi-hazard susceptibility assessment at Sano Haku area ... 53
Figure 7.1: Illustrations of the architecture of mobile GIS (ESRI, n.d.) ... 56
Figure 7.2: Thematic diagram of using of Web-GIS app at different districts in Nepal ... 59
Figure 7.3: Proposed architecture of the decision tree approach app of multi-hazards susceptibility assessment (MHSA) ... 60
Figure 7.4: Sample question window with the attribute information by using Info tab in the proposed app ... 60
Figure 7.5: Automated terrain editing option depending on field situation in proposed app ... 61
Table 4.1: Implemented weightings of persistence functions in the assessment of spreading (Horton et al., 2013) ... 22
Table 4.2: Comparison of potential rockfall source areas having slope steepness>600... 26
Table 4.3: List of data which were used in automated terrain mapping analysis ... 32
Table 4.4: Classification of manual homogeneous road segment ... 39
Table 5.1: Conflicting factors in initial decision tree ... 47
Table 5.2: Proposed modification for the conflicting factors of initial decision tree ... 48
Table 7.1: List of GIS data layers which are needed to include in decision tree app ... 57
ANN Artificial Neural Networks
ASCII American Standard Code for Information Interchange
ATU Automated Terrain Unit
CSS Cascading Style Sheets DEM Digital Elevation Model
DISCO District Soil Conservation Officer DMG Department of Mines and Geology
DoLIDAR Department of Local Infrastructure Development and Agricultural Roads DSCWM Department of Soil Conservation and Watershed Management
DTM Digital Terrain Model
GIS Geographic Information System
HDX Humanitarian Data Exchange
HTML Hypertext Markup Language
ICIMOD International Centre for Integrated Mountain Development ILWIS Integrated Land and Water Information System
JAXA Japan Aerospace Exploration Agency
LHASA Landslide Hazard Assessment for Situational Awareness LIDAR Light Detection And Ranging
MCT Main Central Thrust
NSET National Society for Earthquake Technology OSII On Screen Image Interpretation
PASW Predictive Analysis SoftWare PROBSTAB Probabilistic Slope Stability
1.
INTRODUCTION
1.1 Background
Geological processes might cause natural hazards and extreme events with destructive consequences for people and properties. In the mountains, human lives, property, infrastructures and ecosystems are threatened repeatedly by various hazards and dangerous processes. Natural hazards in the mountains include landslides, debris flow, rockfall, floods, rock/snow avalanches as well as others large-scale hazards such as earthquakes, volcanic eruptions. The massive hazards, most of the cases, create secondary hazards or cascading hazards which causes multi-hazards in mountainous area. As example, a strong earthquakes may trigger a number of secondary hazards such as landslides, debris flows, floods, rockfall etc. Consequently, they change the land surface strongly, which causes more geo-hazards especially in mountain areas. Usually, co-seismic landslides in mountain area mobilize a lot of materials and make slope bare. In addition, subsequent extreme rainfall events may cause the intensification of more hazards like debris flows and floods (Yang et al., 2015). The hazards resulting after the earthquake can be dangerous and may last for a number of year after the earthquake. These may severely threaten people as well as destroy infrastructures. Therefore, it is important to consider multi-hazards aspect for analysing natural hazards in mountainous area.
leads to large generalisations which is not desirable. Knowledge based approach could be direct methods such as geomorphological hazard mapping where only geomorphologists can develop hazard map based on different maps and their knowledge.
On the other hand, data-driven methods evaluate statistically the probability of landslide occurrence, having the same combination of factors that produced them in the past. These methods can be bivariate statistical models such as; weights of evidence, frequency ratio (Hussin et al., 2016; Regmi et al., 2014), multivariate statistical models such as; regression analysis (Hong et al., 2016; Bai et al., 2010) and Artificial Neural Networks (Poudyal et al., 2010). Usually, statistical approach is commonly used where landslides inventories and causative factors are applied to build a susceptibility model for prediction of future landslides. In most of the data driven methods, the same combination of factors are considered throughout the entire area as general assumptions. Also, the approach is less useful on the site-specific scale, where local geological and geographic heterogeneities may prevail (Pradhan et al., 2010).
1.2 Problem statement
Recently, a strong earthquake with moment magnitude of 7.8 strikes at Gorkha of Nepal on 25 April, 2015 which causes a number of aftershocks within few days that lead to about 5000 landslides including debris flows (ICIMOD, 2016). These hazards not only killed people but also destroyed a large numbers of infrastructures in urban and rural areas with recorded deaths of 9000 people and the total economic loss was about 7 billion U.S. dollars (Goda et al., 2015).
After the devastating 2015 Gorkha earthquake, reconstruction activities have been delayed considerably, due to many reasons, of a political, organizational and technical nature. Due to the widespread occurrence of co-seismic landslides, and the expectation that these may be aggravated or re-activated in future years during the intense monsoon periods, there is a need to evaluate for thousands of sites whether these are suited for reconstruction. In this evaluation multi-hazards, such as rockfall, debris slides, debris flow, and flash floods are taken into account. The application of indirect knowledge-based, data-driven or physically-based approaches is not suitable due to several reasons. Physically-physically-based models generally require a large number of parameters, for which data is not available. Data-driven, statistical methods, depend on historical information, which is less useful after the occurrence of a major event, such as an earthquake. Besides, they would lead to unacceptable levels of generalization, as the analysis is done based on rather general causal factor maps. The same holds for indirect knowledge-driven methods.
However, location-specific hazards analysis is required using a simple method that can be used by many people at the local level. In this research, a direct scientific method is developed where local level technical people can easily and quickly assess the post-earthquake multi hazards following a decision tree approach, using an app on a smartphone or tablet. The methods assumes that a central organization, such as the Department of Soil Conservation and Watershed Management, generates spatial information beforehand that is used in the direct assessment at a certain location. The method was applied in a part of Rasuwa district, which was seriously affected by co-seismic and post-seismic mass movements, leading to the evacuation of a number of village, and temporary closure of a number of hydropower construction projects.
1.3 Research Objective
The overall objective of this research is to develop a direct method for multi-hazards (e.g. debris slide, debris flow, rockfall, and flood) susceptibility analysis based on a decision tree and with geospatial data that is available on a tablet in the field. The application of this method would be established in such a way so that local technical people can easily and quickly assess the susceptibility at field level for local level reconstruction planning. To achieve this objective, the following specific objectives has been carried out:
(a) Analyse whether such an approach would be best done exposure-based (e.g. starting from the potential location for reconstruction) or terrain based (starting from local homogenous units as a basis for zoning)
(b) Perform terrain analysis for developing unit maps considering exposure elements aspect or homogeneous terrain zone.
(d) Enhance the evaluation possibilities by using available additional information derived from by using empirical model to identify the factors which need to be included in decision tree.
(e) Evaluate the efficiency of the direct method (decision tree approach) for post-earthquake multi-hazards susceptibility assessment and provide recommendation to develop an app for its efficient usage.
1.4 Research Questions
The research questions for this study are as follows:
What would be the level of required knowledge and skills of the people that should carry out such susceptibility evaluation, focusing on technical personal at district level?
Would it be better to analyse the susceptibility based on a specific location for reconstruction planning of a building (point based) or road (line based) or would it be better to make a zonation based on homogeneous units?
Which parameters can be used to generate terrain units for which multi-hazards susceptibility is evaluated? Can these units be generated (semi-)automatically in GIS, or is a substantial input in image interpretation required?
How can empirical model output be considered at decision tree to assess multi-hazards susceptibility?
How the method could be implemented as an app on a tablet or smartphone?
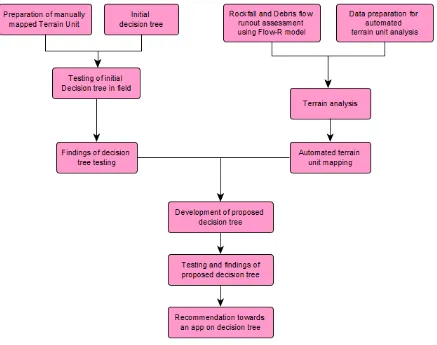
1.5 Research approach
To achieve the mentioned objectives and to answer the research questions, the study is comprised of field work to test the decision tree, various data processing in GIS environment, uses of Flow-R model for rockfall and debris flow runout assessment, automated terrain analysis to prepare unique terrain unit mapping which leads to develop a decision tree for multi-hazards susceptibility assessment. Finally, towards developing an app on proposed decision tree, comprehensive recommendation has been suggested with feasible architecture and features. The overall research approach is shown in Figure 1.1.
1.6 Thesis outline
The research study is structured as following chapters:
Chapter 1: contains a background of multi-hazards and their susceptibility assessment methods, the research problem to be address by this study, the research objects and the related research questions with overall research approach.
Chapter 2: covers a detailed literature reviews on different methods of multi-hazards (landslides hazards) susceptibility assessment including available decision tree approach and terrain unit mapping.
Chapter 3: mostly describes about the study area and data uses for this study
Chapter 5: describes about the decision tree method for multi-hazards susceptibility assessment, testing the initial decision tree in the field, case examples results and their findings and development of the improved decision tree.
Chapter 6: contains the results of improved decision tree and their findings with case examples
Chapter 7: describes about the possibility and framework of development a Web-GIS app of decision tree approach for multi-hazard susceptibility assessment with mock app.
Chapter 8: ends with concluding remarks and scope for future study.
2.
LITERATURE REVIEW
2.1 Post-earthquake multi-hazards
A landslide is the general name given to the movement of earth surface down a slope along a surface of separation by falling, sliding, or flowing. According to Cruden (1991), “a landslide is the movement of mass of rock, earth or debris to down the slope”. Landslides include rock falls, deep failures of soil slopes, and shallow debris flows. They result from the failure of the materials which make up a hill slope and are driven by the force of gravity. They are an integral part of the mountain building process and are one of the main means by which the uplifted mountain mass is transported down to lower valleys and basins.
In mountainous areas with extreme phenomena such earthquakes and very intense rainfalls, earthquake and/or rainfall-induced landslides and floods represent significant hazards, in terms of damage to infrastructure, direct economic cost and lost productivity. Post-earthquake landslides are the most significant secondary hazard of earthquakes in areas of high relief, and can be responsible for high fatality rates. Rockfall, landslide and debris flow might also block the rivers & lake which causes outburst of flooding. For example, 2015 Gorkha earthquake of Nepal causes about 5000 landslides covering in this region which resulting the death of about 9,000 people and loss and damage equivalent to USD 7 billion (ICIMOD, 2016). Additionally, earthquake induced other multi-hazards such as debris flow, avalanches, landslides dams and glacial lake outburst floods in this region after the Gorkha earthquake. While the direct effects of earthquakes are well established and often spectacular, the activity of these secondary phenomena and their long-term economic and societal costs are commonly overlooked.
Hence, in earthquake prone mountainous area, understanding of multi-hazards is very important for hazard and risk assessment. Different natural hazards are formed based on different geophysical environment factors. Also, the impacts of one hazardous event are often exacerbated by interaction with other hazards. Close proximity between events may reduce resilience and recovery, and hence is indicative of greater risk than for events considered in isolation. Therefore, the analysis of multi-hazard risk is not a simple task. Hazard relations and interactions may have unexpected effects and pose threats that are not captured by means of separate single-hazard analysis. In this aspect, hazards matrix or event tree approach is commonly used for hazards analysis. As example, Marzocchi et al. (2012) described an event tree to analyse multi-hazard risk due to triggering effects whilst Kappes et al. (2011) suggested a matrix to identify the possible triggering effect within seven hazards in an Alpine region. On the other hand, considering the trigger factors for each hazard, the relationships between different natural hazards are categorized and hazard interaction are analysed to calculate the probability and magnitude of multiple hazards (Liu et al., 2016). However, multi-hazards and risk assessment is performed primarily for the purpose of providing information and insight to decision making, especially in emergency response, and disaster preparedness and mitigation.
2.2 Different methods of landslides susceptibility assessment
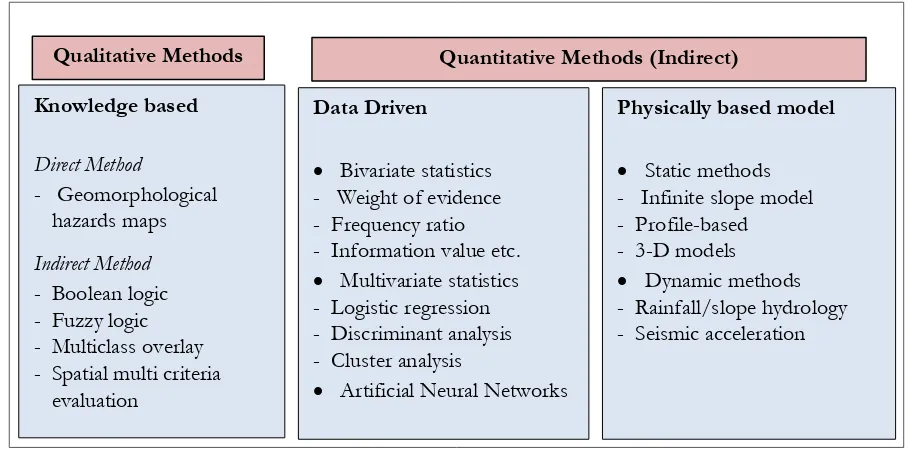
Different methods are available for landslides susceptibility assessment which are broadly categorized into quantitative (data driven method, physically based modelling) and qualitative (knowledge driven method) as shown in Figure 2.1. Each of the methods are described in the following sections.
Figure 2.1: Different methods of landslides susceptibility assessment (Corominas et al., 2014)
2.2.1 Data driven approach
Data driven methods evaluate statistically the probability of landslide occurrence, having the same combination of factors that have triggered in the past. These methods can be bivariate statistical models (e.g. weights of evidence), Multivariate statistical models (e.g. logistic regression, discriminant analysis) and Artificial Neural Networks (ANN). In bivariate data driven method, landslide occurrences in each percentile class for each factor map is calculated separately. Then, weight values are calculated by comparing the landslide occurrences in each percentile class with the overall landslide occurrence in the factor map. In the probabilistic weight of evidence bivariate method, the weight for each landslide predictive factor is calculated, based on the presence or absence of the landslides within the area (Pradhan et al., 2010; Regmi et al., 2010; Kumar et al., 2008). A weighting table is produced for each factor map that includes for each class the positive weight (W+) and negative weight (W−) where it indicates the importance of the presence and absence of each class on the occurrence of landslides respectively. The table also has the contrast value which indicates the measure of the overall importance of a factor map class on the conditions causing landslide occurrence. One of the main advantages of the weight of evidence approach is the capability of combining the subjective choice of the classified factors by the expert with the objective data-driven statistical analysis of the GIS (Hussin et al., 2016). Bivariate statistical methods are a good approach to determine which factors or combination of factors maps are taken role to occur landslides. Some cases, the simulated performance and success rate of weight of evidence methods is very high compare to other approach (Pradhan et al., 2010). However, the approach may be less useful on the site-specific scale, where local geological and geographic heterogeneities may prevail.
On the other hand, in multivariate data driven statistical methods, the combined relationship between a dependent variable (landslide occurrence) and a series of independent variables (landslides controlling
factors) is evaluated (Corominas et al., 2014; Santacana et al., 2003). The presence and absence of landslides for all factors in sample units are calculated. The calculated results are then analysed either by logistic regression, multiple regression or by discriminant analysis. Logistic regression estimates the probability of a certain event occurring by forming a regression relation between a dependent variable and several independent variables. The main advantage is that, an appropriate link function is added to the usual linear regression model to make the variables either continuous or discrete, or any combination of both types (Bai et al., 2010). Considering working in GIS environment, statistical analysis cannot performed quickly and easily in logistic regression model. It requires conversion of the data to ASCII or other format to be used in the statistical package, and later reconversion to incorporate it into the GIS database. Additionally, multiple logistic regression allows one to form a multivariate regression relation between a dependent variable and several independent variables. Using the multivariate logistic regression method, the spatial relationship between landslide-occurrence location and landslide-related factors can be calculated (B Pradhan, 2010b).
Data driven artificial neural network (ANN) is consisted of a set of nodes and a number of interconnected processing elements for landslides hazard assessment. In landslide studies, commonly used input neurons are landslides occurring different factors (i.e. elevation, slope angle, slope aspect, plan curvature, distance to drainage, geology, rainfall etc.) in networks. The neurons imply conditioning factors, and their selection can also influence the accuracy of the landslide susceptibility maps (Dou et al., 2015). As ANN can process input data at varied measurement scales and units, such as continuous, categorical and binary data, it is one of preferable approaches for landslide susceptibility assessment mapping (Zare et al., 2013).
2.2.2 Physically based modelling approach
Physically based landslides susceptibility assessment methods are based on modelling of slope failure process. By using slope stability model, slope failure analysis could be a good approach to develop landslides susceptibility specially in large area (Nicholson & Namekar, 2013). Alternately, by using infinite slope model, physically based models are used mainly for shallow landslides (less than a few meters in depth) analysis at local scale. Different triggering factors such as earthquake or rainfall plays an important role to occur shallow landslides. As example, by using Stability INdex MAPping (SINMAP) physically based model, post-earthquake slope stability can be assessed under different rainfall scenarios (Yang et al., 2015). It shows that an increase rainfall intensity results in a significant increase of unstable area which was carried out based on regional scale. Actually, the model parameters are needed to be calibrated to reflect the significant influence of triggering factors and geological settings. However, comparison between different physically based models is important for other researchers to enhance the quality & reliability of each approach as well as to achieve specific goal of the most appropriate approach could be identified (Zizioli et al., 2013). In this comparison study, four models; SINMAP, SHALSTAB, TRIGRS and SLIP model were used. The comparison showed that SHALSTAB gave the spatial distribution of critical rainfall intensity which determined the potential for shallow landslide initiation and SLIP model had the facility of time-varying stability analysis on territory scale with very low time-consuming computation.
STARWARS+PROBSTAB is couple model, it is only used for soil water model and slope stability model, i.e. only used for landslides initiation model. Rather, all most all cases, physically based models are used to assess only one type of hazard.
Basically, most of the physically based models are dynamic, therefore, they can address the spatial and temporal variation of landslides initiation. Even, with having incomplete landslides inventory, physically based models are also used for slope instability analysis of landslides occurring. The parameters used in these models are most often measureable and are considered state variables that have unique value at a given space and time. Therefore, they have higher predictive capability and are the most suitable for quantitatively assessing the influences of individual parameters of landslides initiation (Corominas et al., 2014). However, physically based models have degree of simplification involvement and it requires a large number of trustworthy data to get convincing model outputs.
2.2.3 Knowledge driven approach
In general, knowledge driven approach is qualitative approach which are carried out by two methods; direct and indirect. The main idea of knowledge based approach for landslides hazard assessment is to realise the relationship between landslides susceptibility and the influencing factors for a certain area directly from field by expert geomorphologists. Then the idea of these relationship is applied to other area for landslides hazard assessment. In direct method, the experts interpret the susceptibility of the terrain directly from field, based on the observed phenomena and the geomorphological & geological setting. Alternately, the landslides susceptibility can be evolved from details geomorphological map in office by the experts. In this direct method, no extensive GIS modelling is used while it is only used as a tool of preparing final map (Corominas et al., 2014). Knowledge based approach can also be used indirectly for landslides hazard assessment by considering different factor maps in GIS. From expert knowledge, different factor maps are considered with different weights to assess landslides hazard map. The most commonly used knowledge based indirect methods are Fuzzy logic, Multiclass overlay, Boolean logic, Spatial Multi Criteria Evaluation (SMCE). In Fuzzy logic knowledge based approach, the expert knowledge of the complicated nonlinear relationships between landslides susceptibility and predisposing factors is extracted under fuzzy logic and represented as a set of fuzzy membership functions. A crisp set range (0, 1) has either membership value of 1 or non- membership value of 0, whereas a fuzzy set has continuous membership in the range (0, 1). The fuzzy logic method allows for more flexible combinations of weighted maps, and could be readily implemented with a GIS modelling language. According to Zhu et al. (2014), it consists of three generic steps: (i) extraction of knowledge on the relationship between landslide susceptibility and predisposing factors from domain experts, (ii) characterization of predisposing factors using GIS techniques, and (iii) prediction of landslides susceptibility under fuzzy logic. The fuzzy set theory has been also used to handle the complex sets of predisposing factors for landslides hazard assessment. It employs the idea of a membership function that expresses the degree of membership with respect to some attribute of interest. It can be used with data from any measurement scale (nominal, ordinal, interval or ratio) and the weighting of evidence is controlled entirely by the expert (B Pradhan, 2010a). Fuzzy membership function weights can be determined subjectively or objectively. Membership function can be assigned quantitatively by using frequency ratio of landslides inventory and landslide factors. Landslide frequency ratio can be calculated by ratio of percent domain of a factor class and percent landslide in that class (Kumar & Anbalagan, 2015; Pradhan, 2010b; Poudyal et al., 2010). Frequency ratio method for determination of fuzzy membership value reduces subjectivity in the model.
landslides susceptibility using a number of factors (Van Westen et al., 2010; Pourghasemi et al., 2014). It is a technique for decision making, where the input consists of a set of indicator maps is considered as the spatial representation of the criteria, which are grouped, standardized and weighted in a criteria tree. The main characteristic of SMCE method is that there are no rules in designing and organizing the criteria tree, in the assignment of the weights, or in the normalization process. Also it is a very flexible tool that can be applied in many cases with very different data sets, even in poor data conditions. It has also advantages to use different measurement scales of indicator maps with standardized from 0 to 1 using different standardization process (Abella & Van Westen, 2007). At the same time, constraint indicator maps can also be used in SMCE for hazard analysis. Though the standardization of factor maps is considered based on experts knowledge, frequency ratio analysis could be a guidance to the actual standardization (Gaprindashvili & Van Westen, 2015).
2.3 Decision tree approach for hazards assessment
Another approach of hazards analysis is decision tree/event tree method which is a technique for finding and describing structural patterns in data as tree structures. A decision tree does not require the relationship between all the input variables and an objective variable in advance. This approach is primarily used to achieve a more concise and vibrant representation of the relationship between an objective variable and explanatory variables (Saito et al., 2009). The decision tree is based on a multistage tree structure which is composed of a root node, a set of internal nodes, and a set of terminal nodes. Each node of the decision-tree structure makes a binary decision that separates either one class or some of the classes from the remaining classes. The processing is carried out by moving forward the tree until the terminal node is reached. However, it is observed that decision tree approach is widely used with complex technical analysis in GIS environment including statistical analysis of different predisposing factors in a tree structure for landslides hazard assessment (Kirschbaum et al., 2015; Poudyal, 2013; Saito et al., 2009). As example, a binary based decision tree by using pixel-by-pixel calculation in GIS environment with three factors; susceptibility index (SI), antecedent rainfall index (ARI) and daily rainfall (RF) is applied for rainfall triggered landslides hazard assessment in regional scale (Kirschbaum et al., 2015). The decision tree was formed as three tier where different threshold values were assigned at different intermediate nodes to step forward to different branches in the tree as shown in Figure 2.2. It is noted that prior to hazard assessment, landslides susceptibility index map is required in this decision tree.
Figure 2.2: An example of decision tree which was used for evaluating potential landslide activity in Landslide Hazard Assessment for Situational Awareness (LHASA) model in Central America & the Caribbean(Kirschbaum et al., 2015).
It has been realized that all those decision tree are framed based on data driven approach which is also an indirect methods for hazards analysis. In addition, all cases it was applied considering one type of hazards at regional or national scale. As the approaches depend on historical information which is less useful after the occurrence of a major event, such as an earthquake. Besides, they would lead to unacceptable levels of generalization, as the analysis is done based on general causal factor maps considering large area. On the hand, at large scale hazard analysis location specific factors play the important role for achieving realistic results. Therefore, in this study, direct knowledge based approach has been applied for location-specific multi-hazards susceptibility analysis by using a decision tree method directly in the field together with pre analysed geospatial data.
2.4 Terrain unit mapping
Landform is a specific geomorphic feature on the surface of the earth, ranging from large-scale features such as plains, plateaus, and mountains to minor features such as hills, valleys, and alluvial fans whereas terrain is the vertical and horizontal dimension of land surface. Land surface segmentation is the process to distinguish segments (elements) that are homogeneous in genetically and also morphologically. Geomorphological theory defines genetically and geometrically pure geomorphic individuals; landforms (such as alluvial fans, aeolian dunes and glacial cirques) and elements (such as cliffs, floors, slip faces and channels). Land surface segmentation is the process to identify these.
of mapping method. Although the availability of high resolution information, field observation and subsequent mapping allows the most direct way to know the land surface and enables a basis for terrain assessment and geomorphological analysis (Otto & Smith, 2013). However, it is very difficult to understand the overall topography and also time consuming to develop geomorphological map for large area. In this aspect, advanced remote sensing data and technology are used to analyse the terrain for developing digital geomorphological units map. Terrain analysis explains the arrangement of the Earth’s surface as well as their classification based on the surface pattern similarities. Based on DEM, different terrain factors such as slope gradient, slope aspect, slope curvature, relative relief etc. are calculated in terrain analysis. In landslides hazard assessment, terrain analysis is most often used specially in mountainous areas as because landslides susceptibility has good correlation with slope gradient and relative relief (Ghimire, 2011; Dai & Lee, 2001). Therefore, considering geomorphological aspect, terrain unit mapping is very important for landslides hazard zoning.
Because of difficulties of accessibility in steep areas, development of detailed geomorphological inventories are time consuming by direct field survey methods. In addition, such approaches are the restricted possibilities to update the map and subjectivity in the selection of landscape boundaries. Therefore, automated or semi-automated terrain unit mapping is promising nowadays. Topographic attributes derived from digital elevation models and automated terrain analyses are increasingly used for characterizing geomorphology of an area (van Asselen & Seijmonsbergen, 2006). A hybrid semi-automated approach may provide acceptable geomorphological unit mapping where Topographic Position Index (TPI) is calculated automatically and, geomorphological units are prepared by on Screen Image Interpretation (OSII) of satellite data then TPI and OSII are combined to develop the final units (Rashid et al., 2016).
The invention of LIDAR (LIght Detection And Ranging) derived high resolution Digital Terrain Model (DTM) offers new potential applications for detailed geomorphological mapping. By using detailed statistical information derived from this high resolution terrain data and object-oriented classification approach are positively used to define geomorphological units as an expert driven semi-automated method (van Asselen & Seijmonsbergen, 2006). In this method, expert knowledge are used to select a training dataset from the analogue geomorphological map. Therefore, by using this semi-automated method, the identified geomorphological units are directly linked to morphometric properties, material, surface processes and the origin of landforms. For analysing high resolution terrain data in object based image analysis, automatically optimized segmentation and classification parameters give higher accuracy and efficiency in automated geomorphological mapping (Anders et al., 2011). Although the Lidar information is not widely available due to high cost, it has opened the area of automated terrain analysis to understand detailed level of landscape which is revolution in geomorphology (Anders & Seijmonsbergen, 2008).
2.5 Multi-hazards assessment using Google Earth
Google Earth is the most popular virtual globe which provides a powerful visualization tool that makes it possible for users to gain a deeper understanding of the geospatial and temporal dimensions of a hazard, before, during, and after it occurs. As a tool of displaying historical natural hazards data google earth enables a broader audience to discover and use the data, with an improved understanding of the geographic and temporal distribution of historical hazard events. It is a good visualization tool because it is easy to use, interactive, and generates high-resolution images as well as 3D view with digital elevation information and profile.
and multi-temporal satellite images, combined with DEMs to obtain 3D-views of the terrain has given opportunity for the identification and mapping of landslide inventory (Sato & Harp, 2009; Lacroix, 2016). Landslides are identified from high resolution satellite images from it with the help of many attributes, including colour, tone, mottling (surface roughness), texture and association. Likewise, extend of flood and debris flow, damaged features due to earthquake can also be identified from high resolution and multi temporal google image.
3.
STUDY AREA AND DATA
3.1 Study Area
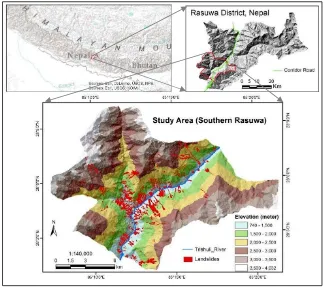
The study area lies in the southern part of Rasuwa district in Nepal and is bounded by the latitude 280 1.04´
to 280 10.14´ N and the longitude 850 7.33´ to 850 21.48´ E which is shown as Figure 3.1. The altitude of the
area ranges from 740 m to as high as 4032 m and the total study area is about 194 km2. The topography of
the area is highly dissected and rough, the north-east part has high relief. The area is predominantly rural with a subsistence farming community. On the other hand, the Langtang National Park which is located at northern part of Rasuwa, is one of the most popular trekking region in Nepal. This park is connected by a road from Kathmandu which is continued to Tibetan border. In addition, Trishuli river, which is originated from Tibetan region, passes through the Rasuwa district.
Figure 3.1: Location map of study area
The district is located in the lesser Himalaya as well as on higher Himalaya. Kuncha group, Nawakot group, Higher Himalayan Crystalline group and Tertiary Granite are the major stratigraphic units of the region as shown in geological map (Figure A1-1 of Annex-1). The map and the geological information were collected from Department of Mines and Geology (DMG), Nepal. The main rock types in the area are Metasandstone, Phyllite, Schist, Quartzite, Gneiss, Granites etc. The Main Central Thrust (MCT) passes North of Goljung where the fault plane dips to north and bends towards east from Syaphrubesi and passes eastward of Dhunche (Dhital, 2015).
affected with these earthquake triggered hazards resulting in devastating damage and killing of people. The southern part of Rasuwa district which is mainly covered four administrative VDCs (Dandagaun, Ramche, Dhunche and Haku) has been selected as study area as because after the 25 April, 2015 earthquake, a huge number of landslides were occurred in this area. Many landslides were also happened along the Trishuli River valley on both sides of the river in Dandagaum and Haku VDC.
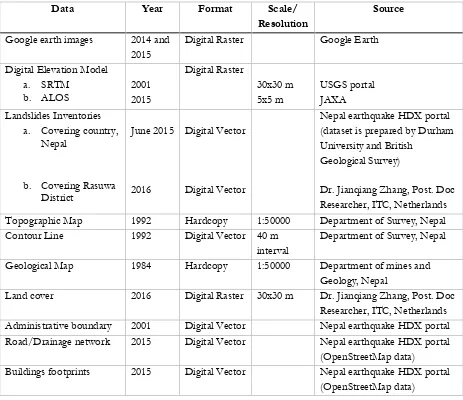
3.2 Data collection
The necessary information and data which were used in this study were collected either by secondary sources or during field work in study area. The satellite images, before and after 2015 earthquake, were collected from google earth to prepare homogeneous unit mapping before going to field work. The other ancillary data such as landslides inventories, DEM, landuse, geology, building, road, drainage data etc. were collected from different sources which is listed in Table 3.1. During the field work, the initial decision tree of multi-hazards susceptibility assessment was tested at different locations and the homogeneous unit maps were modified as well. In addition, the basic information of previous hazards were collected from local people with discussion in the field.
Table 3.1: List of ancillary data for this study
Data Year Format Scale/ Topographic Map 1992 Hardcopy 1:50000 Department of Survey, Nepal
Contour Line 1992 Digital Vector 40 m
interval
Department of Survey, Nepal
Geological Map 1984 Hardcopy 1:50000 Department of mines and
Geology, Nepal
Land cover 2016 Digital Raster 30x30 m Dr. Jianqiang Zhang, Post. Doc Researcher, ITC, Netherlands Administrative boundary 2001 Digital Vector Nepal earthquake HDX portal Road/Drainage network 2015 Digital Vector Nepal earthquake HDX portal
(OpenStreetMap data)
3.3 Landslide Inventory
A landslide inventory is the registered information of past landslides having their characterization and distribution. Generally, characterization is covered with location site name, geographical location, date of occurrence, type, state of activity, triggering factors etc. Some inventory may have additional detail information such as volume, surface dimensions, depth of failure surface, slope geometry, lithological structure and material properties, landuse, casualties, damage etc. The simplest form of landslides inventory is landslides mapping. By using satellite images or aerial photos coupled with field survey to collect historical information on individual landslide events, the inventories are prepared. Nowadays, Google Earth plays very efficient role to map the landslides events with its high resolution and multi temporal information. The landslides inventory which was prepared by one of the post-doc researchers of ITC (Dr. Jianqiang Zhang) for his research purpose was used in this study. This complete inventory was prepared based on mainly using multi temporal Google Earth images coupled with field survey as well as collected the previous inventory from other sources which was also prepared based on satellite images and Google Earth. It has basic characteristic information which includes location, time of occurrence, type (debris slide, debris flow, earth slide, rock fall), triggering factor (co-seismic and rainfall) etc. For this study, these types of information of landslides events are adequate for decision tree based hazards analysis. The Figure 3.2 describes about the landslides inventory of the study area based on different categories of landslides such as debris slides, debris flows, rockfall, and earth slides. It shows that among the different types, rock fall and debris slides are very common in this area. On the other hand, Figure 3.3 shows the landslides based on triggering factors such as rainfall induced and co-seismic landslides. It also shows that a large number landslides were triggered by earthquake in this area. The collected landslides information was covered within 1992 to 2016 time period.
Figure 3.3: Landslides inventory of study area based on triggering factors
3.4 Digital Elevation Model
Land surface topography is considered an important factor in controlling the ground instabilities especially in mountainous areas. Usually, landslides are located in hilly terrain where the slope is steep and elevation is high. Alternatively, gentle topography is free from landslides. Therefore, Digital Elevation Model (DEM) is the main information to analyse different topographic factors such as elevation, slope gradient, slope aspect, slope curvature, relative relief for landslides hazard or susceptibility assessment. In this study, freely available SRTM 30x30m DEM was used for entire study area while ALOS 5x5m high resolution DEM was also used for a small area which is covered Dandagaun and Mailung area of Rasuwa district as shown in Figure 3.4. The ALOS DEM was received from JAXA (2016) as a sample DEM of 25 km2 area only.
Figure 3.4: Elevation map covering Dandagaun and Mailung area, showing with (a) 30m DEM (b) 5m DEM (b)
Slope gradient is considered as one of the most important triggering factors for landslides. The shear stress in soil, rock blocks or in other unconsolidated material increases as the slope gradient rises, which makes the slope prone to failure. In this study, slope gradient was generated from 30m DEM which ranges from 00 to 760. For the decision tree based susceptibility assessment, zoning units were considered primarily based
on slope factor in present study. Because of high elevation and high relative relief as well as landslides prone area, the slope angles of this study area were classified into following four classes; <150 (Low), 150-350
(Moderate), 350-500 (Steep), and >500 (very steep or cliff). It has been seen that most slopes are in the range
of 200-450 (Figure 3.5b) whereas most of the steep slopes and cliffs are spatially distributed at different
altitudes and mostly near to valley area as shown in Figure 3.5a. The occurrence of landslides is related to steep slopes, as indicated by the comparison of Figure 3.2 and Figure 3.5.
Figure 3.5: Slope map and histogram of study area based on 30m DEM
Based on the two different DEMs information (5m and 30m), two slope gradient maps were prepared covering Mailung and Dandagaun area (Figure 3.6). It shows that high resolution one has the more cliff area (>50 degrees) compare to low resolution slope gradient map. From the plot of histogram of two slope maps, it has been shown that, although the distribution of slope gradient has the similar pattern, the total number of pixels of each slope class has much more in finer resolution slope map compare to coarse one. Besides, the correlation of slope values between two slope maps is too low as showed in Figure 3.7. This indicates that using these two different resolution slope data in same analysis has possibility to reflect different pattern of results.
3.5 Land cover Map
Land cover is an important factor for landslide susceptibility assessment as different land cover class has different impact on the occurrence of the hazards. As example cultivated land affects the slope stability owing to saturation of covered soil whereas forest makes soil more stable and also regulates continuous water flow (Karsli et al., 2009). To include the effect of land cover it is important to prepare homogeneous unit or terrain unit mapping for different land cover classes. In this study, land cover data which was prepared by one of my colleagues (post-doc researcher), was used for terrain unit mapping. It was prepared from downloaded post-earthquake (November 2015) high resolution google images by onscreen digitization and subsequently corrected during field work. The data contains eight classes of land cover information: forest, bush land, grass land, farmland, barren area, river and urban area.
Figure 3.6: Comparison of two slope gradient maps, prepared by using 5m and 30m resolution DEM
Figure 3.7: Correlation of random sampling 1000 point slope gradient values between two slope data
y = 0.3907x + 19.986 R² = 0.2665
0.00 10.00 20.00 30.00 40.00 50.00 60.00 70.00 80.00
0.00 10.00 20.00 30.00 40.00 50.00 60.00 70.00 80.00 90.00
Slop
e
gra
d
ie
n
t_
30m
Slope gradient_5m
However, the urban area was not perfectly digitized from the Google images. Therefore, the building footprints of OpenStreet map was included in that land cover map to modify the urban area as built-up area. In this case, 100m buffer area of buildings footprints was considered to make the cluster of built-up area as because the existing buildings were not too much far from each other. In addition, bush land and grass land were combined with farmland as a single class to reduce the number of class which was finally used in automated terrain unit mapping analysis. The prepared land cover map has been shown as Figure 3.8(a) which was finally resampled into 30x30m pixel size. The figure shows that being mountainous region, maximum area is covered with forest (more than 60% area) (Figure 3.8b) whereas most of the built-up areas are located together with agricultural land. Although, the built-up area was over estimated in some area such as close to river, for using this in decision tree approach susceptibility assessment it was practical. As because, in decision tree approach homogeneous unit of built-up area was primarily considered for multi-hazards susceptibility assessment.
Figure 3.8: Figure shows (a) land cover with five major classes and (b) bar chart of % area coverage of each land cover class
4.
DATA PROCESSING FOR DECISION TREE
The decision tree approach is a direct method which will be used by users in the field for multi-hazards susceptibility assessment. It has been formed with different potential factors such as hazard inventories, topography, land cover, evidence of previous events, susceptibility of hazards information, drainage etc. in a systematic way. Among those factors or information some are required before going to field to assess the hazards while the others will be identified from field directly by visualizing physical condition. The idea is that the approach is used for multi-hazards susceptibility assessment based on homogeneous or terrain zoning unit in the field. Therefore, the preparation of homogeneous or terrain zoning unit is important to apply that approach. Apart from slope steepness and landuse land cover information, trajectories of runout flow path of different hazards were considered in decision tree approach. The preparation of these factor data are described in following sections of this chapter.
4.1 Mass movements runout flow path assessment using Flow-R
In mountainous areas, debris slides, debris flows and rockfall/rock slide are very common hazardous events which cause huge damage in terms of life and properties. The development of runout flow path mapping of these hazardous events is important to analyse susceptibility for its zoning and to assess the related risk. The destruction potential of these hazards depends on the soil/rock mass runout distance and the extent of the affected area. However, due to the complex nature of the mass propagation and the uncertainty in modelling parameters limit the use of process based models for quick runout assessment. Besides, most of the process based landslides runout models has the inability to compute the dislocation with a large amount of individual initiation areas considering medium or large scale (Quan Luna et al., 2016). On the other hand, empirical runout models can provide quick and simple approximation of runout zones of mass movements which is mostly based on relationships between topographical factors and the length of runout zones (Dorren, 2003). Therefore, a simplified approach which requires a minimum number of data would be a preferable approach. A distributed empirical model, named as Flow-R (Flow path assessment of gravitational hazards at Regional scale) was used in this study especially for debris flows and rockfall runout analysis. Unlike the other models, although, it is not capable to estimate the runout volume of debris, the model can estimate the maximum runout distance and the probable trajectories of affected areas not only regionally but also locally. In addition, this single model has the capability to estimate different types of mass movements (such as rockfall, debris flow, snow avalanches) runout assessment (Horton et al., 2013). In this study, the runout flow paths which include information on the potentially affected areas by different mass movements, are important input factors in decision tree based direct multi-hazards susceptibility assessment.
4.1.1 Model Concepts
The model Flow-R which is spatially distributed empirical model compiled with Matlab was developed at the University of Lausanne, Switzerland and was firstly applied at Canton de Vaud in Switzerland for debris flows susceptibility analysis (Horton et al., 2008). The main input data in Flow-R is DEM. Based on the input, the model has two distinct steps; (i) identification of source area from DEM or user defined source data and (ii) propagation of spreading using probabilistic and energy approach (Horton et al., 2011). In this model, volume or mass of the events are not taken into account because of the excessive difficulties in assessing volume at a regional scale and also for simplifying the model (Horton et al., 2013).
algorithms, flow direction is assigned from one cell to its eight neighbour cells. The conditions in algorithms are defined in such a way that there is always found at least one cell to run the flow. Several flow direction algorithms are included in the model where ‘The Holmgren (1994)’ algorithm is very relevant considering flows. The algorithm adds a parameter to the multiple flow direction to control the divergence of flow by allowing an exponential factor (x) as shown in Eq. 1 (Horton et al., 2013).
………..(1)
In this equation, the parameter i, j are the flow directions, pifdissusceptibility proportion in direction i, tanβi is slope gradient between the central cell and the cell in direction i, and xis variable exponent. For x=1 the spreading is similar to multiple flow direction and when it increases, the flow is convergence and it is reduced to single flow direction when x→ ∞.
A persistence function (Eq. 2) is also used in Flow-R model for taking into account the flow inertia (Horton et al., 2013). It assigns weights to the flow direction with respect to previous direction as shown in Figure 4.1. There are three persistence options inbuilt in the model which are (i) Proportional (ii) Cosine and (iii) Gamma (2000) as shown in Table 4.1.
………...….(2)
Here, pipis the flow proportion in the direction i according to the persistence, α(i)is the angle between the previous direction and the direction from central cell to cell i and wα is the weight for the corresponding change in direction.
Table 4.1: Implemented weightings of persistence functions in the assessment of spreading (Horton et al., 2013)
Figure 4.1: Illustration of spreading to the neighbour cells (Horton et al., 2013)
To assess the runout distance in Flow-R, energy balance algorithms are used which is based on friction law. As the source mass is unknown, the energy balance is unitary as shown in Eq. 3 (Horton et al., 2013). As the processing takes place in each cell, they control the distance reached by the flow and in addition reduce the divergence.
Ei
kin = E0kin+ ΔEipot–Eif………..……(3)
Where Eikin is the kinetic energy at the cell of direction i, E0
kinis the kinetic energy at central cell, ΔEipot is
the change in potential energy to the cell in direction i, Eif is the energy lost in friction to the cell in direction
i. Several algorithms are used to calculate the friction loss among which simplified friction-limited model (SFLM) is frequently used. In SFLM, the constant friction loss is considered based on minimum travel angle
w0 w45 w90 w135 w180
Proportional 1 0.8 0.4 0 0
Cosine 1 0.707 0 0 0
or reach angle which is the angle of the line connecting the source area to the most distant point reached by the flow. The friction loss is assessed based on following Eq. 4.
Ef
i = gΔx tanɸ ………..(4)
Where Efi is the energy lost by friction from central cell to cell in direction i, Δx is the increment of horizontal
displacement, tanɸ is the gradient of energy line where ɸ is the travel angle and g is the acceleration due to gravity.
Due to the unrealistic energy amounts reached during the propagation, the SFLM approach may result in impracticable runout distance in steep slope area. Hence, a maximum velocity limit may be considered to ensure not to exceed realistic velocities which will keep the energy within reasonable values (Horton et al., 2008).
4.1.2 Calibration of the model
In this study, Flow-R was used for rockfall and debris flow runout assessment. Initially, the parameters related to the spreading were calibrated to apply the model for this study. ‘The Holmgren (1994) modified’ flow direction algorithm was used for flow spreading analysis. In this algorithm, the height of central cell (dh) is increased as because it allows smoothing of DEM roughness and can produce more consisting spreading, particularly for high resolution DEM (Horton et al., 2013). In this study, dh value was taken 1.0 meter and the exponent (x) was taken 4 as suggested by Horton et al., (2013). The 2015 co-seismic rockfalls were used as known sources and 5m ALOS DEM was used for spreading the flow, in the area of Mailung. As the model does not consider the rockfall volume, only the arc part of each rockfall sources were digitized as polyline (Figure 4.2). As shown in figure, other type of landslides were also existed in this areas which were not as the sources of rockfall and also those were not triggered by 2015 earthquake.
These polyline sources were converted to raster format and then finally converted to ASCII format as the suitable GIS environment in Flow-R is ASCII format. The DEM data was also converted to this format and runout spreading was performed based on this. Basically, two spreading parameters were calibrated; (i) travel angle (ɸ) and (ii) maximum velocity (Vmax) to limit the energy. By using the known sources rockfall
runout assessment, model was run in the area of Mailung considering different travel angle (300, 400 and
500) and maximum velocity (15 m/s, 30m/s, 40m/s and 50m/s) which has been shown in Figure 4.3. It
shows, the rockfall runout potential trajectories where different colours indicate the different range of probability of each runout path. In addition, the observed co-seismic rockfall was overlaid on potential runout paths. From the different alternatives, it has been seen that the potential runout flow paths with
ɸ=400andV
max=30m/s are quite similar with observed rockfall compared to other alternatives. Therefore,
these calibrated parameters were used to rockfall runout assessment for the entire study area.
4.1.3 Rockfall runout analysis
After the calibration of the parameters of Flow-R, a rockfall runout flow paths assessment was performed for the study area. As the DEM and the location of the rockfall sources are the most important input data for runout assessment, initially the area which is covered by high resolution (5m ALOS) DEM was taken into account for rockfall runout assessment. To do that rockfall sources were identified as the area which have higher than 600 slope gradient as because the study area is very steep while considering 5m DEM. GIS
analysis was performed in ArcGIS to calculate >600 slope area which is shown as Figure 4.4a. It shows that
a lot of areas are existed with rock cliff which could be the sources of probable rockfall. Using these area as sources, rockfall runout flow paths were assessed in Flow-R. The calibrated parameter of travel angle (400)
and maximum velocity (30m/s) as well as Horton et al., (2013) suggested ‘dh’ value of modified Holmgren (1994) flow direction algorithm which was set as 1.0m and the exponent of spreading as 4 were considered to analyse the rockfall runout flow paths (Figure 4.4b). The model results illustrate that the potential rockfall runout paths have been covered almost all the area because of too many rockfall sources.
In this regard, in next step the area which has greater than 700 of slope steepness was considered as potential
rockfall sources (Figure 4.5a). It is realized that the most areas are not located at higher altitudes, instead they are located just above the valley. The rockfall runout spreading assessment was then performed taking the same parameters as it was considered for the >600 slope steepness sources areas. The runout results
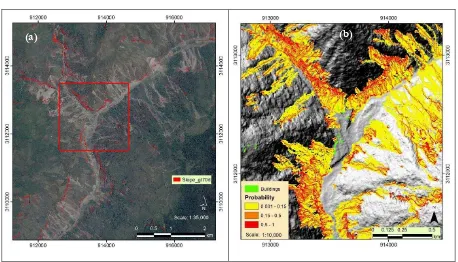
show the spreading areas of all sources which are combined by keeping the maximum probability values (Figure 4.5b). This illustrates, the total area exposed to rockfall spreading, with an associated probability which provides a measure of the runout potential. The area with red colour has a higher probability (50%-100%) to be reached by a rockfall than orange one (15%-50%) whereas the probability of yellow areas is <15%. The green colour represents the existing buildings/houses location. We can see some buildings are located within the rockfall runout paths specially those which are located at valley areas.
On the other hand, considering the entire study area 30m DEM was used for rockfall runout assessment. It has been seen that, if the source areas are considered as slope steepness>600, it has very less area comparing
with 5m DEM (Table 4.2). Notably this comparison was made at Mailung area where both the dataset were available. Therefore, the potential rockfall source area was identified as the area having >500 (as classified
Figure 4.3: Potential rockfall runout paths considering different travel angles with varying maximum velocity
ɸ =300
Vmax=40m/s
ɸ =400
Vmax=40m/s
ɸ =500
Vmax=40m/s
ɸ =400
Vmax=50m/s
ɸ =400
Vmax=15m/s
ɸ =400
Figure 4.4: Potential (a) rockfall sources considering slope>600 and (b) runout spreading using the 5m DEM
Figure 4.5: Identification of (a) potential rockfall sources in area with slope gradient >70 degree (b) runout spreading by using 5m DEM
Table 4.2: Comparison of potential rockfall source areas having slope steepness>600
DEM Sources area having slope angle>60 degree
No. of Pixel Area(m2) Comparison
5m resolution 115911 2897775 Coarse one
contains only
23% source area of high resolution one
30m resolution 749 674100
(a) (b)