FACTORS AFFECTING THE CAPITAL STRUCTURE
AND EFFECT ON ITS PERFORMANCE
Samuel Pramana Dwidjaja
Fakultas Bisnis dan Ekonomika
[email protected]
Werner R. Murhadi
Fakultas Bisnis dan Ekonomika
[email protected]
Mudji Utami
Fakultas Bisnis dan Ekonomika
[email protected]
Abstrak - Penelitian ini bertujuan untuk mengidentifikasi faktor-faktor yang
mempengaruhi struktur modal dan pengaruhnya terhadap kinerja perusahaan.
Variabel yang digunakan yaitu
debt ratio, return on asset, tangibility, size,
growth,
dan
liquidity
. Penelitian ini menggunakan pendekatan kuantitatif dengan
model analisis
two stages least square
(TSLS). Penelitian ini menggunakan target
penelitian seluruh sektor perusahaan yang terdaftar di Bursa Efek Indonesia
periode 2011-2015, kecuali sektor keuangan. Jumlah observasi dalam penelitian
ini adalah 1370 observasi. Hasil penelitian menunjukkan bahwa variabel
tangibility
memiliki pengaruh yang positif dan signifikan terhadap struktur modal.
Sedangkan variabel
size, growth
, dan
liquidity
memiliki pengaruh yang negatif
dan signifikan. Pada model kedua, diperoleh hasil bahwa variabel
tangibility
memiliki pengaruh yang negatif dan signifikan terhadap kinerja perusahaan,
sedangkan
size
dan
growth
memiliki pengaruh yang positif dan signifikan
terhadap kinerja perusahaan. Variabel
debt ratio
memiliki pengaruh yang tidak
signifikan terhadap kinerja perusahaan.
Kata kunci: struktur modal, kinerja perusahaan, debt ratio, return on asset
,
tangibility, size, growth, liquidity
.
This study was 1370 observations. The result showed that tangibility has a
positive and significant impact on capital structure. While size, growth, and
liquidity had a negative and significant impact on capital structure. For the
second model, tangibility has a negative and significant impact on firm
performance, while size and growth have a positive and significant impact on firm
performance. Debt ratio has no impact on firm performance.
Keywords:
capital structure, firm performance, debt ratio, return on asset,
tangibility, size, growth, liquidity.
Introduction
The capital structure is an important discussion in a company or organization, indicating that if anything happens to manage the capital structure that will have consequences for the company. Techniques in managing its capital structure is not easy because it relates to the use of selection of debt and equity in the company. A financial manager should be able to find the proportion of debt and capital in accordance with the business run (Sheikh & Wang, 2011; Vatavu, 2015; Bandyopadhyay & Barua, 2016). Therefore, the discussion regarding capital structure, particularly the use of debt, always attract the interest and attention of researchers. The development of this research itself has been studied more than the past decade since Modigliani and Miller (1958) developed a theory of capital structure of the modern era (Murhadi 2011; Vatavu, 2012).
Vatavu (2012) study the factors affecting capital structure and concluded that tangibility have a significant negative effect, while the size has a significant positive effect on the capital structure. Sheikh & Wang (2011) also conducted a study of capital structure and concluded that in addition to tangibility and size, there are other factors such as growth and liquidity which have a negative effect on the capital structure. Murhadi (2011) concluded the same in her research on capital structure that tangibility and size have a positive influence, while the growth has a negative effect. This is also supported by Bandyopadhyay & Barua (2016), which examined the factors affecting capital structure and concluded that tangibility have a positive influence, while the size and liquidity had a negative effect.
Vatavu (2015) study the effect of capital structure to the company's performance and concluded that long-term debt ratio has a positive influence on the company's performance, while the debt ratio and tangibility as control variables have a negative effect. Abor (2005) also conducted research on the impact of capital structure to the company's performance and concluded that long-term debt ratio had a negative effect, while the debt ratio has a positive influence. The control variables such as size and growth have a positive influence on business performance. Sheikh & Wang (2013) concluded that the influence of capital structure to the company's performance is negative, while variable tangibility and the size and growth of each negative and positive. Dawar (2014) also concluded that the effects of capital structure to the company's performance is negative, while the tangibility, size, and growth has a positive influence. The research will focus on companies listed in Indonesia Stock Exchange 2011-2015 period. Murhadi (2011) says that Indonesia is one of the founding members of ASEAN and is the largest country in ASEAN. It is also supported by a shift in global economic power from the West to Asia, since the economic crisis of 2008.
Based on a compilation of research from researchers before, then the next will be presented discussion of factors affecting capital structure, and the influence of capital structure to the company's performance.
Effect of tangibility factor Against Capital Structure
Murhadi (2011) states that a company has more intangible assets will have a better position when performing loans. The real assets can be used as collateral for loans granted by the creditor. If the company had failed to pay the guarantee in the form of these assets can be seized to pay off obligations to pay, and the company was saved from bankruptcy. It is also supported by research Bandyopadhyay & Barua (2016). But with the agency problems that occur could cause the influence of intangible assets on the capital structure becomes negative. This is due to the behavior of managers to exceed the optimal limit of perquisite or benefit received (Sheikh & Wang, 2011). Thus, a hypothesis that can be developed are:
H1 :
Tangibility has positive effect on the capital structureEffect of company size Against Capital Structure
Research conducted by Vatavu, S (2012) the size of the company has a positive influence to the debt that is consistent with the theory of trade-offs. This is because large companies do not face the risk of bankruptcy is great, and easy to get external funding (from banks). It is also stated in a study conducted by Sheikh & Wang (2011) that large firms have lower agency costs for their ease of access to obtain loans, so the supervision of the debtor's management is more stringent. However, based on the pecking order theory, a large company that has a small overall debt, especially long-term debt. This is because companies under conditions of strong funding so as to address the refinancing risk as well (Bandyopadhyay & Barua, 2016). Thus, a hypothesis that can be developed are:
H2 :
Size has positive effect on the capital structureEffect of Growth Against Capital Structure
Based on the pecking-order theory, influence growth and debt is positive. The company will use debt when funding is insufficient internal financing needed by the company but the use of debt occurs gradually from most secure to risk. According to Chen (2011) Businesses are growing, requiring a large fund with the aim of developing new businesses that run them.When at the beginning of the business growth of the company is certainly the proportion of expenditure is greater than the capital of the company. However Murhadi (2011) says that there are fluctuations in income in the future when the company is in a period of high growth that tends to reduce the debt. Thus, a hypothesis that can be developed are:
H3 :
Growth has a negative effect on the capital structureEffect of Liquidity Against Capital Structure
Based on the trade-off theory, companies that have high liquidity ratios tend to have high debt anyway because the company has the ability to pay off high bond obligations (Mazur, 2007). Therefore, there is a positive influence between the liquidity of debt in the capital structure of the company. But if it is based on the pecking order theory, then there is a negative influence. The use of external funds is the last option, if internal funds owned by the company were insufficient. During internal funds owned by the company meet the needs of the company, management would not require funding from outside the company. These results are consistent with the findings Bandyopadhyay & Barua (2016) and Sheikh & Wang (2011). Thus, a hypothesis that can be developed are:
Effect of Capital Structure Against Corporate Performance
According Abor (2005) long-term debt have high costs so that the company's performance becomes better, while short-term debt has a low cost that can make the performance better. Abor (2005) proved that when companies use short-term debt Long-term debt dominant than it is able to make them more efficient. Thus, the company can earn a higher profit. Another study conducted by Hadlock and James (2002), Petersen and Rajan (1994), as well as Roden & Lewellen (1995) in Abor (2005) also says that companies that use debt more will earn a bigger profit. In theory, the agency theory states that companies that use debt able to overcome or reduce their agency costs so as to make the company's performance can be more efficient, which in turn could increase profits. In a study conducted by Sheikh & Wang (2013) found that the behavior of companies in Pakistan in minimizing agency costs too much to actually reduce the performance of the company. This is because the use of debt is so high that according to the theory of trade-offs, the company has passed the point of maximum in order to improve company performance. Therefore, the effect of the debt and the company's performance is negative. Thus, a hypothesis that can be developed are:
H5 :
Debt has a positive effect on company performanceInfluence Tangibility Against Corporate Performance
Dawar (2014) stated that the influence of intangible assets with the company's performance is positive. Companies that have large tangible assets collateral assets have greater oversight of the intangible asset so easy to do. In addition, it can reduce the conflicts that may arise between shareholders and creditors. Contrast with Dawar, Sheikh & Wang (2013) states that the effect of tangible assets by the company's performance is negative. The value of intangible assets that are not operated effectively by the company so that the ability to make a profit to be weak, has become a burden for the company. It is also supported by a study conducted by Vatavu (2015). Thus, a hypothesis that can be developed are:
H6 :
Tangibility negatively affect the performance of the companySize variables influence the Company's Performance Against
Based on the theory of trade off, a large company that has the ability to overcome the risk of bankruptcy and failure to pay so that the company's performance can be maintained. In addition, companies can maximize profits tax to increase company profit. In addition, large companies are able to apply economies of scale better and have considerable influence in the market. This makes the company able to operate effectively so that the company's performance increases. Research conducted by Dawar (2014), Sheikh & Wang (2013), Abor (2005) also states that the size has a positive influence on the company's performance. However, Abor (2007) states that the effect of the size of the company and the company's performance was negatively on the company in Ghana and South Africa. The use of tangible assets in very large numbers is not able to be carried out effectively so that it becomes a burden for the company. Thus, a hypothesis that can be developed are:
H7 :
Size has a positive effect on company performanceEffect of Growth Against Corporate Performance
DR
LTDR
ROA
TANG
SIZE
GROWTH
LIQ
Mean
0,57155
0,20670
0,04378
0,52321 12,33173
0,17199 2,57901
Median
0,48354
0,14031
0,03951
0,52894 12,34581
0,11027 1,44492
Maks.
11,8439
2,99104
0,65720
0,97911 14,38994
9,34585 158,139
Min.
0,00387
0,00000
-1,72917
0,00085 9,705949
-0,99442 0,00444
Std. Dev.
0,70114
0,27573
0,12353
0,23199 0,756419
0,58212 6,38733
Obs.
1370
1370
1370
1370
1370
1370
1370
by internal funds. This opportunity can be maximized by the company to focus on improving the performance of the company effective. Besides, also, there is a tax benefit on payment of interest on the loan. Research conducted by Sheikh & Wang (2013) and Abor (2005) also states that growth has a positive influence on the company's performance. However, according to Abor (2007) found that the effect of growth and performance of the company is negative. This occurred at the companies in Ghana and South Africa, where a large growth makes the company's performance declined. The Company does not dare take a great opportunity to use loans for business development. Thus, a hypothesis that can be developed are:
H8 :
Growth has a positive effect on company performanceResearch Method
This study examined the companies listed in the Indonesia Stock Exchange (BEI) in the period from 2011 to 2015 as many as 274 companies as research objects. The research object has been through the selection process with a set of financial statements published for 5 years, and did not experience any delisting during the study period. In the first model of the equation there is a debt ratio (DR) as the dependent variable; tangibility (TANG), size (SIZE), growth (GROWTH), liquidity (LIQ) as independent variables. In the second model of the equation there is return on assets (ROA) as the dependent variable; debt ratio (DR) as the independent variable; tangibility (TANG), size (SIZE), growth (GROWTH) as control variables. The research model using Two Stage Least Square (TSLS). The following equation model of this research:
DR =
α
+
β1.T
ANG +
β
2.SIZE +
β3.GRO
W
TH + β4
.LIQ +
ε
(1)
ROA =
α
+
β1.DR
+
β2.TA
NG +
β3.
SIZE +
β4.
GROWTH +
ε
(2)
Explanation:
α,β =
coefficient parameter
ε =
residual
DR = debt ratio
TANG = fixed asset divided by total asset
SIZE = logarithm total asset
GROWTH = the difference between the current sales and then divided by sales ago
LIQ = current assets divided by current liabilities
Results and Discussion
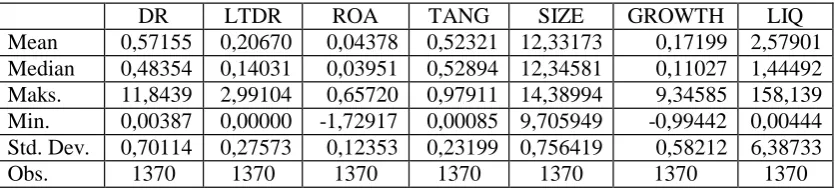
Based on the criteria, there are as many as 274 companies that meet the criteria of the study sample. The following descriptive statistics of the sample are shown in the table below.
From Table 2 shows that the variable DR (debt ratio) has a maximum value of 11.84393, produced by the company with the code RIMO 2013 and a minimum value of 0.003865, which is produced by the company with the code IIKP 2011. Variable LTDR ( long-term debt ratio) has a maximum value of 2.991035, which is produced by the company with the SAFE code of 2014 and a minimum value of 0.000000, which is produced by the company with the code TBMS 2013.
ROA (return on asset) has a maximum value of 0.657201, which produced by company with MLBI code in 2013 and a minimum value of -1.729167, produced by the company with the code RIMO 2012. Variable TANG (tangibility) has a maximum value amounted to 0.979111, which is produced by the company with the SAFE code of 2014 and a minimum value of 0.000852, which is produced by the company with AIMS code 2013. the variable size (size) has a maximum value of 14.38994, produced by the company with ASII code 2015 and a minimum value of 9.705949, which is produced by the company with the code RIMO 2013. variable growth (growth) has a maximum value of 9.345849, which is produced by the company with the code TBIG 2015 and a minimum value of -0 , 994 422, generated by the company with the code AIMS 2015. the latter, variable LIQ (liquidity) has a maximum value of 158.1390, which is produced by the company with TRIL code in 2013 and a minimum value of 0.004441, produced by the company the SAFE code 2014. In this study also performed classical assumption to the model equations used. Especially for autocorrelation test, this study was not done autocorrelation test. This is supported by Gujarati (2012) says that the autocorrelation is used in the form of time series data. This is because the time series data allows the inter-correlations, particularly in the short term, since the data follow a specific time sequence. While the data used shaped panels.
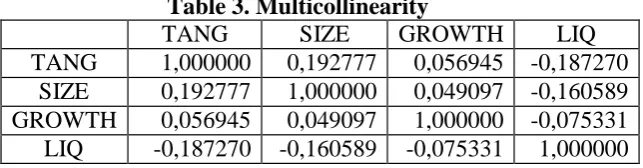
In multicollinearity test, correlation matrix results in Table 3 indicate that the independent variables does not exceed the maximum limit of 0.80 as the correlation
Table 3. Multicollinearity
TANG
SIZE
GROWTH
LIQ
TANG
1,000000
0,192777
0,056945 -0,187270
SIZE
0,192777
1,000000
0,049097 -0,160589
GROWTH
0,056945
0,049097
1,000000 -0,075331
LIQ
-0,187270
-0,160589
-0,075331
1,000000
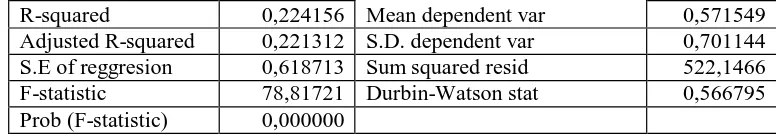
Heteroscedasticity test is still being done in this study using a test White. Nevertheless, Ghozali (2009: 125) says that the heteroscedasticity test performed on the data-shaped cross section. While in this study using the data in the form panels. Prior estimates the equation model, researchers ascertain first whether the model equations used TSLS suitable method. Furthermore, to test the simultaneity using Haussman test is shown in Table 4. The results show that the model equation is a simultaneous equation model with significant residual value (0,000).
Table 4. Simultaneous Test
Variable
Coefficient
Std. Error
t-
StatisticSig.
C
3,115450
0,278010
11,20626
0,0000
TANG
0,286212
0,074489
3,842317
0,0001
SIZE
-0,213440
0,022730
-9,390096
0,0000
GROWTH
-0,097040
0,028849
-3,363697
0,0008
LIQ
-0,017399
0,002693
-6,461308
0,0000
R-squared
0,224156 Mean dependent var
0,571549
Adjusted R-squared
0,221312 S.D. dependent var
0,701144
S.E of reggresion
0,618713 Sum squared resid
522,1466
F-statistic
78,81721 Durbin-Watson stat
0,566795
Prob (F-statistic)
0,000000
Model equation is processed using Two Stage Least Square (TSLS). Is shown in Table 5. that tangibility has a positive and significant influence. These results are consistent with the theory of trade-offs that states the company uses debt to get the benefits received through the payment of lower tax. Tangible assets becomes a tool for companies to get loans from lenders as a form of collateral. So that a positive and significant effect can be explained that with increasing or more and the amount of tangible assets owned by the company, the company's ability to obtain loans from lenders greater. This is supported by research conducted by Murhadi (2011) and Bandyopadhyay & Barua (2016).
Table 5. Result for First Model
Independent Variable
Dependent Variable
Coefficient
Sig.
C
2,140920
0,0000
TANG
0,110611
0,0000***
SIZE
-0,129716
0,0000***
GROWTH
-0,023463
0,0447**
LIQ
-0,024210
0,0000***
R-squared
0,456313
0,000000
F-statistic
286,4090
0,000000
The size of the company has a negative and significant effect. These results are consistent with the pecking order theory which states that a large company has strength of strong internal funds. Great companies are able to manage refinancing risk so well that the funding decision the company will use internal funds. On this basis, the company will not consider external funds as an option for funding the company's decision. Thus, the larger the company, the smaller debt. This is according to research conducted by Bandyopadhyay & Barua (2016).
The company's growth has a negative and significant effect. These results indicate that the higher growth caused the company to further reduce the use of debt in financing undertaken by the company. This is due to the company's business cycle is moving up closer to mature stages and will end the decline stage. Stages mature indicates that the company has reached the highest point of the performance of the company. Thus, the company's future became uncertain, in this case, raise issues of sales. In a study conducted by Murhadi (2011) states that companies whose growth increases would reduce the use of debt due to the uncertainty of income in the future.
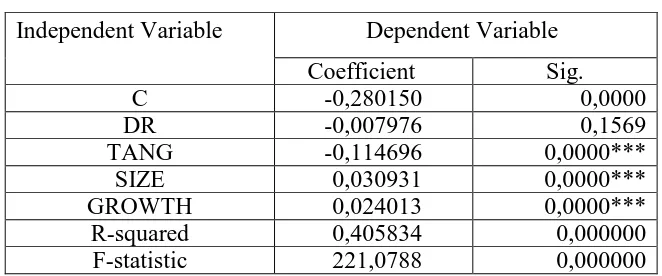
The second equation model results shown in Table 6 which shows that the capital structure has a negative impact and no significant effect on the company's performance. According to Sheikh & Wang (2013) indicates that the negative effect of debt companies can reduce conflict among agents, weakening the role of managers in making decisions to improve enterprise performance. The company is too big to take portions of the debt so that the role of the owner of the debt / bond greatly affect the loan agreement so tight. It is also supported by research conducted by Vatavu (2015). No significant effect can be explained that the company increase it’s gearing to be able to pay off the debt that has matured. Thus the benefits of debt does not affect the performance of the company. This is consistent with research conducted by Raza (2013), Oshoke & Sumaina (2015), and Fachrudin (2016).
Table 6. Result for Second Model
Independent Variable
Dependent Variable
Coefficient
Sig.
C
-0,280150
0,0000
DR
-0,007976
0,1569
TANG
-0,114696
0,0000***
SIZE
0,030931
0,0000***
GROWTH
0,024013
0,0000***
R-squared
0,405834
0,000000
F-statistic
221,0788
0,000000
Tangibility have a negative and significant effect. These results indicate that the use of tangible assets which do not effectively create an additional burden for the company. Thus, the use of tangible assets to be inefficient so that the company closed the additional burden of the profits obtained through the company. Therefore, with the increase in tangible assets owned by the company, so does the additional burden borne so that the company's performance has declined. This result is also supported by research conducted by Sheikh & Wang (2013) and Vatavu (2015) which states that the influence of tangibility and return on assets was negative.
The size of the company has a positive and significant influence. These results are consistent with the trade-off theory which states that a large company can reduce the risk of default and the risk of bankruptcy that can be experienced by the company. The company's ability to lower these risks due to the company's ability to implement the economic scale well and also influence on the market (Dawar, 2014). Another study conducted by Abor (2005) and Sheikh & Wang (2013) also states that the effects of size and return on assets is positive. In addition, companies that are very capable of maximizing tax advantages to increase its profit. Thus, the increasing size of the company, also increase the company's performance.
Based on the coefficient of determination (R2) in the first model showed that the tangibility, size, growth, and able to explain the liquidity amounting to 45.63% of the capital structure of all companies listed on the Stock Exchange 2011-2015 period. While 54.37% of the entire capital structure of companies listed on the Stock Exchange 2011-2015 able to be explained by other variables. Furthermore, the second model showed that the capital structure, tangibility, size, and is able to explain the growth of 40.58% on the performance of all companies listed on the Stock Exchange 2011-2015 period. While 59.42% of the performance of all companies listed on the Stock Exchange from 2011 to 2015 periods able to be explained by other variables.
Conclusion
The results showed that the variables tangibility has a positive and significant impact on the capital structure. While variable size, growth, and liquidity has a negative and significant effect. In the second model, the result that the variable tangibility has a negative and significant effect on the performance of the company, while the size and growth has a positive and significant impact on company performance. Variable debt ratio had no significant effect on the performance of the company. For further research, it can add objects wider so as to obtain a description of the complete structure more capital. In addition, there is the possibility of other factors that are better able to explain in addition to the factors used in this study, according to the coefficient of determination.