www.elsevier.com / locate / econbase
Does deposit insurance stimulate capital inflows?
*
Philip R. Lane , Selen Sarisoy
Economics Department, Trinity College Dublin, Dublin 2, Ireland
Received 24 August 1999; accepted 26 May 2000
Abstract
We empirically investigate the relationship between explicit deposit insurance and private capital inflows to developing countries during the 1990s. The results do not indicate a significant relationship between explicit deposit insurance and the scale of capital inflows. 2000 Elsevier Science S.A. All rights reserved.
Keywords: Capital flows; deposit insurance
JEL classification: G21; F21; F34
1. Introduction
This paper asks whether the presence / absence of deposit insurance schemes helps to explain the cross-country variation in the surge in private capital inflows to emerging markets in the early 1990s. As is well understood from Diamond and Dybvig (1983), deposit insurance enhances the stability of the financial system by reducing the risk of bank runs, raising the confidence of depositors. Since banks intermediate a large fraction of capital flows into developing countries, the introduction of deposit insurance may be expected to raise the attractiveness of a given country to international investors (Calvo, 1998; Goldfajn and Valdes, 1997). Moreover, under moral hazard, deposit insurance may induce domestic banks to undertake riskier lending strategies, enabling them to offer higher returns to international investors. Such a premium will be attractive if the domestic monetary authority has sufficient reserves to credibly fund the deposit insurance scheme (Calomiris, 1997; Dooley, 1997). Perhaps surprisingly, the relationship between deposit insurance and capital inflows has not been previously examined. In other work, Demirguc-Kunt and Detragiache (1997) find a pronounced positive partial correlation between explicit deposit insurance and systemic banking insolvencies. Cull (1998) studies the effect of explicit deposit insurance schemes on financial sector depth. Rossi (1999) shows that greater depositor protection is associated with a higher risk of banking and currency crises.
*Corresponding author. Tel.: 1353-1-608-2259; fax: 1353-1-677-2503. E-mail address: [email protected] (P.R. Lane).
2. Summary statistics and regression analysis
We consider four different measures of private capital inflows. Gross private capital inflows (GPCI) from the IMF’s International Financial Statistics includes direct investment inflows, portfolio
1
investment liabilities and other investment liabilities. Syndicated loans and International bond issues from the OECD’s International Capital Markets Statistics are used to measure gross capital inflows.
Syndicated loans (SYNL) are loans with an original maturity of at least one year which have been
granted by a syndicate of commercial banks. International bond issues (IBI) include gross public and private placements of euro-bond issues and foreign bond issues. Finally, net private capital flows (NPCF) from the World Bank’s World Development Indicators database are used as another measure for private capital flows. Net private capital flows are comprised of private debt and non-debt flows which include commercial bank lending, bonds and other private credits, as well as foreign direct investment and portfolio equity investment. For all four variables, the data are converted into 1990 constant US dollars, deflated by the US CPI.
The data on deposit insurance are provided by an IMF survey reported in Kyei (1995). The survey identified countries with explicit deposit insurance as countries that have explicit guarantees stated in a statute in the constitution, Central Bank law or banking law, specifying the types of institutions and deposits covered, and the coverage limits. The combined dataset (IMF, WB and OECD) consists of 31 developing countries included in the deposit insurance survey (Appendix A): among these, 12 countries are reported to have explicit deposit insurance schemes with no explicit scheme in the other
2
19 countries. The time period is 1990–95, to capture the surge in private capital flows to developing countries after 1989 and prior to the recent international financial crisis.
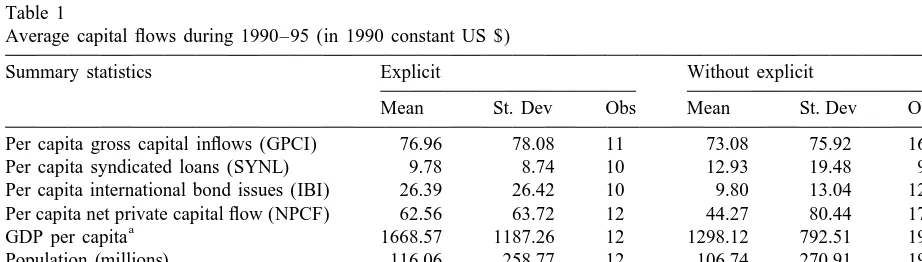
Table 1 reports summary statistics. For all measures of the capital flows except syndicated loans, private capital flows to countries with explicit deposit insurance are higher than countries with no explicit insurance. The difference between average per capita gross capital inflows to countries with explicit deposit insurance and without explicit insurance is not large but average per capita
Table 1
Average capital flows during 1990–95 (in 1990 constant US $)
Summary statistics Explicit Without explicit
Mean St. Dev Obs Mean St. Dev Obs
Per capita gross capital inflows (GPCI) 76.96 78.08 11 73.08 75.92 16 Per capita syndicated loans (SYNL) 9.78 8.74 10 12.93 19.48 9 Per capita international bond issues (IBI) 26.39 26.42 10 9.80 13.04 12 Per capita net private capital flow (NPCF) 62.56 63.72 12 44.27 80.44 17
a
GDP per capita 1668.57 1187.26 12 1298.12 792.51 19
Population (millions) 116.06 258.77 12 106.74 270.91 19
Openness (% of GDP) 43.44 19.19 12 67.56 36.47 19
Debt (% of GNP) 48.58 12.62 12 71.76 53.64 18
a
In constant 1987 US$.
1
This variable was calculated by adding line 78bed, 78bgd and 78bid from IFS, March 1998.
2
international bond issues for countries with explicit deposit insurance is nearly three times that of countries without explicit insurance. In contrast, average per capita syndicated loans for countries with explicit insurance is actually lower than that for countries without explicit insurance. Finally, average per capita net private capital flows are nearly 50 percent higher for countries with explicit deposit insurance compared to countries without explicit insurance.
Table 1 also shows that the countries with explicit insurance schemes in our sample have higher per capita GDP compared to countries that do not have explicit insurance. These countries are also less open but this may be largely explained by the fact that they are also larger countries in terms of population than countries without explicit deposit insurance schemes. Finally, countries with explicit deposit insurance have lower levels of external indebtedness in comparison to countries that do not have explicit insurance schemes.
In the cross-sectional regression analysis in Tables 2–5, we regress each measure of private capital inflows on the explicit deposit insurance dummy and a set of control variables. The control variables are as follows. GDP per capita (in constant 1987 US dollars) (GDP-PC) serves as an indicator of the level of development of the country. Population (POP) is used in order to control for the size of the country: Calvo and Mendoza (1999) argue that fixed costs are important in international investment decisions. Openness (OPEN), measured as a percentage of imports and exports to GDP in 1990, plausibly improves creditworthiness and may be a positive indicator of growth prospects (Lane,
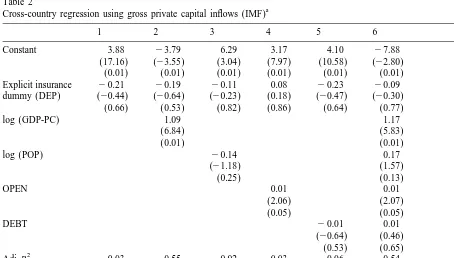
Table 2
a
Cross-country regression using gross private capital inflows (IMF)
1 2 3 4 5 6
Constant 3.88 23.79 6.29 3.17 4.10 27.88
(17.16) (23.55) (3.04) (7.97) (10.58) (22.80) (0.01) (0.01) (0.01) (0.01) (0.01) (0.01) Explicit insurance 20.21 20.19 20.11 0.08 20.23 20.09 dummy (DEP) (20.44) (20.64) (20.23) (0.18) (20.47) (20.30)
(0.66) (0.53) (0.82) (0.86) (0.64) (0.77)
log (GDP-PC) 1.09 1.17
S.E. of regression 1.11 0.74 1.10 1.08 1.12 0.74
N 27 27 27 27 27 27
a
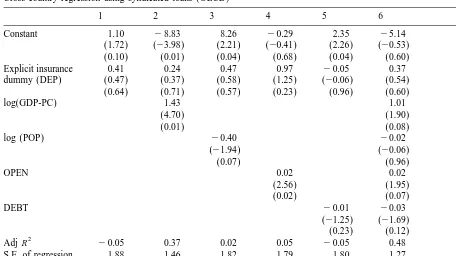
Table 3
a
Cross-country regression using syndicated loans (OECD)
1 2 3 4 5 6
Constant 1.10 28.83 8.26 20.29 2.35 25.14
(1.72) (23.98) (2.21) (20.41) (2.26) (20.53) (0.10) (0.01) (0.04) (0.68) (0.04) (0.60)
Explicit insurance 0.41 0.24 0.47 0.97 20.05 0.37
dummy (DEP) (0.47) (0.37) (0.58) (1.25) (20.06) (0.54) (0.64) (0.71) (0.57) (0.23) (0.96) (0.60)
log(GDP-PC) 1.43 1.01
S.E. of regression 1.88 1.46 1.82 1.79 1.80 1.27
N 19 19 19 19 18 18
a
Dependent Variable: Log of Per Capita Syndicated Loans, 1990–95 (1990 constant US$). White heteroskedasticity-consistent standard errors and covariances calculated. t-statistics and P-values in parentheses.
2000). External debt (DEBT), measured as a percentage of GNP in 1990, is included to proxy default risk. Estimation is by ordinary least squares, with White standard errors.
In Tables 2–5, the basic specification in column (1) is the simple regression of the log of per capita private capital flows on a constant and the explicit insurance dummy variable. In columns (2)–(5), each of the control variables are entered individually. Finally, all the control variables are entered jointly in column (6).
In Table 2, the dependent variable is gross private capital inflows (GPCI). Across the specifications, the explicit deposit insurance dummy variable is statistically insignificant. Among the control variables, GDP per capita explains a large fraction of the cross-country variation in capital inflows in columns (2) and (6), with the more advanced developing countries receiving the largest inflows. Trade openness also exerts a significant positive effect on capital inflows in columns (4) and (6) but country size and initial external debt are insignificant.
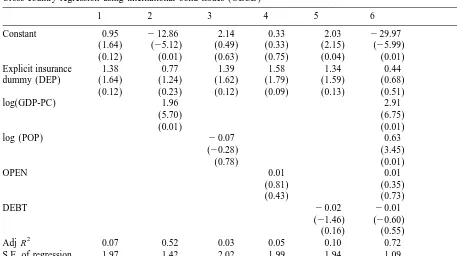
Tables 3 and 4 show the results of the regression analysis when the OECD’s measures for
Syndicated loans and International bond issues are respectively employed as the dependent variable.
Table 4
a
Cross-country regression using international bond issues (OECD)
1 2 3 4 5 6
Constant 0.95 212.86 2.14 0.33 2.03 229.97
(1.64) (25.12) (0.49) (0.33) (2.15) (25.99) (0.12) (0.01) (0.63) (0.75) (0.04) (0.01)
Explicit insurance 1.38 0.77 1.39 1.58 1.34 0.44
dummy (DEP) (1.64) (1.24) (1.62) (1.79) (1.59) (0.68) (0.12) (0.23) (0.12) (0.09) (0.13) (0.51)
log(GDP-PC) 1.96 2.91
S.E. of regression 1.97 1.42 2.02 1.99 1.94 1.09
N 22 22 22 22 22 22
a
Dependent Variable: Log of Per Capita International Bond Issues, 1990–95 (1990 constant US$). White heteroskedas-ticity-consistent standard errors and covariances calculated. t-statistics and P-values in parentheses.
We turn to net private capital flows in Table 5. In fact, we may expect a weaker effect of deposit insurance on net flows relative to gross flows: any extra deposits placed in local banks may simply be reinvested overseas (Dooley, 1997). As for the measures of gross capital inflows, there is no evidence of a positive impact of deposit insurance on net flows. Among the control variables, GDP per capita remains highly significant. There is some evidence of a positive size effect in column (6) of Table 5 but trade openness is now insignificant.
In results not reported here, we found the insignificance of the deposit insurance dummy to be robust to the exclusion of outliers in all four datasets. Furthermore, the results did not change when the sample was restricted to only middle income countries or when different time periods were chosen (1990–93; 1990–94).
3. Conclusion
Our results do not indicate a significant relationship between deposit insurance schemes and private capital flows to developing countries during 1990–95.
Table 5
a
Cross-country regression using net private capital flows (World Bank)
1 2 3 4 5 6
Constant 3.01 28.86 5.55 1.75 3.54 220.14
(10.61) (24.66) (2.14) (2.43) (5.86) (24.78) (0.01) (0.01) (0.04) (0.02) (0.01) (0.01) Explicit insurance 0.08 20.28 0.12 0.48 20.12 20.23 dummy (DEP) (0.12) (20.69) (0.18) (0.77) (20.17) (20.60)
(0.91) (0.49) (0.86) (0.45) (0.87) (0.56)
log(GDP-PC) 1.72 2.07
S.E. of regression 1.61 0.97 1.62 1.54 1.64 0.78
N 29 29 29 29 28 28
a
Dependent Variable: Log of Per Capita Net Private Capital Flows, 1990–95 (1990 constant US$). White heteroskedas-ticity-consistent standard errors and covariances calculated. t-statistics and P-values in parentheses.
that all are aware that banks that are ‘‘too-big-to-fail’’ will be rescued in the event of financial distress, even in the absence of a formal deposit insurance scheme. The operation of implicit insurance is reinforced in some developing countries in which banks are part of broader industrial conglomer-ates, to the extent that the industrial holding groups exert significant political influence. Although explicit deposit insurance schemes do not help to explain the pattern of capital flows, it is worth recalling the findings of Demirguc-Kunt and Detragiache (1997), Cull (1998) and Rossi (1999) that do show an impact on bank insolvencies, financial sector depth and the likelihood of banking and currency crises.
A weak distinction between explicit and implicit deposit insurance helps to rationalize the finding there is no relationship between explicit deposit insurance and private capital flows to developing countries. However, explicit deposit insurance is only one aspect of a safety net of a country, and there is much room for more investigation. Other aspects of the safety net that warrant further analysis include lender of last resort facilities, prudential regulations and supervision.
Acknowledgements
network on ‘The Analysis of International Capital Markets: Understanding Europe’s Role in the Global Economy’, funded by the European Commission under the Research Training Network Programme (Contract No. HPRN–CT–1999–00067).
Appendix A. Country classification
Country Classification Explicit Dataset
Deposit Insurance
Argentina Middle income Yes IMF, OECD, WB
Bangladesh Low income Yes IMF, OECD, WB
Bolivia Middle income No IMF, OECD, WB
Brazil Middle income No IMF, OECD, WB
Chile Middle income Yes IMF, OECD, WB
China Low income No IMF, OECD, WB
Colombia Middle income Yes IMF, OECD, WB
Costa Rica Middle income No IMF, OECD, WB
Dominican Republic Middle income Yes IMF, WB
Ecuador Middle income No OECD, WB
Egypt Middle income No OECD, WB
El Salvador Middle income Yes IMF, OECD, WB
Guatemala Middle income No IMF, OECD, WB
Honduras Low income No IMF, WB
India Low income Yes IMF, OECD, WB
Indonesia Middle income No IMF, OECD, WB
Iran Middle income No IMF
Jamaica Middle income No IMF, OECD, WB
Jordan Middle income No IMF, OECD
Malaysia Middle income No IMF, OECD, WB
Mexico Middle income Yes IMF, OECD, WB
Pakistan Low income No IMF, OECD, WB
Paraguay Middle income No IMF, WB
Philippines Middle income Yes IMF, OECD, WB
Sri Lanka Low income No IMF, WB
Thailand Middle income No IMF, OECD, WB
Trinidad and Tobago Middle income Yes OECD, WB
Turkey Middle income Yes IMF, OECD, WB
Uruguay Middle income No IMF, OECD, WB
Venezuela Middle income Yes IMF, OECD, WB
References
Calomiris, C., 1997. The postmodern bank safety net: lessons from developed and developing economies. Mimeo, American Enterprise Institute, Washington, D.C..
Calvo, G., 1998. Balance of payments crises in emerging markets: large capital inflows and sovereign governments. Mimeo, University of Maryland.
Calvo, G. and E. Mendoza, 1999. Rational contagion and the globalization of securities markets. Journal of International Economics, forthcoming.
Cull, R., 1998. The effect of deposit insurance on financial depth: a cross-country analysis. World Bank Working Paper no. 1875.
Demirguc-Kunt, A., Detragiache, E., 1997. The determinants of banking crises: evidence from developing and developed countries. International Monetary Fund working paper no. 97 / 106.
Diamond, D., Dybvig, P., 1983. Bank runs, deposit insurance and liquidity. Journal of Political Economy 91, 401–419. Dooley, M., 1997. A model of crises in emerging markets. NBER Working Paper no. 6300.
Goldfajn, I., Valdes, R., 1997. Capital flows and the twin crises: the role of liquidity. International Monetary Fund working paper no. 97 / 87.
Kyei, A., 1995. Deposit protection arrangements: a comparative study. International Monetary Fund working paper no. 95 / 134.
Lane, P.R., 2000. International trade and economic convergence: the credit channel. Oxford Economic Papers, forthcoming. Rossi, M., 1999. Financial fragility and economic performance in developing economies: do capital controls, prudential