SPECIAL SECTION: LAND USE OPTIONS IN DRY
TROPICAL WOODLAND ECOSYSTEMS IN
ZIMBABWE
A simulation model of miombo woodland dynamics under
different management regimes
J. Gambiza
a,*, W. Bond
b, P.G.H. Frost
c, S. Higgins
daDepartment of Biological Sciences,Uni6ersity of Zimbabwe,Box MP167,Harare,Zimbabwe bDepartment of Botany,Uni6ersity of Cape Town,Cape Town,South Africa cInstitute of En6ironmental Studies,Uni6ersity of Zimbabwe,Harare,Zimbabwe dInstitute of Plant Conser6ation,Uni6ersity of Cape Town,Cape Town,South Africa
Abstract
Miombo woodlands are crucial to the livelihoods of rural people throughout southern, eastern and central Africa. This paper describes a dynamic simulation model of key ecological processes in miombo and examines the ecological and economic impacts of various forms of management. The model shows that removing harvestable trees and reducing the level of grazing by livestock causes an increase in grass fuel loads and a corresponding increase in the frequency of fires. More frequent and intense fires in turn suppress woody regrowth, thereby adversely affecting harvestable tree stocks. Despite the marked ecological response to manipulating the level of grazing, the impacts on economic performance were minimal. The NPVs for Forestry Commission in particular remained relatively constant under different management regimes. Given these low potential returns, the advantage of applying some of the known silvicultural management treatments to miombo woodlands seems questionable. Varying the proportion of har-vestable timber trees cut and changing the length of the cutting cycle might suggest that profits to the Forestry Commission or timber concessionaires could be maximised by harvesting as much timber as possible in a single cutting period. Under such a scenario, however, the woodland would be rapidly converted to bushland. There is a need to explore further the trade-offs between direct use values, as derived from harvesting and selling timber, and ecological service functions, such as carbon sequestration and modifications of the hydrological cycle. © 2000 Elsevier Science B.V. All rights reserved.
www.elsevier.com/locate/ecolecon
1. Introduction
Miombo woodlands, characterised by the over-whelming dominance of trees in the genera
BrachystegiaandJulbernardia, cover an estimated
2.7 million km2 in southern, central and eastern
Africa (Frost, 1996). They constitute the most extensive woodland type in Zimbabwe where they provide a wide variety of products and services, ranging from timber and fuel to medicines and * Corresponding author.
food (Campbell et al., 1996). They are also impor-tant for spiritual and cultural reasons, as well as through their impacts on local climate, soils and hydrological functioning.
Large trees are harvested commercially for tim-ber (furniture wood, mine props) and charcoal production, while poles are harvested by commu-nal area residents, mainly for construction and fuel wood. Information is needed on the extent to which management can maximise the sustainable productivity of different size classes of preferred species in Zimbabwe (mainly Brachystegia and
Julbernardia spp., Pterocarpus angolensis and
Afzelia quanzensis). Opening up the tree canopy
increases grass growth (Barnes, 1979), thereby increasing the likelihood and intensity of dry-sea-son fires, a prominent feature of tropical savan-nas. Fire, in turn, suppresses the growth and recruitment of saplings to the canopy. We there-fore also need to understand more precisely how tree removal might influence the fire cycle and thereby the processes of establishment and growth of recruits and the regrowth of harvested trees.
The impacts of fire on woody vegetation are influenced by several interacting factors — timing and frequency of burning, type of fire, and fire intensity, itself affected by fuel load, particle size and density, fuel moisture content, and ambient conditions at the time of the fire (Barnes, 1965; Frost et al., 1986; Frost and Robertson, 1987; Chidumayo, 1988; Bond and van Wilgen, 1996). The impacts vary among woody species and, within species, among size classes. Many species in miombo are able to resprout from surviving rootstocks, often becoming multi-stemmed in the process (Robertson, 1984). Such plants can be maintained in a multi-stemmed state for decades by fire and, in some cases, by browsing. We use the term ‘gullivers’ to describe these fire-sup-pressed multi-stemmed individuals1 (sensu Bond
and van Wilgen, 1996). Species that exhibit this type of recruitment include most of the dominant canopy tree species in miombo such asBrachyste
-gia spiciformisandJulbernardia globiflora, as well
as species such as Baikiaea plurijuga and
Colophospermum mopane that are dominant in
other regionally important woodland ecosystems. Fuel load is a key determinant of fire intensity and hence impact on woody plant dynamics. Standing dead grass and litter make up most of the fuel for savanna fires. Grass production is positively related to annual rainfall in areas re-ceiving less than 1000 mm (Rutherford, 1981; Dye and Spear, 1982), but is modified by woody plant cover and grazing intensity. The negative relation-ship between tree biomass and grass production means that fuel loads are generally greatly re-duced in woodland. This lessens both the proba-bility of the site being able to sustain a fire and fire intensities, and hence reducing potential dam-age to trees (Chidumayo et al., 1996; Frost, 1996). Likewise, heavy grazing reduces the standing stock of grass, leading in turn to lower fuel loads and fire intensities.
The key factor limiting recruitment to the woodland canopy is therefore the failure of fire-suppressed individuals to reach a size at which their bark is thick enough to prevent damage to the underlying vascular tissues (Bond and van Wilgen, 1996). (Frequent cutting and, occasion-ally, browsing by species such as elephant also serve to suppress regrowth.) Relatively long dis-turbance-free intervals are needed to enable indi-viduals to grow to a size that will allow them to escape into the canopy. Once a sufficient number of trees have reached the canopy, shading reduces grass production. This in turn leads to less fuel for fires and hence to lower fire frequencies and inten-sities. Because the relationship between miombo tree canopy cover and grass production is strongly negatively exponential, there appears to be a threshold that leads either to ‘gulliver’ – grass mixtures with frequent, high-intensity fires on one side, or to a relatively closed woodland with fewer, low-intensity fires on the other (Frost, 1996). Harvesting canopy trees for commercial or other purposes may therefore drive a woodland across the threshold towards increased grass pro-duction, fuel loads, fire frequencies and intensities, resulting in a sharp and difficult-to-reverse change in vegetation structure and functioning from a woodland to a tall grassland with low-growing,
1The term ‘gulliver’ alludes to the eponymous character in
fire-suppressed woody plants. This latter state is sometimes referred to as the ‘fire trap’ (Bell, 1984).
The main aim of the current work was to produce a dynamic simulation model of the inter-actions among tree growth, grass production, grazing, fire and harvesting to assist in under-standing the longer-term dynamics of these wood-lands under different kinds and intensities of use. The model formed the core of a broader ecologi-cal – economic model of the people – woodland in-teractions so prevalent across much of south-central Africa (Campbell et al., 2000a). In particular, the model was developed to answer the following questions:
1. What effect does removing harvestable trees have on woodland structure and thereby on grass fuel loads, and how does this in turn influence fire frequency and intensity?
2. How is woodland structure affected by chang-ing fire frequencies and intensities?
3. What is the sustainable level of commercial timber removal in terms of optimising the regeneration and regrowth of harvested trees and the recruitment and growth of saplings? 4. What level of grazing by cattle is needed to
significantly reduce fuel loads and hence fires? 5. What combinations of livestock and fire are needed to maximise production of commercial timber?
6. Can management interventions in some of these ecological processes increase the level of benefit derived from these woodlands by both commercial and subsistence users?
2. Methods
We developed a model that reflected both the interaction between fire and woody plants, and the effects of tree harvesting on production of different size classes of woody plants. We also modelled how manipulating fire fuels by grazing and fire management might influence the recruit-ment of canopy trees. The model was based loosely on the environmental and ecological con-ditions found in NW Zimbabwe where miombo intersects theBaikiaea plurijuga-dominated
wood-lands found on Kalahari Sand (see White, 1983; Frost, 1996, for general descriptions of the rela-tionship between these regionally important vege-tation formations). The choice of site was dictated by a number of considerations: the importance of the area for indigenous forestry in Zimbabwe, reflected in the considerable area set aside as state forest reserves; the ecological and economic issues raised by logging these forests; and the presence of transboundary conflicts between the Zimbabwe Forestry Commission and rural people in adjacent communal farming areas. The knowledge and in-terests of some of the researchers in this area was also a factor.
Mean annual rainfall in this area is about 650 mm, most of it occurring in a 6-month summer wet season. This is near the lower end of mean annual rainfall amounts at which miombo occurs. The model was developed mainly using relation-ships published in a recent synthesis of miombo ecology (Frost, 1996). The model can be modified for a higher rainfall regime by adjusting the woody plant growth rate and the asymptotic basal area of canopy trees. The basal area of mature stands of miombo woodland varies with mean annual rainfall and temperature (Frost, 1996). Soil depth is also a factor, but neither this nor temperature was taken into account in our model.
2.1. Description of the ecological model
The model was built usingSTELLA, a high-level performance programming package (High Perfor-mance Systems, 1996). It comprised four interac-tive sub-models: rainfall; grass production and fuel load; fire occurrence; and tree dynamics.
2.1.1. Rainfall sub-model
based. A sine wave function was used to simulate decade-scale fluctuations in rainfall around the long-term average, with the amplitude of this periodicity set at 10% of mean annual rainfall. For the sine wave function, the long-term period was set at 20 years as this broadly corresponds to the observed pattern of rainfall in southern Africa, where there is an 18 – 20-year cycle com-prising approximately 9 – 10 years above-average rainfall alternating with a corresponding period of below-average rainfall (Tyson, 1986).
2.1.2. Grass sub-model
The grass model simulates grass production and fuel load. Grass production was calculated using regression equations relating production to rain-fall (Dye and Spear, 1982) and a function relating grass yield to total tree basal area (Frost, 1996). One millimetre of rain was assumed to produce 2 kg dry matter (DM) ha−1 year−1 on cleared
areas on sandy soils (Dye and Spear, 1982), while 1 mm of rain produces less than 1 kg DM ha−1
year−1 in relatively closed canopy woodland
(Frost, 1996), due to shading by and competition for moisture from woody plants. Shading was modelled as a continuous variable, set as a func-tion of woody basal area and scaled to range from 0 to 1. The relationship was derived from the observed negative exponential relation between grass yield and basal area of trees. Grass produc-tion was constrained to a maximum of 4000 kg DM ha−1, an upper limit for open miombo
woodlands at 600 – 800 mm annual rainfall (Frost, 1996).
The fuel load was simulated as a function of grass growth rate, grass production, grazing rate, proportions of grass burnt off (set at 0.9), and grass decay. Grass fuel loads may accumulate with successive years of above-average rainfall and in the absence of fire. Fuel loads are reduced by fire, grazing, death and decomposition. The grazing rate simply reduced the amount of grass by a proportion that was linearly related to stock-ing rate. The rate of grass decay was estimated using a decomposition constant of 0.88 year−1for
grass litter (Frost, 1996). In addition to grass, the fuel load also comprised 20% of the gullivers’ biomass.
2.1.3. Fire sub-model
Fires were modelled as occurring naturally whenever there was both an ignition event and sufficient fuel to allow the fire to spread. The probability of ignition was calculated as a func-tion of the time since the last fire. The likelihood of ignition at 3 years since the last fire was set at
P=0.5. Trollope (1993) found that fire only spread in savannas when grass fuel loads were greater than 1000 kg DM ha−1. In contrast, local
observations indicate that fires can spread when the fuel load is as low as 800 kg DM ha−1
(Rushworth, 1975), but such fires do not kill the aboveground parts of gullivers (‘top kill’). We used a value of 1050 kg DM ha−1, as this
pro-duced a fire frequency similar to that observed in woodlands with the characteristics used to parameterise the model (see below — woodland without tree removal or grazing). We did not distinguish between cool dry-season fires and hot dry-season fires, but future work should aim to incorporate this component.
Prescribed burning is used in the management of miombo woodlands. To simulate this feature, we provided a switch that could replace the natu-ral fire regime, based on random probabilities of ignition, with a management fire regime in which the frequency of burning was fixed for a given simulation. Whether a fire actually occurred in the year of a planned burn still depended on there being sufficient fuel to sustain the fire.
2.1.4. Tree sub-model
Woody vegetation was divided into four size classes, namely (i) suppressed saplings (‘gullivers’:
B5 cm diameter at base and B2 m tall), (ii) pole
saplings (5 – 15 cm diameter at base and \2 m
tall), (iii) medium-sized trees (15 – 35 cm diameter at base and 5 – 12 m height, with crowns that form part of the woodland canopy) and (iv) harvestable trees (\35 cm diameter at base). As their name
could be converted to basal area and biomass by using regressions given by Frost (1996).
To model woody plant dynamics, we assumed that the maximum biomass of trees in a stand is constrained by available moisture and site condi-tions, reflecting the physiological limits to woody biomass accumulation. This asymptotic value for basal area can be made a function of rainfall using a regression equation given by Frost (1996). Shading increased the mortality of gullivers and poles. This relationship was modelled as a logistic function so that mortality was effectively nil be-low a woody basal area of 8 m2
ha−1
, rising steeply to 100% above 16 m2
ha−1
. We also modelled the influence of fires of differing intensi-ties on the mortality of plants in the different size classes. Fires occurring at fuel loads of 1150 kg DM ha−1 or more were assumed to kill 20% of
gullivers; the other size classes were unaffected. Such fires are termed ‘gulliver hot fires’. Fuel loads equal to or greater than 1200 kg DM ha−1
produced a ‘woody plant hot fire’. Such fires were assumed to kill 6% of poles, in contrast to a background mortality rate of 3% (excluding shad-ing-related deaths). Medium-sized and harvestable trees have mortality rates of about 1% (Trapnell, 1959), but we presumed that this doubled when there was a ‘woody plant hot fire’.
As total woody basal area increased towards its asymptote, the transitions to larger size classes were proportionally reduced, reflecting a negative effect of shading on growth. Transition probabili-ties to larger size classes, in the absence of fire, were calculated as described below (see the section on parameterisation of the model). In the pres-ence of ‘gulliver hot fires’ only 0.1% of gullivers escaped the fire and moved to the pole size class. In the case of ‘woody plant hot fires’, the transi-tion rates to the next larger size class were re-duced by half for poles, but left unchanged for the medium-sized tree to harvestable tree transition.
Reversals from larger to smaller size classes were governed by fire and cutting. The proportion of poles becoming gullivers in a ‘woody plant hot fire’ was assumed to be 75%. Cutting of poles and medium-sized trees resulted in the cut individuals reverting to the gulliver size class, but cutting of harvestable trees was assumed to kill them.
Re-generation of large trees after cutting is rare (Frost, pers. obs.). In addition, 5% of poles and 25% of medium-sized trees were assumed to die when cut; thus 95% of cut poles and 75% of damaged medium-sized trees reverted to being gullivers. To reflect the high impact of unre-strained logging, each harvestable tree that was cut was assumed to result in collateral damage to five medium-sized trees; these reverted to being gullivers. Varying the cutting cycle allowed the effect of different intervals between cutting to be examined. All the trees to be cut in a logging cycle were assumed to be removed in the year of cut-ting, whereas in reality the trees are removed over longer periods of up to 8 years. This assumption does not materially affect our results or conclusions.
The number of gullivers was augmented both by reversions due to fire and cutting, and by recruitment following episodes of seedling estab-lishment. These were assumed to occur in years when rainfall was 25% or more above average. Establishment was presumed to be linearly related to grass biomass, with 125 seedlings ha−1
becom-ing established in the absence of grass and only 12.5 seedlings ha−1
establishing at 3000 kg DM ha−1
of grass (see Knoop and Walker, 1984, for the impact of grass on seedling establishment).
2.2. Parameterisation of the ecological model
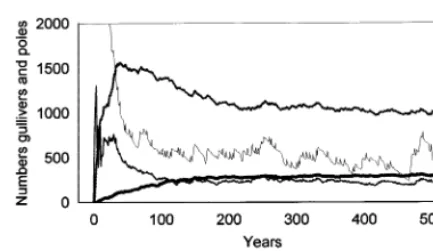
The model was parameterised in a two-stage process beginning with an initial model run of 500 years with a starting population of 5000 gullivers ha−1, and 2000 kg DM ha−1of grass (Fig. 1). In
Fig. 1. The initial run of the model (Version 1) to derive the numbers of individuals in different size classes. In year 1 the only individuals present were gullivers. Fire occurred on aver-age every 6.2 years, and grazing and cutting were excluded.
This version of the model is referred to as Version 1 in this paper.
A second version of the model (Version 2) was parameterised using transition probabilities that were 50% lower than those used in Version 1. In the 500-year parameterisation runs for Version 2, this change produced basal area estimates that were 20 – 25% lower than expected for such wood-lands in nature. To offset this, we increased the asymptotic basal area to 12.6 m2ha−1in Version
2 (19% increase). The initial values for woody plant densities and grass biomass in Version 2 were calculated as before to give 481 gullivers ha−1
, 278 poles ha−1
, 80 medium-sized trees ha−1, 21 harvestable trees ha−1, and 743 kg DM
ha−1 of grass.
While many of the values and functions used in the model are based on Frost’s (1996) synthesis, there are some parameters and variables for which the data are limited or non-existent. Two long-term studies to derive some of these values have now been initiated (Gambiza and Mapaure pers. comm.).
2.3. Ecological simulations and the scenarios in6estigated
Apart from the parameterisation runs (see above), all the ecological simulations were run for 200 years on an annual time step. To reduce the numbers of factors that could differ with each simulation run, the annual rainfall pattern and the ignition probability of fires were fixed across the different simulations. Where presented, mean val-ues for variables over a time period have been calculated over the full 200 years of a simulation. Scenarios differed in terms of the time between removal of harvestable trees (the cutting cycle), the proportion of harvestable trees removed dur-ing each cuttdur-ing period, cattle stockdur-ing rates, and fire frequencies.
2.4. Economic comparisons
Management is costly, particularly in the forestry industry where many costs are borne early while most of the benefits are received only much later. We examine possible financial incen-assumed maximum and minimum ages of the
plants in each size class to derive an age – class frequency distribution. This produced a typical inverse J-shaped curve, which was in turn used to calculate the maximum transition probabilities be-tween size classes: 0.16 year−1 for gullivers to
poles, 0.022 year−1 for poles to medium-sized
trees, and 0.017 year−1 for medium-sized to
har-vestable trees.
The model was then run for a further 500-year simulation, using these new transition probabili-ties and with initial numbers in each size class based on the average numbers calculated in the first run of the model. The average grass biomass and mean number of woody individuals in each size class during the last 100 years of this second run were used as the initial numbers in subsequent simulations and comparisons of scenarios. These numbers were 658 gullivers ha−1, 356 poles ha−1,
84 medium-sized trees ha−1, 17 harvestable trees
ha−1, and 848 kg ha−1 of grass. Asymptotic
basal area of woody plants at 650 mm mean annual rainfall was 10.6 m2 ha−1. Fire occurred
tives to manage these woodlands by exploring the level of net benefit that could result from under-taking various management options. For this, we used an integrated ecological – economic model (see Campbell et al., 2000a for details). That model incorporated the Version 2 ecological model and focused on three stakeholders: (i) woodland dwellers who cultivate land in, and harvest products from, the state forest; (ii) com-munal dwellers who use both the woodlands of the state forest and the adjacent communal area, but who only cultivate land in the communal area, and (iii) the Forestry Commission, the state authority that manages the state forest and derives revenue from grazing leases and timber concessions within it.
The model does not include other uses of the state forests in northwestern Zimbabwe, princi-pally safari hunting and eco-tourism. Conclusions about the scale of financial return to the Forestry Commission from managing these woodlands are constrained in this regard. We also did not explic-itly consider financial returns from cattle produc-tion by communal area residents, mainly because the study was focused on woodland dynamics and woodland management, but also because cattle production in communal lands is seldom an ob-jective in itself, but instead is an input to other production components of peoples’ livelihood sys-tems. To that extent, the multiple costs and benefits of cattle production are subsumed within the broader assessment of net benefits to liveli-hoods derived from peoples’ use of the woodlands.
The model includes a component that reflects timber harvesting by the Forestry Commission or a concessionaire, and which incorporates the financial costs and benefits of such cutting. The proportion of the harvestable trees cut in each period was taken to be 0.4 in the base case, and varied above and below this level in 0.2 unit intervals across the full range from no cutting to complete felling of all harvestable trees. The first cutting period occurred 5 years into the simula-tion and at the specified cutting intervals thereafter.
The full model incorporated human population increase, and use of the forests for crop
produc-tion, grazing, woodfuel, thatch, wild fruits and poles. The economic comparisons presented here are based on net present values (NPVs) for 60-year simulations, where the NPVs are for all the resources, other than wild animals, harvested by woodland and communal land dwellers and their livestock (grazing, crops, woodfuel, thatch, wild fruits and poles). Simulations were restricted to 60-years duration because beyond that the eco-nomic component of the integrated model be-comes less applicable as the farming and livelihood systems are likely to change substan-tially (Grundy et al., 2000). Discount rates in the calculations of NPV were set at 17 and 1%. The higher value is that commonly ascribed to the rate of time preference in communal areas (Campbell et al., 2000b), while the lower value reflects public concerns about the future of these woodlands (Pearce et al., 1989).
In this study, we investigated the economic implications of changing grazing levels in the state forest, the frequency and intensity of timber har-vesting, and the impacts of logging. Reduced im-pact logging was simulated by changing the number of medium-sized trees that reverted to gullivers when cutting harvestable trees. For high-impact logging, five medium-sized trees were as-sumed to be damaged for every harvestable tree cut, while for the reduced-impact logging sce-nario, no medium-sized trees were damaged.
3. Results
3.1. Impacts of tree remo6al on woodland
structure, fuel loads and fire regimes
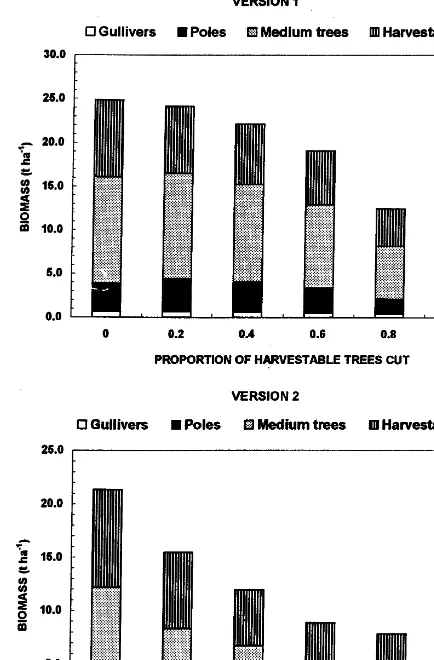
The proportion of harvestable trees removed in a 40-year cutting cycle substantially affected the total woody biomass, but not so markedly the distribution of biomass among the size classes. In Version 1 of the model, overall woody biomass was reduced by \50% when 80% or more of the
dis-Fig. 2. The effect of removal of harvestable trees on mean biomass (t ha−1) of gullivers, poles, medium-sized trees and
harvestable trees. The cutting cycle was set at 40 years, at which time 60% of harvestable trees were removed, and there was no grazing.
half as many trees as in Version 1 were removed (Table 1).
In the absence of grazing, removing harvestable trees increased grass production (Fig. 3). The response is more marked in Version 2 of the model because the slow growth rates of the woody plants amplify the positive feedback be-tween increased grass production and hence fuel load, fire frequency and intensity, leading to sup-pression of woody regrowth, reduced tree canopy cover and increased grass production. This ini-tiates the so-called ‘fire trap’ in which woody plant biomass and basal area are substantially reduced in the presence of frequent fires (Figs. 4 and 5). In Version 1 of the model, the frequency of ‘hot’ fires increased substantially when more than 40 – 60% of harvestable trees were removed; in Version 2, this increase occurred when as few as 20% of harvestable trees were removed (Table 1). Both the frequency of fire overall and the frequency of ‘hot’ fires were greater in Version 2 of the model, a further consequence of the slower rates of woody regrowth and therefore the re-duced ability of woody plants to suppress grass production.
3.2. Impacts of stocking rate on fuel load,
woodland structure and fire frequency
Grass biomass declined with increasing stock-ing rate (Fig. 3). Although the differences were not large, they had a substantial impact on fire frequencies (Figs. 4 and 5). Under a scenario of random ignition, and in the absence of grazing, hot fires occurred every 3 – 4 years, but fire fre-quencies declined substantially with even a small amount of grazing (5 – 10% of grass biomass re-moved at stocking rates of 0.013 – 0.025 LU ha−1:
Table 2). The differences in grass biomass in woodlands under different stocking rates were not as marked as expected, however, because al-though there is little reduction in fuel loads due to grazing at low stocking rates, the high frequency of fires at low stocking rates prevents grass from accumulating from year to year.
On a 40-year cutting cycle, with 60% har-vestable trees removed during each cutting period, grazing had a marked indirect impact on woody tribution of biomass among the different size
basal area, particularly in Version 2 of the model. In this version, the initial increase in grazing pressure associated with increased stocking rate reduced fire frequency slightly but sufficiently to allow more tree growth. This in turn enabled more harvestable trees to be cut over the 200-year period (Table 2). But as grazing pressure in-creased further, the incidence of fires, particularly hot fires, decreased sharply. Survivorship of the woody plants in the smaller size classes increased, which in turn led to more competition among them (modelled here as a shading effect) and slowed the transition of small trees to the har-vestable tree size class, producing so-called ‘bush encroachment’. This initial positive impact of grazing did not occur under the conditions simu-lated in Version 1 of the model because (i) woody plant growth rates were much greater; (ii) the shading effect on grass production was more pro-nounced; (iii) fewer hot fires occurred; and thus, (iv) the woody plants were able to recover more quickly and suppress grass production.
These results were obtained with a random ignition probability that produced a fire fre-quency, in the absence of grazing, of about one fire every 4 years. In simulations with more
fre-quent ignition events (once every 2 years), the increased frequency and intensity of fire had marked negative impacts on both woody plant basal area and the cumulative harvest, but in-creased grazing offset this trend at stocking rates greater than 0.025 LU ha−1
(Table 2). This was more marked in Version 2 of the model than in Version 1.
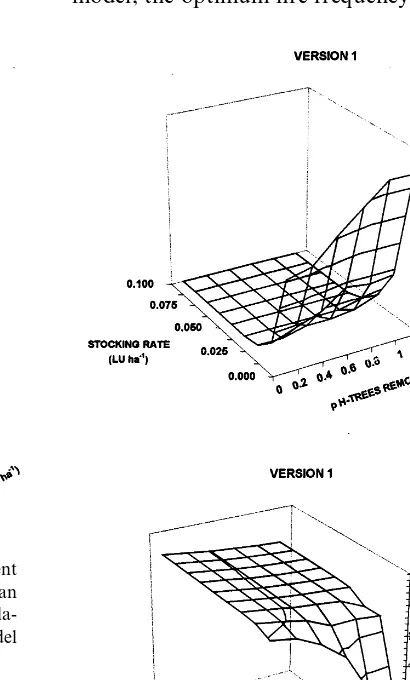
Fig. 6 shows the impact of grazing in relation to the proportion of harvestable trees cut and stocking rates. Under assumed natural growth rates (Version 1), grazing only had a slight posi-tive impact on the number of trees harvested over a 200-year period when more than 60% of har-vestable trees were removed in a cutting cycle and grazing pressure was low (Fig. 6a). Above a stocking rate of 0.025 LU ha−1 the effect was
negligible. In marked contrast, when woody plants were modelled with slower growth rates (Version 2), the number of trees harvested was substantially lower than in Version 1 when more than 40% of harvestable trees were removed in a cutting cycle and grazing pressure was low or absent (Fig. 6b). This is due to the higher inci-dence of hot fires in Version 2 of the model under these conditions. Increasing grazing pressure, by
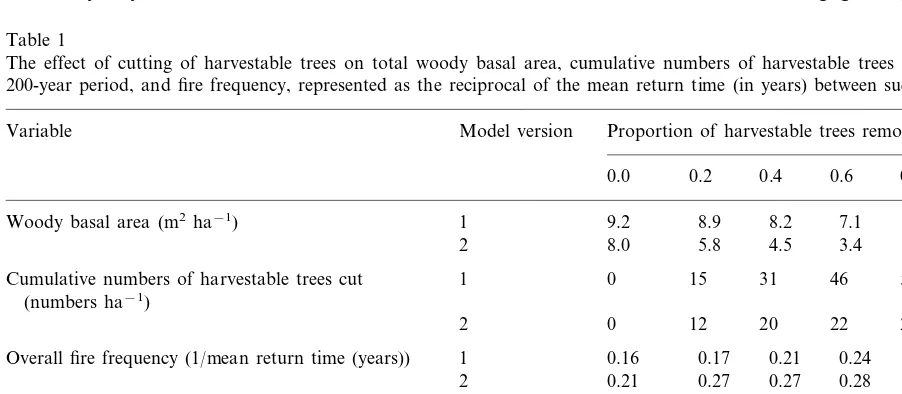
Table 1
The effect of cutting of harvestable trees on total woody basal area, cumulative numbers of harvestable trees removed over the 200-year period, and fire frequency, represented as the reciprocal of the mean return time (in years) between successive firesa
Variable Model version Proportion of harvestable trees removed
0.0 0.2 0.4 0.6 0.8 1.0
Cumulative numbers of harvestable trees cut 1 50
(numbers ha−1)
0
2 12 20 22 24 28
1
Overall fire frequency (1/mean return time (years)) 0.16 0.17 0.21 0.24 0.28 0.28 0.28
Frequency of ‘gulliver hot fires’ (1/mean return time 1 0.07 0.13 0.23 (years)) Frequency of woody plant hot fires (1/mean return
time (years))
2 0.06 0.17 0.19 0.23 0.24 0.24
Fig. 3. The mean grass biomass (kg ha−1) under different
cattle stocking rates and levels of tree removal. The mean values were calculated for the whole 200 years of the simula-tion. Results for (a) Version 1 and (b) Version 2 of the model are shown. The cutting cycle was set at 40 years.
by increasing grazing, has an impact on fire fre-quency and intensity (results above). The impact of changing fire frequency is shown in Table 3. Frequent fires negatively impact the woodland by reducing woody basal area and the densities of harvestable trees. Infrequent fires, on the other hand, promote the build up of smaller woody plants (‘bush encroachment’) that inhibit the tran-sition to harvestable trees. For Version 1 of the model, the optimum fire frequency for maximising
Fig. 4. Opening up of woodland canopy results in increased grass growth, greater fuel loads, and more frequent, hotter fires (a), leading to suppression of woody plant regrowth and lower biomass — the ‘fire trap’ (b). Heavy grazing by live-stock reduces the amount of fuel for fires, thereby lowering fire frequencies and intensities. Results from Version 1 of the model. ‘p h-trees removed’ refers to the proportion of har-vestable trees removed in each 40-year cutting cycle. raising stocking rates above 0.025 LU ha−1,
sub-stantially reduced fire frequencies and intensities and allowed more recruitment to the harvestable tree class. At higher grazing pressures, there was little difference between the two versions of the model in the number of harvestable trees removed (Fig. 6).
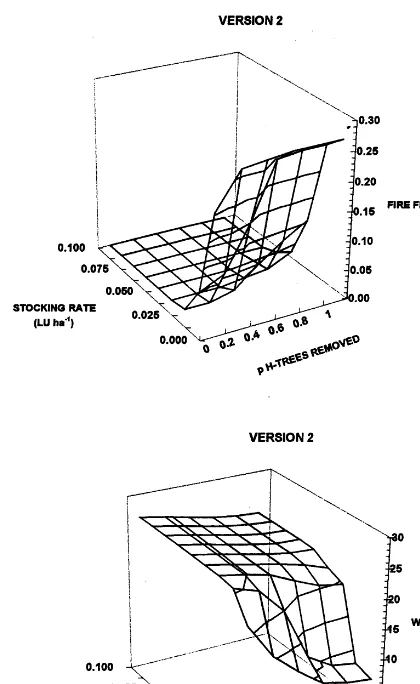
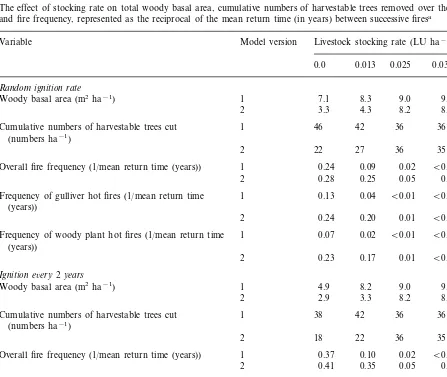
3.3. Impacts of fire on woodland structure
Fig. 5. Lower rates of woody plant growth (Model Version 2) intensifies the ‘fire trap’ under conditions of low levels of grazing and a high proportion of harvestable trees removed. Fire frequency is increased substantially (a), resulting in a marked reduction in woody biomass (b). ‘p h-trees removed’ refers to the proportion of harvestable trees removed in each 40-year cutting cycle.
specific conditions. For instance, when 25% of the grass was grazed annually, thereby suppressing fires and promoting bush encroachment, remov-ing gullivers slightly increased the cumulative numbers of large trees harvested, but cutting medium-sized trees or poles did not. The opti-mum annual rate of removal was about 5%, but this only increased the cumulative numbers of harvestable trees over a 200-year period from 42 to 47 trees ha−1.
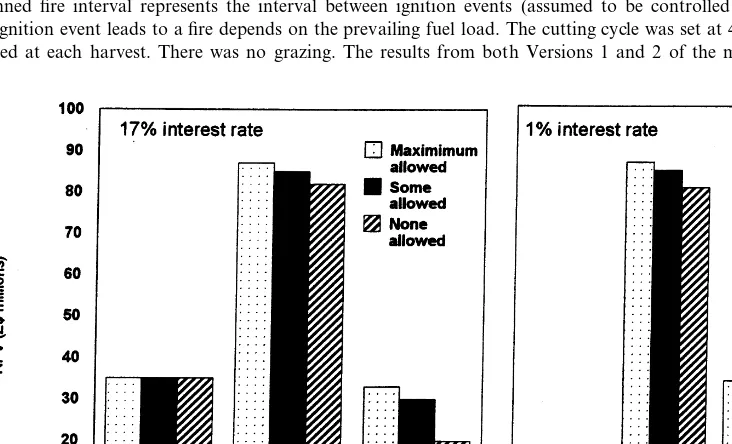
3.5. Some economic implications of managing the
woodlands
Although varying the grazing levels in the state forest can have major implications on both fire regimes and the regrowth of woodland, the eco-nomic impacts on the timber harvest were slight (Fig. 7). Thus the NPV of the woodland to the Forestry Commission remained constant under the different grazing regimes. In reality, the NPV to the Commission should decline as access to the woodland by cattle belonging to communal area residents is restricted, because of the increase in enforcement costs borne by the Commission (en-forcement costs were held constant in the model). For the communal area residents and forest dwellers the NPVs declined with decreasing ac-cess, as they lost the opportunity to graze their cattle in the state forest. This decline is greater for forest dwellers as they rely more on the state forest for grazing their cattle than do people in the communal areas.
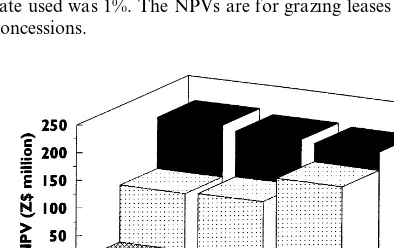
The NPV of the woodlands to the Forestry Commission under the contrasting scenarios of high- and reduced-impact logging were identical when cattle were allowed unlimited access to the state forest. When only a few cattle were present, the NPV (at a 1% discount rate) for low-impact logging was about 2 – 3% higher than that for high-impact logging, and slightly greater still when no cattle were allowed (Fig. 8). In these scenarios, the costs of timber harvesting were assumed to be the same for both high- and low-impact logging, but if the costs of timber extrac-tion are higher for low-impact logging, as seems likely, then this might cancel out the small gain in NPV.
harvestable trees is about one fire every 5 years, while in Version 2 the optimum was between 4 and 11 years.
3.4. Impact on har6estable trees of cutting smaller
size classes of woody plants
Thinning gullivers marginally increased the NPV of the woodland to the Forestry Commis-sion (3 – 4% increase), irrespective of cattle access to the state forest. The costs of thinning were not incorporated, however; these would probably off-set any benefits.
Varying both the proportion of harvestable timber trees cut and the cutting cycle showed that NPV to the Forestry Commission was highest
when trees were harvested at the maximum rate irrespective of the cutting cycle (Fig. 9). At lower rates of removal, NPV was highest for a 10-year cutting cycle; longer cutting cycles produced simi-lar NPVs. Harvesting at the maximum rate is not sustainable, however, as the woodland was con-verted to a bushland consisting almost entirely of gullivers after only four cutting cycles, even with a 50-year cutting cycle.
Table 2
The effect of stocking rate on total woody basal area, cumulative numbers of harvestable trees removed over the 200-year period, and fire frequency, represented as the reciprocal of the mean return time (in years) between successive firesa
Model version
Variable Livestock stocking rate (LU ha−1)
0.025 0.038 0.050
Cumulative numbers of harvestable trees cut 42 36 36
(numbers ha−1)
35
2 22 27 36 35
0.02 B0.01 B0.01 Overall fire frequency (1/mean return time (years)) 1 0.24 0.09
0.25
Frequency of gulliver hot fires (1/mean return time 1 0.04 B0.01 (years))
B0.01 B0.01
2 0.24 0.20 0.01
B0.01
Frequency of woody plant hot fires (1/mean return time 1 0.07 0.02 B0.01 B0.01 (years))
B0.01 B0.01
2 0.23 0.17 0.01
Ignition e6ery2years
9.0
Cumulative numbers of harvestable trees cut 36 36
(numbers ha−1)
35 35
2 18 22 36
0.10 0.02 B0.01 B0.01 Overall fire frequency (1/mean return time (years)) 1 0.37
2 0.41 0.35 0.05 0.01 B0.01 Frequency of gulliver hot fires (1/mean return time
(years))
0.29 0.01 B0.01 B0.01
2 0.33
0.20
1 B0.01
Frequency of woody plant hot fires (1/mean return time 0.03 B0.01 B0.01 (years))
aThe cutting cycle was set at 40 years, with 60% of trees being removed at each harvest. The results from both Versions 1 and
Fig. 6. The numbers of harvestable trees removed per hectare in 200 years at different harvesting intensities and levels of grazing under (a) assumed natural growth rates of woody plants (Version 1) and (b) slow growth rates (Version 2). ‘p h-trees removed’ refers to the proportion of harvestable trees removed in each 40-year cutting cycle.
which small trees cannot grow to the larger size classes and, eventually, to canopy trees where they could suppress grass production (Frost, 1996). The results of the modelling study broadly fit this scenario borne from field experience. The effect of harvesting trees on grass growth was not as marked as that expected from experimental re-search (Boultwood and Rodel, 1981; Dye and Spear, 1982; Chidumayo, 1993). In part, this is because in our model the removal of harvestable trees resulted in an increase in the number of medium-sized trees, poles and gullivers, which in turn negatively affected grass growth through shading. Moreover, as harvesting trees also in-creased the frequency of fires, potential fuel was less often carried over to subsequent years and the positive impact of harvesting on fuel loads was not so obvious.
There seems to be a relatively sharp transition between the outcome in which woody plants are trapped by frequent fires and that where they are able to revert to woodland. This is shown by the differences in the outputs from two versions of the model. With faster rates of woody plant growth (Version 1), the likelihood of being trapped was lower. In reality, this transition is likely to vary across the landscape in response to differences in fuel load as affected by soils, moisture, grazing, and the variable canopy cover of the woody plants themselves.
The fire trap is too often portrayed as a simple grass-and-gulliver dominated state. In logging op-erations only the large trees are removed, leaving numerous other smaller trees and saplings, apart from gullivers. These are often able to escape fire, making a uniform grass – gulliver state less likely. Our results showed that the fire trap generally occurred more frequently under a high-impact logging regime than when low impact logging was simulated. To counteract this effect would require additional fire protection measures. These would increase the cost of timber extraction and perhaps more than offset the likely added costs of practis-ing low-impact loggpractis-ing. This scenario remains to be explored.
The cattle stocking rate profoundly affected fire frequency and intensity. Intermediate stocking levels reduced fire frequencies, thereby enabling
4. Discussion
more harvestable trees to be cut. But when fire was completely removed, due to a lack of fuel caused by heavy grazing at high stocking rates,
the impact on the number of harvestable trees was negative. Increases in stocking rate to a point where the grass layer is overgrazed tend to lead to
Table 3
The effect of fire frequency on total woody basal area and the cumulative numbers of harvestable trees removed over a 200-year perioda
Variable Model version Planned fire interval (years)
2 4 8 16
8.6 7.6
4.9 8.7
1 Woody basal area (m2 ha−1)
2 2.9 3.6 6.0 8.4
1
Cumulative numbers of harvestable trees cut (numbers ha−1) 38 44 39 39
24 35 35
18 2
74 39
Number of fires in 200-year period 1 19 10
81 46 23
2 10
1
Incidence of ‘gulliver hot fires’ (% of all fires in 200-year period) 70.3 38.5 21.1 40.0 89.1 78.3 10.0 81.5
2
54.1 28.2
Incidence of ‘woody-plant hot fires’ (% of all fires in 200-year period) 1 10.5 10.0 75.3 87.0 69.6
2 0.0
20.0 10.5 5.1
Actual mean interval between fires (years) 1 2.7
2 2.5 4.3 8.7 20.0
aThe planned fire interval represents the interval between ignition events (assumed to be controlled by management), though
whether an ignition event leads to a fire depends on the prevailing fuel load. The cutting cycle was set at 40 years, with 60% of trees being removed at each harvest. There was no grazing. The results from both Versions 1 and 2 of the model are shown.
Fig. 8. The net present values (NPVs) for the Forestry Com-mission under different levels of access to the state forest for grazing, and under different impacts of logging. The discount rate used was 1%. The NPVs are for grazing leases and timber concessions.
be increased through thinning of gullivers only under very specific conditions. Given the costs of thinning, which were not taken into account in our simulations, the economic gains, if any, are likely to be negligible. Moreover, it is unlikely that managers would be able to assess precisely the appropriate numbers of gullivers to be re-moved in any one year, particularly given the wide year-to-year variations in rainfall, grass pro-duction, woody growth, and fire.
None of the management options that we simu-lated (managing grazing pressure, reducing the impact of logging and thinning the gullivers) had any significant impacts on the NPV of the wood-land, especially to the Forestry Commission. The underlying reasons are (1) the slow growth rates of the trees and (2) the relative paucity of har-vestable trees in the system. Limiting access to cattle in the state forest makes no economic sense; if anything, the value of the forest is higher when cattle are present, both in economic terms (NPVs were slightly higher) and ecologically (because of the reduction in the frequency of hot fires).
From the limited perspective of a logging com-pany the most economic approach to exploiting the timber would seem to be to cut as much as possible in a single cutting period. The tree growth rates are too slow to offset any discount rate used. But doing this, however, would rapidly destroy the woodland because frequent hot fires would further restrict regrowth and recruitment rates to the harvestable tree size class. Moreover, potential ecological service functions of the wood-land (carbon sequestration, climate regulation, hydrological control, biodiversity maintenance) were not taken into account in the calculations of these NPVs, neither have the benefits of other economic activities currently being pursued in these woodlands. In 1998, gross revenue from hunting and eco-tourism earned by the safari company run by the Forestry Commission ex-ceeded US$ 1.2 million (I. Bond, WWF Zim-babwe, pers. comm.). Management of the woodlands in relation to these values might well be more rewarding. Further development of the model, and consideration of a wider range of scenarios, is needed.
Fig. 9. The net present values (NPVs) for the Forestry Com-mission under different levels of cutting harvestable trees. The level of cutting is varied by changing the proportion of har-vestable trees removed and the cutting cycle. The discount rate was 1%. The NPVs are for grazing leases and timber conces-sions.
bush encroachment (Barnes, 1979), both because of reduced fire intensities and because the woody seedlings are able to out-compete grasses.
Acknowledgements
The Canadian International Development Agency is acknowledged for funding this initiative as part of the Agroforestry: Southern Africa pro-gramme. PGHF is supported by grant NAG5-6384 (Land-cover and Land-use Change in Miombo) from the US National Aeronautics and Space Administration through the University of Virginia. We thank Jack Putz, Claudia Romero and three anonymous reviewers for their critical but constructive comments on an earlier version of this paper.
References
Barnes, D.L., 1965. The effects of frequency of burning and mattocking on the control of coppice in the Marandellas sandveld. Rhodesia J. Agric. Res. 3, 55 – 56.
Barnes, D.L., 1979. Cattle ranching in the semi-arid savannas of East and Southern Africa. In: Walker, B.H. (Ed.), Management of Semi-arid Ecosystems. Elsevier, Amsterdam.
Bell, R.H.V., 1984. Notes on elephant – woodland interaction. In: Cumming, D.H.M., Jackson, P. (Eds.), Status and Conservation of Africa’s Elephants and Rhinos. IUCN, Gland.
Bond, W., van Wilgen, 1996. Fire and Plants. Chapman and Hall, London.
Boultwood, J.N., Rodel, M.G.W., 1981. Effects of stocking rate and burning frequency on Brachystegia/Julbernardia veld in Zimbabwe. Proc. Grassland Soc. South. Afr. 16, 111 – 115.
Campbell, B., Frost, P., Byron, N., 1996. Miombo woodlands and their use: overview and key issues. In: Campbell, B. (Ed.), The Miombo in Transition: Woodlands and Welfare in Africa. Centre for International Forestry Research, Bogor.
Campbell, B.M., Costanza, R., van den Belt, M., 2000a. Land use options in dry tropical woodland ecosystems in Zim-babwe: introduction, overview and synthesis. Ecol. Econ. 33, 341 – 351.
Campbell, B.M., Dore´, D, Luckert, M., Mukamuri, B., Gam-biza, J., 2000b. Economic comparisons of livestock pro-duction in communal grazing lands in Zimbabwe. Ecol. Econ. 33, 413 – 438.
Chidumayo, E., Gambiza, J., Grundy, I., 1996. Managing miombo woodland. In: Campbell, B. (Ed.), The Miombo
in Transition: Woodlands and Welfare in Africa. Centre for International Forestry Research, Bogor.
Chidumayo, E.N., 1988. A re-assessment of effects of fire on miombo regeneration in the Zambian copper belt. J. Trop. Ecol. 4, 361 – 372.
Chidumayo, E.N., 1993. Responses of Miombo to Harvesting: Ecology and Management. Stockholm Environment Insti-tute, Stockholm.
Dye, P.J., Spear, P.T., 1982. The effect of bush clearing and rainfall variability on grass yield and composition in south-west Zimbabwe. Zimbabwe J. Agric. Res. 20, 103 – 117. Frost, P.G.H., Robertson, F., 1987. The ecological effects of
fire in savannas. In: Walker, B.H. (Ed.), Determinants of Tropical Savannas. IRL, Oxford IUBS Monograph Series 3.
Frost, P.G.H., Medina, E., Menaut, J.-C., Solbrig, O., Swift, M.J., Walker, B.H., 1986. Responses of savannas to stress and disturbance. Biol. Int. 10, 1 – 82.
Frost, P.G.H., 1996. The ecology of miombo woodlands. In: Campbell, B. (Ed.), The Miombo in Transition: Wood-lands and Welfare in Africa. Centre for International Forestry Research, Bogor.
Grundy, I, Turpie, J., Jagger, P., Witkowski, E., Guambe, I., Semwayo, D., Solomon, A., 2000. Implications of co-man-agement for benefits from natural resources for rural households in north-western Zimbabwe. Ecol. Econ. 33, 369 – 381.
High Performance Systems, 1996. Stella and Stella Research Software. High Performance Systems, Inc. Hanover NH. Knoop, W.T., Walker, B.H., 1984. Interactions of woody and
herbaceous vegetation in two savanna communities at Nylsvley. J. Ecol. 73, 235 – 253.
Pearce, D., Markandya, A., Barbier, E.B., 1989. Blueprint for a Green Economy. Earthscan, London.
Robertson, E.F., 1984. Regrowth of two African woodland types after shifting cultivation. University of Aberdeen Ph.D. thesis.
Rushworth, J.E., 1975. The floristic, physiognomic and biomass structure of Kalahari sand vegetation in relation to fire and frost in Wankie National Park, Rhodesia. University of Rhodesia MSc thesis.
Rutherford, M.C., 1981. Annual plant production – precipita-tion relaprecipita-tions in arid and semi-arid regions. S. Afr. J. Sci. 76, 53 – 56.
Trapnell, C.G., 1959. Ecological results of woodland burning in Northern Rhodesia. J. Ecol. 47, 129 – 168.
Trollope, W.S.W., 1993. Fire regime of the Kruger National Park for the period 1980 – 92. Koedoe 36, 45 – 52. Tyson, P.D., 1986. Climatic Change and Variability in
South-ern Africa. Oxford University Press, London.
White, F., 1983. The vegatation of Africa. In: Natural Re-sources Research 20. UNESCO, Paris.