GEOSPATIAL TECHNOLOGY IN DISEASE MAPPING, E-SURVEILLANCE AND
HEALTH CARE FOR RURAL POPULATION IN SOUTH INDIA
Praveenkumar BA a ,*, Suresh Krishnamurthy b, Nikhil Agarwalc, Rohan Mahalankc, Nikhila B.Sc, Rohit C Katakolc, Srinivas A c
a Department of Community Medicine, PES Institute of Medical Sciences & Research, Kuppam-517425, Andhra Pradesh, India. [email protected]
b Department of General Medicine, PES Institute of Medical Sciences & Research, Kuppam-517425, Andhra Pradesh, India. [email protected]
c Department of Computer Science, PES Institute of Technology, Bangalore-560085, India [email protected]
ISPRS WG VIII/2: Health
KEY WORDS: Health care, GIS, Data mining, Visualization, Risk analysis, ICT.
ABSTRACT:
Providing Healthcare to rural population has been a challenge to the medical service providers especially in developing countries. For this to be effective, scalable and sustainable, certain strategic decisions have to be taken during the planning phase. Also, there is a big gap between the services available and the availability of doctors and medical resources in rural areas. Use of Information Technology can aid this deficiency to a good extent. In this paper, a mobile application has been developed to gather data from the field. A cloud based interface has been developed to store the data in the cloud for effective usage and management of the data. A decision tree based solution developed in this paper helps in diagnosing a patient based on his health parameters. Interactive geo-spatial maps have been developed to provide effective data visualization facility. This will help both the user community as well as decision makers to carry out long term strategy planning.
1. INTRODUCTION
The challenge that exists today in many countries is to reach the whole population with adequate health care services and to ensure their timely utilization. In India, healthcare follows a three tier system – primary health centre catering to a group of villages, secondary level health centres located at district level and medical college/hospitals constitute the tertiary level located in big cities. A developing country such as India has large population with huge inequality in health care distribution. A significant population of India is rural. While the urban population is very privileged in enjoying a high quality of medical services abundantly available in cities and major towns, the remotely located rural population is deprived of very basic medical services. [1]
Cardiovascular diseases (CVD) comprise of a group of diseases of the heart and vascular system namely coronary heart disease, hypertension, stoke, etc. Cardiovascular diseases continue to be the leading cause of morbidity and mortality worldwide. Risk factors include age, gender, ethnicity, blood pressure, smoking, lack of physical activity, obesity, cholesterol and diabetes. An alarming cause of concern is the relatively early age of CVD deaths in developing countries. Ironically CVDs are now on decline in industrialised countries. The decline is largely a result of the success of primary care and prevention. The middle and low income countries are at the mid-point of the emerging epidemic and will face its full impact in the coming years. These countries can be benefitted from the strategy of primary prevention. [2-3]
In India, it is estimated that there were approximately 29.8 million patients with cardiovascular disease in 2003. An estimated 1.5 million people die of CVD every year. WHO has projected that by the year 2030, CVD will emerge as the main cause of death (36%) in India and majority of these deaths are premature. Disease risk prediction plays an important role in the
primary prevention of cardiovascular disease, hypertension and diabetes. At least 25 % of the coronary patients die suddenly without any prior symptoms. Hence risk prediction, primary health care, prevention and management of these inter related diseases is critically important. [4-5]
Geospatial technology has provided the field of public health and particularly epidemiology with an important tool for visualizing disease burden spatially and making analysis possible that was once technologically out of reach. Taking into account India‟s huge strides in the field of information and communication technology, there is an urgent need for developing technology assisted strategies that help in planning for a suitable model that aids in capturing a wide variety of patient data and to develop an automated cloud based technique for systematically storing and managing the data. The generic model so developed is meant to facilitate the decision makers to derive strategies from the managed data and incorporate the same in providing location based health services, allocation of funds to meet the required needs and monitor the progress as an ongoing activity.
2. RELATED WORK
While well proven data gathering and cloud management systems do exist, many researchers are focussing their efforts on the geo-mapping and data visualization, especially in the domain of healthcare. Sopan and Song-Le Noh [6] propose a community health map application that facilitates analysis of health data via visualization tools in multivariable space as well as in geo-spatial mode. The depiction of results via interactive maps helps in the relative characterization of variables, thus helping policy makers to take informed decisions. The authors in [7] propose a web based community health map application that enables visual analysis of health data.
In the work carried out in [8], visual mapping is carried out to address FIVE w‟s (information elements: who, when, what, where and why) needed to narrate a context. It organizes information in a structured manner and identifies suitable visual encodings for the data and the information thus obtained has been integrated into hospital workflow. A novel web based visualization system (termed MGA: Medical Graphical Avatar) to deliver a variety of medical data types including medical images such as X-Ray, MRI, PET-CT has been developed in [7]. The mapping information on the Regions of Interest [ROI‟s] and focused body parts are extracted and the results are presented visually. The authors in [9] use a GIS based pattern of the overall healthcare system and the patients‟ travel to the health centre as key Factors in designing the location and sizing of a Neonatal Intensive Care Unit (NICU) within a network of rural hospitals. The use of a Spatial Data Mining Tool in the knowledge discovery phase has been well demonstrated by this research.
As a typical example of the Community Healthcare activity, Qureshi et al device a system called “Jaroka Tele-Healthcare system [JTHS]” where simple mobile SMS messages via phones are employed by primary health workers who register and report symptoms of diseases [10]. The system developed is used for further diagnosis and follow-up activity. The system facilitates the status check of over 20,000 patients by the click of a button, via visualization tools. The novelty of the scheme is the use of crowd sourcing to register patients and track the spread of diseases.
3. DATA AND DESIGN
The work proposed in this paper aims to develop a cloud based data management and decision support system. An integrated mobile APP is developed that is meant to capture the detailed data set pertaining to three commonly occurring diseases namely, Cardio-vascular disease, Hypertension and Diabetes. The data set obtained through a community health project conducted in the rural town of Kuppam, Andhra Pradesh, South India is used for the development and prototyping purposes. The user interface on the Mobile has multi tabs to capture all the data without having to adhere to a conventional manual way of form-based data capture. Once the data is captured, connectivity is established to transfer the data directly to the cloud in an organized way, in real time. The data can be shared to any authorized agencies at multiple levels for retrieval and analysis. The Data visualization consists of an interactive Geo-map that has the feature of check boxes where the user can select any combination of options to overlay the information of interest on the geographical map of the Kuppam region of Andhra Pradesh. The inferencing mechanism as regards the diagnosis of the cardio-vascular disease is carried out by the Decision Tree. Any information of interest can be visually depicted by the geo-maps.
The functional block diagram of the proposed system is shown in Fig. 1. The system is composed of the following subsystems:
3.1 Data Gathering
An Android Mobile Application has been developed to systematically gather the population data. The application has a local database using the SQLite. This database stores the data in the device corresponding to a set of the target population as standard tables. The application also registers the Geo-spatial location of the patient which will later be used for interactive
maps and data visualization. Once a sufficiently sizable data has been stored in the device, the data can be transferred to the support system model (trained by a larger population data) that carries out inferencing on classifying the patient as “Confirmed Cardiovascular Disease Case”, “Risk CVD Case” and “No Risk Case”. Presently, a Decision Tree based inferencing is deployed.
3.3 Interactive Maps and Data Visualization
The data from the cloud is retried by a Mobile device/Web and interactive Maps are designed and developed to depict a particular scenario of interest. The system has a feature to use “Check Boxes” to choose the parameter(s) of interest in any combination and overlay the results as a “Heat Map” on the terrain map. Presently, the following patient conditions can be chosen for check boxes on the Heat Map:
Cardiovascular Disease (CVD)
4. RESULTS AND DISCUSSION
The generic system model illustrated in Section 3 has been applied to a chosen population as a case study. PES Institute of Medical Sciences and Research (PESIMSR) is situated in Kuppam, a rural town in the state of Andhra Pradesh in South India. PESIMSR had a sponsored project termed “CBHTN&D“ that involved systematically collecting health related data pertaining to a chosen rural population group in Kuppam. The Health Workers were designated to visit a set of chosen locations and gather the data manually. This data set has been chosen to validate the generic model explained in Section 3. The data set consists of a total population of 2844. This was a general population study and the data was composed of 1070 cases with disease symptoms and 24 confirmed CVD cases.
4.1 Android Application
The data set comprises 47 parameters. The prime parameters in the Android database are as indicated in Table 1.
Table 1:
Age Gender Weight Height
BMI LDL HDL BP
HTN HTN Aware HTN Therapy Religion
Occupation Education Lipids Hyperlipidemia
Diabetes Mellitus (DM)
DM Aware DM Therapy Claudication
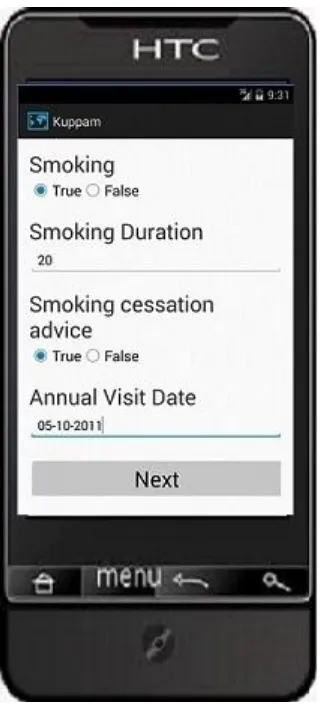
Sample snapshots of the mobile application are provided in Figs. 2 and 3.
Figure 2: Mobile Application: Snapshot-1
Figure 3: Mobile Application: Snapshot-2
The application has been so developed that, the Geo-location automatically gets registered in the database corresponding to the latitude and longitude of the patient‟s location using GPS sensors in the mobile device. This will be later used for Geo-mapping and Visualization.
4.2 Intelligent Inferencing
In the current version of the system, the Decision Tree technique of classifying a given patient data to any of the three classes as explained in Section 3 has been employed. When a patient specific data is keyed in to the mobile application in a device from any location, the query will be sent to the trained model in the cloud server and the class to which the patient belongs to, is made available on the mobile device. Fig. 4 shows a sample decision tree for a chosen patient data.
Figure 4: Sample Decision Tree
The path shown by shaded boxes indicates the path that the decision tree has followed, to arrive at the decision that the patient belongs to the High Risk CVD class.
4.3 Geo-Spatial Mapping and Visualization
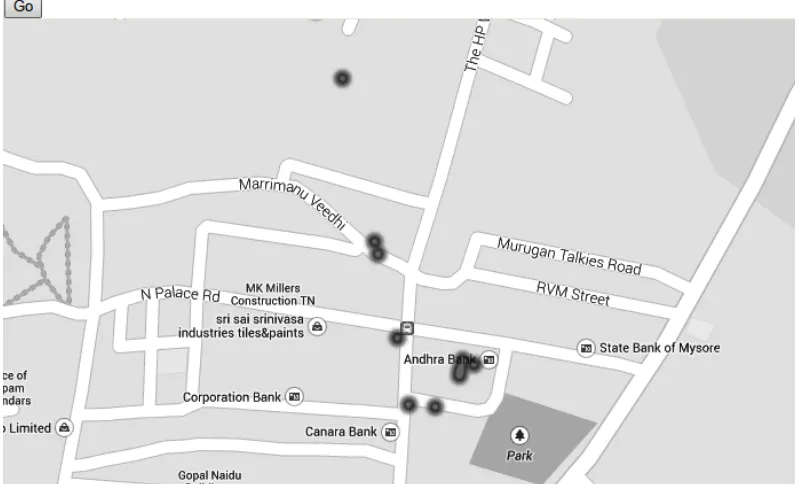
As explained in Section 3, the data visualization comprises firstly of representing the Geographical map of Kuppam town on the mobile device. There is also provision for viewing exactly the same details on a web application. Figs.5 & 6 illustrate one scenario of the visualization output.
In one scenario shown in Fig.5, the map of Kuppam district has been shown. The heat map for this scenario uses the choice of parameters for visualization are „HTN‟, „DM‟ and „Female‟ as shown in the tick boxes on the top of the map. The locations shown by darker shade of the gray areas indicate that the occurrence of HTN and DM for in female population. The lightly shaded regions represent the female population affected by the DM and HTN and the occurrence of the diseases is less.
Figure 5: Data Visualization: Scenario 1
Figure 6: Data Visualization: Scenario 2
In Fig.6, the heat map provides a scenario where the CVD confirmed cases are depicted for both male and female population. It may be noted here that only 42 cases of CVD occur in the total data of 2742. More quantitative inferences can be arrived at, if we have a larger data set with a wider distribution of the choice parameters. Again, this case study has been carried out to illustrate the usefulness of the visual depictions of the maps for arriving at some key inferences but is only illustrative. An exhaustive data would bring out many qualitative inferences which can be largely used for strategy planning.
5. CONCLUSIONS AND FUTURE DIRECTION
A generic model for Healthcare data gathering, geo-mapping and data visualization has been proposed and developed in this paper. The Android application is integrated with the cloud so that the data set available on the cloud can be viewed and made use of from any location. A decision tree based inferencing model takes input from a mobile device about a chosen set of patient parameters and gives out the decision on the occurrence of the Cardio Vascular Disease for the patient. The heat maps developed on the mobile device/web application use a set of user selections to overlay the choice parameters, using the geo-spatial GPS coordinates gathered from the mobile device during the data gathering phase. The heat maps can be largely used for arriving at certain conclusive results such as disease occurrence, disease progressions, causes of diseases, disease surveillance, hospital availability for the population density etc.
Work is underway to design and develop other intelligent inferencing techniques such as the Baysian model, Association rules etc. Future work will also focus on coming up with more involved interactive maps.
ACKNOWLEDGEMENTS
The authors wish to thank the management of PES Institutions for providing the infrastructure and research ambiance to carry out this work.
6. REFERENCES
[1] Praveen Kumar BA, Ali SS. Telemedicine in primary health care: The road ahead. Int J Prev Med.2013;4:377-8.
[2] WHO. Global status report on non-communicable diseases 2010. Geneva: World Health Organization; 2010.
[3] Park K. Park‟s text book of preventive and social medicine, 22 nd edn. Jabalpur: Banarsidas Bhanot; 2013. p. 334-349.
[4] Sharvanan EU, Konduru RK, BA PK, VS, TS. Study of cardiovascular risk factors among transport drivers in rural area of Andhra Pradesh. Int J Res Health Sci [Internet]. 2014
Jan31;2(1):420-6. Available from
http://www.ijrhs.com/issues.php?val=Volume2&iss=Issue1
[5] Bhanu Priya, Shruthi Nadig, Saloni Maru, Srinivas.A, Nitish Shangari, Abhishek Biswas, Suresh Krishna Murthy, “Development of an Integrated Risk Assessment Platform for the management of Cardiovascular Diseases, Diabetes and Hypertension”, International Conference on Health Informatics(HEALTHINF 2011), Rome, Italy, January 2011.
[6] Awalin Sopan, Angela Song-Le Noh, Ginnah Lee, Paul Rosenfeld, Sonit Karol, Ben Shneiderman, “Community Health
Map: A Geospatial and Multivariate Data Visualization Tool for Public Data Sets”, Government Information Quarterly 29 (2), Apr 1 2012, p 223-234.
[7] Michael de Ridder, Liviu Constantinescu, Lei Bi, Youn Hyun Jung, Ashnil Kumar, Jinman Kim, David Dagan Feng, Michael Fulham, “A Web-Based Medical Multimedia Visualisation Interface for Personal Health Records”, IEEE-EMBS International Conference on Biomedical and Health Informatics (BHI), 2014
[8] Zhiyuan Zhang, Student Member, IEEE, Bing Wang, Faisal Ahmed, I.V. Ramakrishnan, Rong Zhao, Asa Viccellio, and Klaus Mueller, “The Five Ws for Information Visualization with Application to Healthcare Informatics, IEEE Transactions on Visualization and Computer Graphics, Vol. 19, No.. 11, Novemver 2013.
[9] Noon, C.E., Hankins, C.T. , “Spatial data visualization in healthcare: supporting a facility location decision via GIS-based market analysis”, Proceedings of the 34th Annual Hawaii International Conference on System Sciences, January 2001.
[10] Qureshi, H, .Keyani, S, Babar Q, Mumtaz, A.A, “Monitoring Disease Outbreak through Geographical Representation in Rural Areas”, Developments in E-systems Engineering (DeSE), December 2011.