A MAN-PORTABLE, IMU-FREE MOBILE MAPPING SYSTEM
Andreas N¨uchter∗
, Dorit Borrmann∗
, Philipp Koch+, Markus K¨uhn+, Stefan May+
∗
Informatics VII – Robotics and Telematics Julius-Maximilians University W¨urzburg, Germany
+Faculty of Electrical Engineering, Precision Engineering, Information Technology Nuremberg Institute of Technology Georg Simon Ohm, Germany
Commission III WG III/2
KEY WORDS:man-portable mapping, scanning backpack, signed distance function, SLAM, scan matching
ABSTRACT:
Mobile mapping systems are commonly mounted on cars, ships and robots. The data is directly geo-referenced using GPS data and expensive IMU (inertial measurement systems). Driven by the need for flexible, indoor mapping systems we present an inexpensive mobile mapping solution that can be mounted on a backpack. It combines a horizontally mounted 2D profiler with a constantly spinning 3D laser scanner. The initial system featuring a low-cost MEMS IMU was revealed and demonstrated atMoLaS: Technology Workshop Mobile Laser Scanning at Fraunhofer IPMin Freiburg in November 2014. In this paper, we present an IMU-free solution.
1. INTRODUCTION
As there is a tremendous need for fast, reliable, and cost-effective indoor mapping systems, we designed a man-portable mapping system, which does not need an IMU (intertial measurement unit) nor an external positioning system. Current state-of-the-art robotic solutions (N¨uchter et al., 2013) or systems where scanners are mounted on carts, like the viametris iMMS (VIAmetris, 2015; Thomson et al., 2013), are not suitable for a large number of ap-plications, as closed doors in front of the carts and doorsteps may preclude their application. A backpack mounted system, also known as personal laser scanning, is the ideal solution to
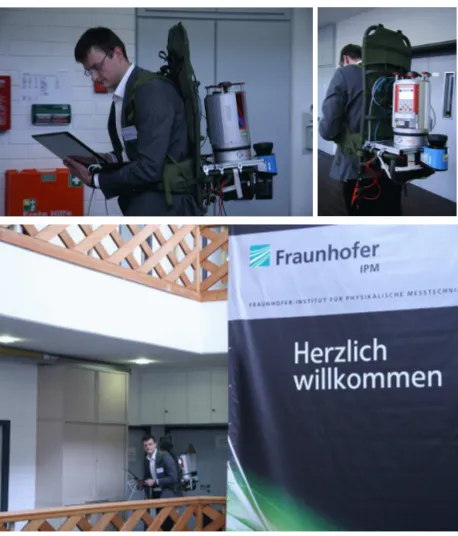
over-Figure 1. Photos of the first author operating the backpack system at MoLAS, in Freiburg, November 2014.
come these issues as the user has his hands free to open doors.
Recently, Google unveiled “The Cartographer, Its Indoor Map-ping Backpack” for similar use cases (Frederic Lardinois, TC, 2015). While they rely on Hokuyo laser scanners similar to the Zebedee system (CSIRO, 2015), which are inexpensive devices with low data rate, accuracy and range, the here presented solu-tion features a high-end laser scanner, namely a Riegl VZ-400, for mapping. A professional laser scanner is used by Kukko et al. (2012) in a conventional setting employing GPS (Global Posi-tioning System) and IMU sensors.
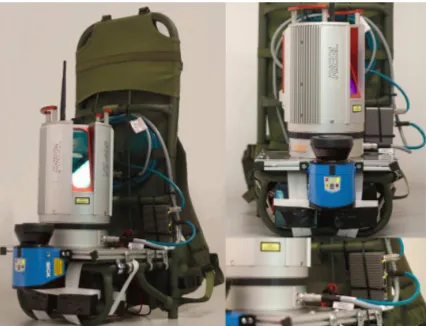
The backpacking system is inspired by the robotic system Irma3D (N¨uchter et al., 2013) but the basis is now a Tatonka load carrier. Similar to the Volksbot RT 3 chassis aluminium components and system solutions for building fixtures have been attached to the load carrier using pipe clamps. Energy is currently provided by two Panasonic 12 V lead-acid batteries with 12 Ah, but to save weight, these will be replaced by lithium polymer batteries. Sim-ilar to Irma3D (N¨uchter et al., 2013), the backpack features a horizontally scanning SICK LMS 100, which is used to observe the motion of the carrier using a 2D mapping variant based on the signed distance function. The central sensor of the backpack sys-tem is the 3D laser scanner Riegl VZ-400. The VZ-400 is able to freely rotate around its vertical axis to acquire 3D scans. Due to the setup, however, there is an occlusion of about100◦
from the backside of the backpack and the human carrier. The backpack is also equipped with a network switch to receive the data from the two scanners and to connect the 12”-laptop (Samsung Q45 Aura laptop with an Intel Core 2 Duo T7100 processor), which is carried by the human.
Figure 2. Images of the backpack system. Left: Side view with all of its sensors and equipment. Right: Detailed view of the SICK and the switch.
SLAM deforms the trajectory of the backpack in 6 DoF such that the 3D point cloud aligns well.
The system is ready to use and this paper presents results obtained with data acquired during a presentation atMoLaS: Technology Workshop Mobile Laser Scanning at Fraunhofer IPMin Freiburg, Germany in November 2014, cf. Fig. 1. The Fraunhofer Insti-tute for Physical Measurement Techniques IPM develops mea-suring techniques and systems for industry and laser scanning, especially mobile laser scanning is of core interest. Through-out the paper, we will present results obtained from this dataset. It features the atrium of the institute where data has been ac-quired on a round trip in the first floor. A previous version of the system was presented in (N¨uchter et al., 2015, , accepted). There, however, we relied on a 2D mapping algorithm called HectorSLAM (Kohlbrecher et al., 2011) and required a low-cost MEMS (microelectromechanical systems) IMU. Previously we also published an analysy of the occuring scan patterns of the backpack system (Elseberg et al., 2013b).
2. SYSTEM ARCHITECTURE
Figure 3 presents the overall architecture of the backpack. For sensor data acquisition we exploit ROS, the so-called robotic op-erating system (Quigley et al., 2009) which is a middleware for Linux operating systems. ROS is a set of software libraries and tools that are used in the robotic community to build robot ap-plications. As a middleware, it connects device drivers, grams and tools on a heterogeneous computer cluster. ROS pro-vides standard operating system services such as hardware ab-straction, low-level device control, implementation of commonly used functionality, message-passing between processes, and pack-age manpack-agement. It enables time-stamped sensor data logging
2D LIDAR
2D scans initial planar trajectory
rxp data Unwinding
Robotic Operating System autonohm / obvisouly library Extention of 3DTK − The 3D Toolkit 2D map viewer (rviz)
online
offline
6 DoF trajectory
Figure 3. Overall system architecture. The ROS nodes can run online, i.e., during data acquisition, while the map optimization is executed afterwards.
and the control of the devices. Programs are run as indepen-dent processes as so-called ROS nodes. The data of the 2D Li-DAR (Light detection and ranging) is fed into the 2D SLAM subsystem, available in the autonohm/obviously library (Mobile Robotics Lab at TH Nueremberg, 2015), which is described in the following section. It is also implemented as ROS node. The out-put of this 2D SLAM ROS node serves as inout-put of the six degree of freedom (6 DoF) semi-rigid SLAM, which registers the 3D data from the Riegl VZ-400 and is implemented using the frame-work 3DTK — The 3D Toolkit(Andreas N¨uchter et al., 2011). Since we calculate in this second step truely with 6 DoF, it is not critical, that the horizontal scanner data is used in a 2D SLAM approach first. Since, the horizontal scanner operates with 25 Hz, we neglect the motion between two 3D scans.
The 2D map can be viewed during data acquisition by using the default viewer of ROS, i.e.,rviz. This enabled the operator to detect failures and unmapped areas early. Screenshots of the gen-eration of the 2D map from the MoLAS scenario are given in Figure 4.
3. 2D MAPPING BASED ON SIGNED DISTANCE
FUNCTIONS
For conciseness we explain the 2D mapping framework in this section which is applied to the profiles acquired by the horizon-tally mounted scanner to build a representation based on Signed Distance Functions (SDF). In a previous publication, we gener-alized the KinectFusion approach (Izadi et al., 2011) to make it applicable to different types of sensors, i.e., 2D and 3D laser scan-ners, Time-of-Flight and stereo cameras or structured light sen-sors (May et al., 2014). Further work has focused on 2D SLAM, involving the integration into a ROS based framework as well as extending the algorithm to multi-source cooperative mapping (Koch et al., 2015).
The 2D SLAM framework is a grid based mapping approach that applies a main loop which is triggered by new sensor data and consists of three steps. The map consists of a grid containing Truncated Signed Distances (TSD) similar to the KinectFusion approach (Izadi et al., 2011), i.e., each cell holds the distance to the closest obstacle. We call this representation TSD grid in the remainder. The first step reconstructs a modelM={mi|i=
1, . . . , nM}consisting ofnM points, in the 2D case defined as
mi= (xi, yi)T from the current map. This virtual sensor frame
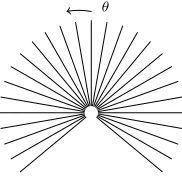
is generated by applying ray-casters from the last known position using the physical parameters of the input device (see Fig. 5).
Step two uses this data as a model for scan matching with the current sensor data, the sceneD={di|i= 1, . . . , nD}, with
nDas the number of sensor measurements in the newly acquired
data, containing coordinatesdi= (xi, yi)T. This is done in two
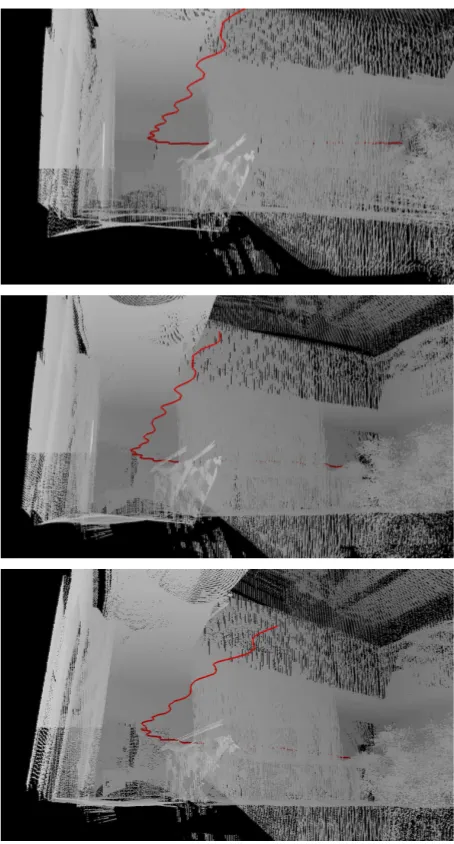
Figure 4. Eight frames showing the 2D map created in the MoLAS scenario (cf. Fig. 1). The red line denotes the trajectory. The superimposed grid has a size of10×10m2
.
• A pre-registration step aligns both scans roughly using the Random Sample and Consensus (RANSAC) paradigm by Fis-chler and Bolles (1981). Therefore the algorithm picks two model points and searches for point pairs with similar dis-tances in the scene. This search is done in a brute force manner. For each matching pair, the transformation between the model point pair and the scene point pair is calculated. Afterwards this transformation is applied to the scene scan. The applied transformation is rated using the overall square error between both scans and the number of inliers. In this case inliers are defined as scene points with a corresponding model point within a maximal range, e.g. within 0.1 m. These steps are iterated multiple times and the best trans-formation over all iterations is saved. Accordingly the al-gorithms yields good estimates for a high number of inliers and a small square error between the scans. For the exper-iments the algorithm uses the best transformation after 50 iterations. Actually the number of iterations should be set according to a desirable probability for finding a good esti-mate. Anyway 50 iterations led to good estimates for scans with up to 271 points.
Each iteration of the algorithm evaluates a random sample of the model. Accordingly the actual algorithm has no itera-tive character like an Iteraitera-tive Closest Point (ICP) algorithm for example. This increases the robustness of the scan align-ment as it is not likely that the algorithm converges into the wrong local minimum. Accordingly the pre-registration es-pecially helps to align scans with bigger offsets where an ICP algorithm tends to fail. This is an advantage in the backpacking scenario as the human should not care about moving slowly.
Furthermore, performance issues due to the brute-force search are overcome by several measures: First, the scans are sub-sampled by only picking up to every fourth point. Second, possible rotational and translational parameters are limited between two scans. This offers the possibility to determine wrong estimations quickly. Finally, points are ignored, if they originate from non-overlapping areas with the given es-timate.
• The ICP algorithm introduced by Zhang (1994) and Chen and Medioni (1991) is deployed on the roughly aligned scans
θ
Figure 5. Ray-casting model for the 2D profiler.
to refine the estimate of the pre-registration.
The application of this two stage approach helps us to overcome the drawbacks of each algorithm. The ICP algorithm performs poorly for large rotational errors between scans. In comparison the pre-registration step is robust against large pose changes but has a lower accuracy. After both steps, the sensor pose, denoted as3×3transformation matrixTi, is updated with the incremental
pose changeT∗
i from time stepi−1toi. The third step uses the
current pose and sensor data to update the representation. This is explained in detail in the following.
Reconstruction. The representation based on SDF has the char-acteristic, that ray-casting can be employed to generate scans from arbitrary points of view. The reconstruction from the TSD grid at a certain point of view entails information of all integrated scans so far and features reduced noise. The sensor model for the ray-caster defines a set of vectors, i.e., the line of sight of each laser beam, cf. Fig. 5.
reconstruction, but we correct the error by interpolation with the neighboring cells. The resulting coordinates are used to fill in a point cloud, resulting in a virtual data frame guaranteeing a high amount of similarity to the real input point cloud.
Data Integration. The representation as a TSD grid has several benefits but contains also pitfalls. For instance, on the contrary to a Cartesian voxel based approach, the map building is diffi-cult and calculation resource consuming. This results from the characteristics of the SDF generation.
The SDF is calculated for every grid cell visible by the sensor, wherefore the first step is back projecting the cell centroidsV= {vi |i = 1, . . . , nv}, i.e., assigning a certain laser beam. As
these coordinates are in the world coordinate system, they need to be registered to the sensor coordinate system as follows:
V∗
=T−1
i V (1)
The centroidsv∗
i are assigned to laser beams as follows:
αi= arctan
whereαiis the beam’s polar angle,iithe assigned beam index
andrthe sensor’s angular resolution.
4. 3D MAPPING
3D mobile mapping with constantly spinning scanners has been studied in the past by the authors, thus we summarize our work from (Borrmann et al., 2008) and (Elseberg et al., 2013a). The software is suited to turn laser range data acquired with a rotating scanner while the acquisition system is in motion into precise, globally consistent 3D point clouds.
4.1 Calibration
Calibration is the process of estimating the parameters of a sys-tem. We need to estimate the extrinsic parameters, i.e., the 3 DoF attitude and 3 DoF position of the two laser scanners with respect to some base frame. Up to now, we worked in the SOCS (scanner own coordinate system) of the SICK scanner. We use the ROS packagetf(the transform library), that lets us keep track of mul-tiple coordinate frames over time. tfmaintains the relationship between coordinate frames in a tree structure buffered in time, and allows transforming points, vectors, etc. between any two coordinate frames at any desired point in time.
In (Elseberg et al., 2013a) we presented a general method for the calibration problem, where the 3D point cloud represents sam-ples from a probability density function. We treated the ”‘un-wind”’ process as a function where the calibration parameters are the unknown variables and used the Reny entropy, computed on closest points regarding a timing threshold, as point cloud quality criterion. Since computing derivatives of such an optimization is not possible, we employ Powell’s method, which minimizes the function by a bi-directional search along each search vector, in turn and therefore resembles a gradient descent. This optimiza-tion usually takes about 20 minutes on a standard platform but needs to be done only once for a new setup.
4.2 6D SLAM
For our backpack system, we need a semi-rigid SLAM solution, which is explained in the next section. To understand the basic idea, we summarize its basis, 6D SLAM.
6D SLAM works similarly to the the well-known iterative clos-est points (ICP) algorithm, which minimizes the following error function Dare given by minimal distance, i.e.,miis the closest point to
diwithin a close limit (Besl and McKay, 1992). Instead of the two-scan-Eq. (4), we look at then-scan case:
E=X
j→k
X
i
|Rjmi+tj−(Rkdi+tk)|2, (5)
wherejandkrefer to scans of the SLAM graph, i.e., to the graph modelling the pose constraints in SLAM or bundle adjustment. If they overlap, i.e., closest points are available, then the point pairs for the link are included in the minimization. We solve for all poses at the same time and iterate like in the original ICP. The derivation of a GraphSLAM method using a Mahalanobis distance that describes the global error of all the poses
W =X
j,k is the linearized error metric and the Gaussian
dis-tribution is( ¯Ej,k,Cj,k) with computed covariances from scan
matching as given in (Borrmann et al., 2008) does not lead to dif-ferent results (N¨uchter et al., 2010). Please note, while there are four closed-form solutions for the original ICP Eq. (4), lineariza-tion of the rotalineariza-tion in Eq. (5) or (6) is always required.
4.3 Semi-rigid SLAM
In addition to the calibration algorithm, we also developed an algorithm that improves the entire trajectory of the backpack si-multaneously. The algorithm is adopted from (Elseberg et al., 2013a), where it was used in a different mobile mapping con-text, i.e., on wheeled platforms. Unlike other state of the art al-gorithms, like (Stoyanov and Lilienthal, 2009) and (Bosse and Zlot, 2009), it is not restricted to purely local improvements. We make no rigidity assumptions, except for the computation of the point correspondences. We require no explicit motion model of a vehicle for instance. The semi-rigid SLAM for trajectory opti-mization works in 6 DoF, which implies that the planar trajectory generated by TSD SLAM is turned into poses with 6 DoF. The algorithm requires no high-level feature computation, i.e., we re-quire only the points themselves.
is used, single 2D scan slices or single points result that do not constrain a 6 DoF pose sufficiently for rigid algorithms.
Mathematical details of our algorithm are given in (Elseberg et al., 2013a). Essentially, we first split the trajectory into sec-tions, and match these sections using the automatic high-precise registration of terrestrial 3D scans, i.e., globally consistent scan matching (Borrmann et al., 2008). Here the graph is estimated using a heuristics that measures the overlap of sections using the number of closest point pairs. After applying globally consistent scan matching on the sections the actual semi-rigid matching as described in (Elseberg et al., 2013a) is applied, using the results of the rigid optimization as starting values to compute the numer-ical minimum of the underlying least square problem. To speed up the calculations, we make use of the sparse Cholesky decom-position by (Davis, 2005).
A key issue in semi-rigid SLAM is the search for closest point pairs. We use an octree and a multi-core implementation using OpenMP to solve this task efficiently. A time-threshold for the point pairs is used, i.e., we match only to points, if they were recorded at leasttdtime steps away. This time corresponds to the
rotation time of the Riegl scanner, i.e., it is set to 6 sec. In ad-dition, we use a maximal allowed point-to-point-distance which has been set to 0.25 cm.
Semi-rigid SLAM transforms all points; points in a scanline via interpolation over the time-stamps. Finally, all scan slices are joined in a single point cloud to enable efficient viewing of the scene. The first frame, i.e., the first 3D scan slice from the Riegl scanner defines the arbitrary reference coordinate system. By us-ing known landmarks, the acquired point cloud can be transferred into the building coordinate system.
4.4 Constraining SLAM
Inspired by the work of (Triebel and Burgard, 2005) and to ac-celerate the solution of the semi-rigid SLAM solution, we con-strain the problem. As the operator walks on a planar surface, we add a horizontal plane below the scanner, resembling the ground roughly. This point cloud is pushed into the framework as0th
scan. Consequently, semi-rigid SLAM adds automatically a SLAM graph edge from every node to this plane and finds closest point pairs. This yields a slight constraint and guides the optimization.
5. EXPERIMENTS, RESULTS, AND DISCUSSION
The backpack has been presented and demonstrated atMoLaS: Technology Workshop Mobile Laser Scanning at Fraunhofer IPM in Freiburg, Germany. A data set has been acquired in the hallway in the Fraunhofer institute (see Figure 1). The Riegl VZ-400 was rotating around the vertical axis back and forth to avoid the blind spot. The data was acquired in 185 seconds. In this time, 19350 vertical scan slices have been acquired by the Riegl scanner and are extracted from the corresponding.rxp-file.
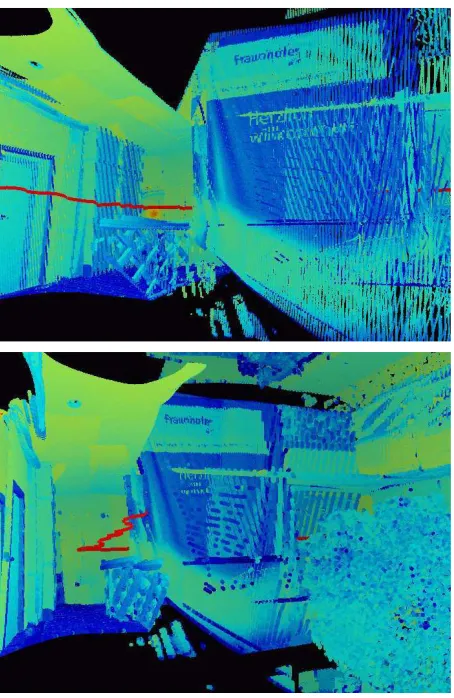
The result of TSD SLAM was already given in Figure 4. As it is a consistent 2D map, it serves as an input for “unwinding” the Riegl data yielding an initial 3D point cloud. The top of Figure 6 shows a part of the point cloud prior to the semi-rigid SLAM, i.e., directly after unwinding it, below are the corresponding views af-ter the optimization. The middle part gives an inaf-termediate result, while the final optimization result is given in the bottom part. The interior quality of the point cloud improves, which can be seen at the floor of the corridor. The final point cloud cloud is presented in Figures 7 and 8. Figure 7 shows all 14,459,693 3D point, while Figure 8 presents two different detailed views corresponding to
Figure 6 with mapped reflectances are shown. The lettering of the poster becomes visible. The red line always denotes the com-puted trajectory of the backpack. The experiment was performed prior to the social event and thus, the oscillation originates from the normal human walking motion.
The result is far from perfect. One reason is that several dynamic objects are in the scene, like people walking by. The data set was acquired during a crowded workshop. An example is shown in Figure 9. Since semi-rigid SLAM depends on closest point cor-respondences wrong corcor-respondences, e. g., the ones from dy-namic objects, lead to incorrect pose estimations and thus to im-precise 3D point clouds. However, the resulting accuracy in the centi-/decimeter range is sufficient for many applications of in-door mapping, like floor and cleaning plan generation. As shown in our previous work in (Elseberg et al., 2013a) the overall quality of the 3D point cloud can be improved, by using a more precise starting estimate for unwinding the data of the Riegl scanner. One could incorporate an IMU, anyhow, we aimed at demonstrating with this work, that IMU-free solutions are implementable.
Figure 7. “unwound” 3D point cloud. Top left: 3D view. Top right: Bird eye view. Bottom: Side views.
6. CONCLUSIONS AND FUTURE WORK
The paper presents the hardware and system architecture of our backpack mobile mapping system. It is currently designed for indoor applications, does not require GPS information or an ex-pensive IMU. It is flexible and can easily be set up. Its techni-cal basis is a horizontally-mounted 2D LiDAR, an effective 2D SLAM algorithm and an calibration and semi-rigid SLAM algo-rithm operating on the 3D point cloud.
Needless to say, a lot of work remains to be done. In future work,
Figure 8. Overall view of the final result. The points have been colored using reflectances and the red line denotes the trajectory.
Figure 9. People walking through the scene, while scanning was in progress.
we aim at testing the backpack in an outdoor environment and in-corporating a GPS. Furthermore, we will integrate an algorithm for estimating human steps and several cameras to color the point cloud. Last but not least, we are planning to replace the laptop with a small form factor industrial computer/raspberry pi or alike to gain improvements in system weight and size. Furthermore, we plan to systematically analyze the obtained accuracies in dif-ferent setups, including sloped or in uneven environments.
ACKNOWLEDGMENTS
The project started while the first two authors were at Jacobs Uni-versity Bremen, Germany. We would like to thank our former stu-dents Remus Dumitru, Araz Jangiaghdam, George Adrian Man-dresi, Vaibhav Kumar Mehta, Robert Savu, and David Redondo. An initial student video is available under the following URL: http://youtu.be/tI7kztEtEFM.
References
Andreas N ¨uchter et al., 2011. 3DTK – The 3D Toolkit.http://slam6d.
sourceforge.net/.
Besl, P. and McKay, N., 1992. A method for Registration of 3-D Shapes.
IEEE Trans. Pattern Analysis and Machine Intelligence (PAMI)14(2), pp. 239–256.
Borrmann, D., Elseberg, J., Lingemann, K., N ¨uchter, A. and Hertzberg, J., 2008. Globally consistent 3d mapping with scan matching. Journal Robotics and Autonomous Systems (JRAS)56(2), pp. 130–142.
Bosse, M. and Zlot, R., 2009. Continuous 3D Scan-Matching with a Spin-ning 2D Laser. In:Proceedings of the IEEE International Conference on Robotics and Automation (ICRA ’09), Kobe, Japan, pp. 4312–4319.
Chen, Y. and Medioni, G., 1991. Object modeling by registration of mul-tiple range images. In: Proceedings of the IEEE International Confer-ence on Robotics and Automation (ICRA ’91), Sacramento, CA, USA, pp. 2724–2729 vol.3.
CSIRO, 2015. Zebedee – Autonomous Systems. https://wiki.
csiro.au/display/ASL/Zebedee.
Davis, T. A., 2005. Algorithm 849: A Concise Sparse Cholesky Factor-ization Package.ACM Trans. Math. Softw.31(4), pp. 587 – 591.
Elseberg, J., Borrmann, D. and N ¨uchter, A., 2013a. Algorithmic solu-tions for computing accurate maximum likelihood 3D point clouds from mobile laser scanning platforms.Remote Sensing5(11), pp. 5871–5906.
Elseberg, J., Borrmann, D. and N ¨uchter., A., 2013b. A study of scan pat-terns for mobile mapping. In:ISPRS Archiv Photogrammetry and Remote Sensing. Proceedings of the ISPRS Conference on ”Serving Society with Geoinformatics” (ISPRS-SSG ’13), Spatial Inf. Sci., XL-7/W2, Antalya, Turkey, pp. 75–80.
Frederic Lardinois, TC, 2015. Google Unveils The Cartographer, Its Indoor Mapping Backpack. http://techcrunch.com/2014/09/
04/google-unveils-the-cartographer-its-indoor-mapping-backpack/.
Izadi, S., Kim, D., Hilliges, O., Molyneaux, D., Newcombe, R., Kohli, P., Shotton, J., Hodges, S., Freeman, D., Davison, A. and Fitzgibbon, A., 2011. KinectFusion: Real-time 3D reconstruction and interaction using a moving depth camera. In:Proceedings of the ACM Symposium on User Interface Software and Technology, Santa Barbara, CA, USA .
Koch, P., May, S., Schmidpeter, M., K ¨uhn, M., Pfitzner, C., Merkl, C., Koch, R., Fees, M., Martin, J. and N ¨uchter, A., 2015. Multi-robot local-ization and mapping based on signed distance functions. In:Proceedings of the IEEE International Conference on Autonomous Robot Systems and Competitions (ICARSC ’15), Coimbra, Portugal.
Kohlbrecher, S., Meyer, J., von Stryk, O. and Klingauf, U., 2011. A flexible and scalable slam system with full 3d motion estimation. In:
Proceedings of the IEEE International Symposium on Safety, Security and Rescue Robotics (SSRR ’ 11), Kyoto, Japan.
Kukko, A., Kaartinen, H., Hyypp¨a, J. and Chen, Y., 2012. Multiplat-form mobile laser scanning: Usability and perMultiplat-formance. Sensors12(9), pp. 11712.
May, S., Koch, P., Koch, R., Merkl, C., Pfitzner, C. and N ¨uchter, A., 2014. A generalized 2d and 3d multi-sensor data integration approach based on signed distance functions for multi-modal robotic mapping. In: VMV 2014: Vision, Modeling & Visualization, Darmstadt, Germany, 2014. Proceedings, Darmstadt, Germany, pp. 95–102.
Mobile Robotics Lab at TH Nueremberg, 2015. autonohm. https://
github.com/autonohm.
N ¨uchter, A., Borrmann, D., Elseberg, J. and Redondo, D., 2015, (ac-cepted). A Backpack-Mounted 3D Mobile Scanning System.Allgemeine Vermessungs-Nachrichten (AVN), Special Issue MoLaS 2014.
N ¨uchter, A., Elseberg, J. and Borrmann, D., 2013. Irma3D – An Intelli-gent Robot for Mapping Applications. In:Proceedings of the 3rd IFAC Symposium on Telematics Applications (TA ’13), Seoul, Korea, pp. 119– 124.
N ¨uchter, A., Elseberg, J., Schneider, P. and Paulus, D., 2010. Study of Parameterizations for the Rigid Body Transformations of The Scan Reg-istration Problem. Journal Computer Vision and Image Understanding (CVIU)114(8), pp. 963–980.
Quigley, M., Gerkey, B., Conley, K., Faust, J., Foote, T., Leibs, J., Berger, E., Wheeler, R. and Ng, A., 2009. Ros: an open-source robot operat-ing system. In: Proceedings of the IEEE International Conference on Robotics and Automation (ICRA ’09), Kobe, Japan.
Stoyanov, T. and Lilienthal, A. J., 2009. Maximum Likelihood Point Cloud Acquisition from a Mobile Platform. In:Proceedings of the IEEE International Conference on Advanced Robotics (ICAR ’09), Munich, Germany, pp. 1–6.
Thomson, C., Apostolopoulos, G., Backes, D. and Boehm, J., 2013. Mo-bile laser scanning for indoor modelling.ISPRS Annals of Photogramme-try, Remote Sensing and Spatial Information SciencesII-5/W2, pp. 289– 293.
Triebel, R. and Burgard, W., 2005. Improving simultaneous localization and mapping in 3d using global constraints. In: Proc. of the Conf. of the Association for the Advancement of Artificial Intelligence (AAAI ’05), Pittsburgh, PA, USA.
VIAmetris, 2015. Mobile Mapping Technology. http://www.
viametris.com/.