www.elsevier.comrlocateratmos
The size distribution of primary biological aerosol
particles in cloud water on the mountain Kleiner
ž
/
Feldberg
r
Taunus FRG
Sabine Matthias-Maser
), Berit Bogs, Ruprecht Jaenicke
Institut fur Physik der Atmosphare, Uni¨ ¨ Õersitat Mainz, Becherweg 21, 55099 Mainz, Germany¨
Received 29 March 1999; received in revised form 20 December 1999; accepted 26 February 2000
Abstract
During the field campaign, FELDEX 95 cloud water samples were collected and the insoluble particles were analysed by single particle analysis in order to determine the content of primary
Ž .
biological aerosol particles PBAP . It is found that 25% of the total insoluble particles are biological ones. During cloud events with increasing wind velocity, the concentration of biological particles also increases. Anthropogenic influence leads to a higher amount of both total and biological particles. Within the size distribution, the percentage of biological particles decreases with increasing radius.q2000 Elsevier Science B.V. All rights reserved.
Keywords: Cloud water analysis; Insoluble component; Single particle analysis
1. Introduction
Aerosol particles have a great importance within the whole atmosphere. They have influence on the radiation budget, on the turbidity and range of sight, as well as on the energy budget of the earth. Their important role in cloud physics as cloud condensation nuclei and as ice forming nuclei is known. These cloud development processes are dependent on the size distribution and on the chemical composition of the aerosol particles. The atmospheric aerosol particles consist of mineral dust, sea salt, volcanic dust, soot, particles, which are produced by chemical and physical reactions of trace
)Corresponding author.
Ž .
E-mail address: [email protected] S. Matthias-Maser .
0169-8095r00r$ - see front matterq2000 Elsevier Science B.V. All rights reserved.
Ž .
Ž .
gases, and of primary biological aerosol particles PBAP . They are ubiquitous and occur in all size classes.
PBAP in the atmosphere play an important role in air hygiene indoors as well as
Ž .
outdoors. Viruses, bacteria, spores, pollen, and insect parts i.e., house dust mites cause diseases or allergenic reactions in humans, animals and plants.
Another aspect of the investigation of PBAP in the atmosphere is the role they play in cloud physics. Atmospheric aerosol particles act as cloud nuclei. However, the majority of them need temperatures under y108C. The peculiarity of some PBAP is that they have freezing capabilities even at temperatures of abouty48C. That means that even if the surrounding is still supercooled, the cloud forming processes can be induced by these
Ž .
ice nucleation active PBAP. Schnell and Vali 1973 reported that a portion of atmospheric freezing nuclei was of biogenic origin. The sources of these nuclei include
Ž . Ž
decaying vegetation, marine plankton Schnell and Vali, 1976 and bacteria Maki et al.,
. Ž .
1974 . Sun et al. 1993 discovered 17 species or varieties of three genera of ice nucleation active bacteria on plants. Even dead bacteria may be active in producing
Ž .
freezing nuclei Maki and Willoughby, 1978 . Ž .
Ice nucleation activity INA of the free living fungus Fusarium was mentioned by Ž .
Pouleur et al. 1992 . They compared the INA of some species of Fusarium with the INA of bacteria and lichens. The warmest temperatures at which ice nucleation occurs
Ž . for Fusarium aÕenaceum wasy2.58C, which is close to that of lichen INA y28C and
Ž .
slightly lower than that of Pseudomonas y18C . As a result of their investigations, they found out that lichen INA and Fusarium INA could have a common origin. They even suggested that ice nucleation of Fusarium acuminatum and F. aÕenaceum could
Ž .
be the source of leaf derived nucleation LDN observed in decomposing leaf litter ŽSchnell and Vali, 1973 . They suggested that the microflora is responsible for the. decomposition of organic matter. F. acuminatum and F. aÕenaceum are both soilborne
fungi and are more prevalent in temperate and cold climates, where LDN concentration is highest.
Ž .
Investigations of Warren and Wolber 1991 show that a single gene is responsible Ž .
for the INA phenotype of the different microorganisms MO . This is better known for bacteria than for ice nucleation in lichens.
Ž .
Even pollen can contribute to condensation processes. Durham 1941 worked with 12 species of pollen to determine their response to air of various humidity levels. He found that all were hygroscopic in the sense that they acquired water from the vapor below 100% relative humidity. The species studied include six weeds, two grasses and
Ž .
four deciduous trees. Dingle 1966 mentioned the hygroscopicity of the protoplasm of
Ž .
ragweed ambrosia artimesiifolia at humidities higher than 51%.
There is no question about the fact that these particles are present in the atmosphere and initiate ice nucleation or other condensation processes for cloud formation.
2. PBAP
A first attempt to examine PBAP in their entirety in the atmosphere was done by Ž .
y3
0.2 mm-r-50 mm and found mean concentrations of PBAP Nbios3.1 cm in
3 y3
number and Vbios6.5mm cm in volume. That amounts to a mean percentage of 23.7% in number concentration and 22.3% in volume of the total aerosol particles. Calculating a mean density of PBAP of 1 g cmy3, the mass of PBAP comes to an amount of 6.5mg my3.
The strong dependency of PBAP on the phenology and the annual variation of the phenology could indicate an annual variation of PBAP. The great variability of Nbio in spring as a consequence of the different florescence of the plants in combination with the different meteorological conditions could be seen allusively. Obviously, no
charac-Ž .
teristic annual variation of PBAP r)0.2 mm neither in number nor in volume was seen. The presumption that in winter the concentration of PBAP would decrease was not
Ž
confirmed. The production mechanisms of PBAP in winter reflotation, decaying .
processes are stronger than expected. Merely the composition of the PBAP changed within the year as follows. In spring: MO, pollen, some spores, a few fragments; in summer: MO, pollen, spores, a few fragments; in autumn: MO, fragments, spores, a few pollen; and in winter: MO, fragments, spores, some pollen.
Because of their ability to act as ice nuclei and because they are thought to be insoluble, it is interesting to investigate their occurrence in cloudrfogwater. The following paper is concerned with the determination of these particles in cloud water
Ž . Ž .
samples collected on the mountain ‘‘Kleiner Feldberg KFBrTaunus FRG ’’ about
Ž .
857 m above sea level Bogs, 1996 , in the course of the field campaign ‘‘FELDEX
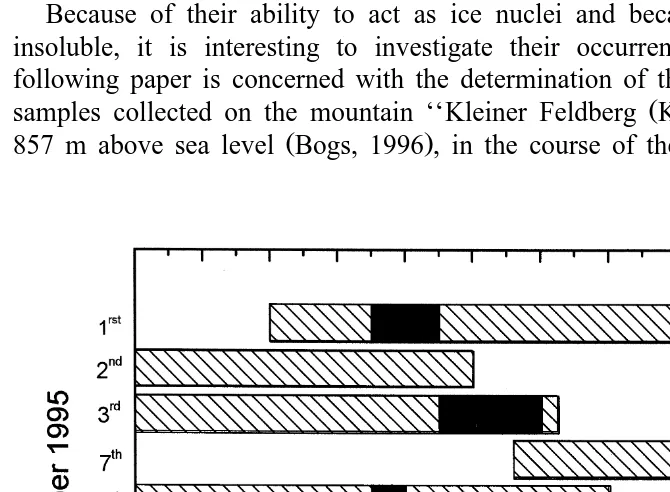
95.’’ The direct surroundings of the ‘‘KFB’’ is covered with forest of some deciduous trees and conifers. In the north, we found some rural regions, and in the south, the Rhine-Main-region is situated. During a time period of 2 weeks from 1st until 15th of November, different meteorological conditions caused the top of the mountain to be
Ž .
shrouded in clouds Fig. 1 . Within these cloud events, several cloud water samples were taken and analysed. The measurements took place in autumn where, first of all, plant debris and MO were expected to be in the atmosphere. Additionally, it gave us the opportunity to investigate how far the decaying processes influence the concentration of these PBAP in clouds.
3. Methods
For cloud water sampling, three different samplers were used: the rotating arm
Ž . Ž
collector RAC sampling, all waterdrops with radius )7.5mm Kramer and Schutz,
¨
¨
. Ž . Ž .
1994 , an isokinetic cloud probing system ICPS Maser and Jaeschke, 1993 and a
Ž .
round-jet impactor Enderle and Jaeschke, 1991 , the latter both with cut-off radii of 2.5
mm. After sampling, the cloud water was frozen until analysis in the laboratory. The evaluation of the water samples was performed after Matthias-Maser and
Ž . Ž .
Jaenicke 1994 and Gruber 1995 . It was divided into two parts: for the particles larger than 2mm a light microscope was used and the particles with r-2mm were evaluated
Ž .
in a scanning electron microscope SEM equipped with an energy dispersive X-ray Ž .
detector EDX . Therefore, two different preparations were necessary. For the particles with 0.2 mm-r-2 mm up to 10 ml of the thawed cloud water was filtered through a
Ž .
polycarbonate filter Fa. Millipore with poresize of 0.2 mm. Afterwards, the filter was dried for 2 h at 308C. For investigation in the SEM, the filter had to be sputtered with carbon to produce a conductive surface on the filter. In the SEM, the biological particles
Ž
were characterized according to three criteria: striking morphology special forms like
. Ž
spheres, rods, characteristic forms, etc. , elemental composition P, S, K, Ca sometimes
. Ž
with Cl on a high background spectrum , and behaviour during EDX sometimes .
instable due to electron beam, shrinking .
For the analysis of the giant aerosol, particles up to 20 ml of cloud water was filtered
Ž .
through a cellulose nitrate filter Fa. Satorius with a poresize of 3mm. The filters were then placed on glass slides and also dried for about 1 h at 308C. The identification of PBAP was performed using an unselective protein dye, which reacts with the carboxyl
Ž .
group of a protein Jaenicke and Matthias, 1988 . As a result, the protein-containing particles, i.e., pollen, plant debris, epithelial cells, and even spores, which are difficult to stain got a bluish colour, which characterizes them as biological. The staining solution, 0.05 ml, was put into the cloud water before filtration, and after a penetration time of 7–10 days under dark and cold storage, the fogwater was filtered as described before. All samples were evaluated in nine size classes and the number concentration
Ž
d Nrdlog r for total, biological and non-biological particles which is the difference .
including poisson error and errors of the instrument and sampling conditions lead to less than 10%. In order not to complicate the graphs, they were omitted. We determined the percentage of the biological particles to the total aerosol particles for each size class, which gives more information of the different components of PBAP, and then we
Ž y1 y3
calculated the total number concentration Ntot and Nbio in ml and cm ,
respec-. Ž 3 y1 y3
tively and the total volume concentration Vtot and Vbio in mm ml and cm ,
. Ž .
respectively . We also calculated the mean concentrations for number N , Ntot bio , and
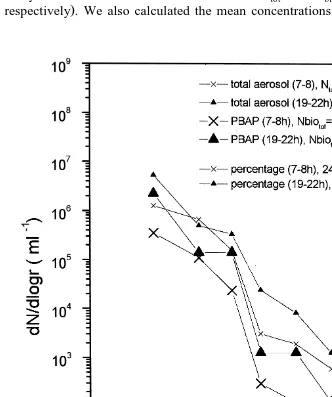
Fig. 2. Size distributions of insoluble particles in cloud water on KFB referred to milliliter of cloud water
Ž .
for volume V , Vtot bio . The result is a first estimate of the insoluble unspecific biological content of the atmospheric aerosol particles in cloud water.
4. Results
Fig. 1 illustrates the time scale of the experiment, the hatched fields show the time period of the cloud events, the marked areas inside show the time from which the analysed samples originate.
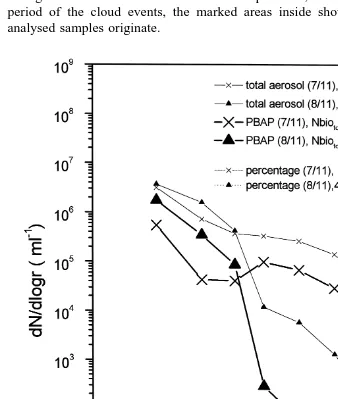
Fig. 3. Size distributions of insoluble particles in cloud water on KFB referred to milliliter of cloud water
We chose three events for presenting the results. The cloud water of these events
Ž .
originate from droplets larger than 2.5mm in radius ICPS or round-jet impactor . The liquid water content during the discussed time periods was always about 400 mgrm3, so in most cases, the measurements took place in local cumulus clouds as a result of forced convection. Unfortunately, there were no direct parallel drop spectra available.
The first started on the 1st of Nov. and lasted about 30 h. We analysed two samples, one from the beginning and the other from the middle of the event. Fig. 2 shows the size
Fig. 4. Size distributions of insoluble particles in cloud water on KFB referred to milliliter of cloud water
Ž . distributions d nrdlog r of the total number of insoluble particles small symbols and of
Ž . Ž . Ž
biological particles big symbols from 0700–0800 h cross and 1900–2200 h up
. Ž .
triangle referred to milliliter of cloud water and their corresponding percentage dotted in each size class. You see that the concentration increased with time. This is mainly
Ž
caused by spores see the relative maximum in the percentage curve with about 40% in
. Ž .
the 3rd radius interval and plant debris with up to 90% in the 8th and 9th interval . Even the number of MO increased. Looking at the meteorological conditions during that event, we had an increase of wind velocity producing strong defoliation, which could explain the growing concentration of bacteria and of plant debris.
The second event we analysed was on the 7th and 8th of Nov. and lasted about 27 h
Ž .
and we analysed samples of the first 7r11, 1720–1800 h and of the second half Ž8r11, 0700–0800 h . The results are seen in Fig. 3. Prior to this event, we had a dry,.
Ž .
cold T-08C period with strong defoliation. This is seen in the concentration of the
Ž . Ž .
giant particles 7r11 see percentage curve , where we first of all found plant debris and pollen, which were deposited on the leafs and got resuspended into the atmosphere through this defoliation. Later, within the cloud event, the temperature increased while
Ž . Ž .
the wind velocity decreased 1 mrs . We found now 8r11 more MO and less plant debris and pollen.
Looking at both events, the percentages of PBAP per milliliter cloud water increased from 17–25% up to 40–41% during one event.
Ž .
In the next cloud event we will consider, it started on the 13th of Nov. see Fig. 1 and lasted 39 h. Fig. 4 shows the size distributions of two samples collected in the
Ž . Ž .
middle 2100–2400 h and at the end 14r11, 1100–1400 h of this event. The concentrations of the total particles were one order of magnitude larger and even the concentration of PBAP was twice of that compared to the previous events. The whole
Ž .
sampling period was largely influenced by the Rhine-Main region southern winds , which leads to this increase of the total, as well as of the biological particles, first of all
Ž .
MO. This effect anthropogenic influence leads to an increase of MO was found also in
Ž .
the ground based measurements Matthias-Maser and Jaenicke, 1995 . However, the percentages did not change during the whole event.
5. Comparison with other size distributions of PBAP
5.1. Size distributions in the liquid phase
Ž .
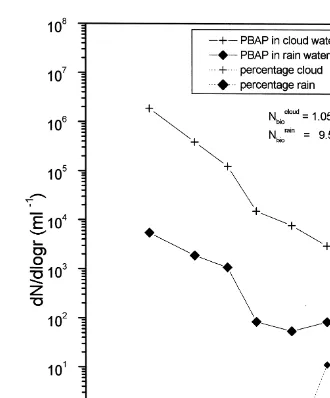
Matthias-Maser et al. 1996 determined the size distribution in rainwater samples collected in Mainz. We calculated the mean values for PBAP related to milliliter of
Ž .
cloud water and compared it to the values in rainwater Fig. 5 . Here, a difference between the two size distributions of sometimes more than two orders of magnitude is seen.
Ž .
This is also obvious in the mean concentrations Table 1 . The content of biological particles in cloud water lies over three orders of magnitude higher than in rainwater; regarding the volume, the difference is only two orders of magnitude. This effect originating from the stronger dilution of the particles in rainwater was also found by
Ž .
Fig. 5. Mean size distributions in rainrcloud water.
5.2. Size distributions in the gaseous phase
During some cloud events, the surroundings of the KFB was cloud-free and syn-chronous aircraft measurements were performed at about an 800-m altitude around the KFB outside of the clouds. For the determination of PBAP in dry air, the aircraft was
Ž .
equipped with a slit-impaction system Gruber, 2000 . Unfortunately, no direct compari-son between the three size distributions of PBAP was possible because of the weather
Ž .
Table 1
Mean concentrations of PBAP for cloud water and rainwater referred to mly1, in brackets the percentage of the total particles
cloud 7 y1Ž . cloud 7 3 y1Ž .
Nbio s0.105=10 ml (24% Vbio s1.318=10 mm ml (12.3%
rain 3 y1Ž . rain 5 3 y1Ž .
Nbio s3.57=10 ml (9% Vbio s4.61=10 mm ml (48%
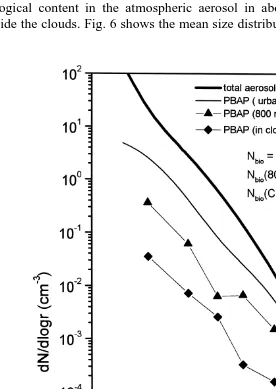
biological content in the atmospheric aerosol in about an 800-m altitude within and outside the clouds. Fig. 6 shows the mean size distributions of these flight measurements
Table 2
Mean concentrations of PBAP for Mainz, 800-m altitude and cloud water referred to cmy3
Ma inz y3Ž . Mainz 3 y3Ž .
Župper triangle. together with the model size distributions for total, rural aerosol ŽJaenicke, 1988. Žthick, solid line and PBAP of urban. rrural influenced region Mat-Ž
. Ž .
thias-Maser, 1998 thin, solid line . In addition, we calculated the mean size distribution Ž .
of PBAP in cloud water cross , referring to cubic centimeter of air volume, from which the cloud water samples originate.
As a first result, we found PBAP in this altitude, which lay between 1 and 1.5 orders of magnitude higher in concentration than those of PBAP in the cloud water samples and one order of magnitude lower for the particles with r-10 mm than those of the ground-based measurements.
However, in Fig. 6, the seasonal peculiarities are obvious. The sampling period of the flight measurements and of the cloud water samples was autumn, with an enlarged occurrence of plant debris. Compared to the ground measurements, which show a yearly average, the size distribution of PBAP for the particles with r)10mm in radius at an 800-m altitude lay above the ground measurement.
This seasonal effect is also seen in the total concentrations N V , and Ntot tot bioVbio, respectively, listed in Table 2 showing the mean values for Mainz, for the 800-m altitude and for cloud water. Fifteen percent of the number concentrations at an 800-m altitude were biological, whereas over 20% in volume were PBAP.
Looking at the insoluble particles found in cloud water about 25% in number and 12% in volume concentration were PBAP.
6. Conclusions
Our investigation results regarding PBAP in cloud water corresponds with the results of the ground-based measurements in so far as about 25% of the insoluble particles in cloud water were biological ones. The strongest variations were seen in the particle size
r)2mm. The largest values were seen after strong winds caused defoliation. This led to an increase of plant debris and of pollen, which have been deposited on the leaf surfaces within the year. But this is probably a seasonal effect.
Ž .
after their solution in cloud water, leave insoluble biological residues. Otherwise, this could be a proof for the nucleation capability of PBAP.
In one cloud event, we found no strong decrease in particles with r-2 mm. This shows that the air is not cleaned by the cloud water, but there is a steady input of MO
Ž .
supported by good conditions temperature and humidity or by the water drops Ž .
themselves, as Fuzzi et al. 1997 supposed that fog droplets could act as good culture medium for microbes.
There are many open questions left, for instance, in how far does day and time have an influence on the biological content in cloudrfogwater. According to the composition, the season will have an influence, i.e., in spring and summer the giant biological particles will be dominated by pollen and spores. It would also be useful to have parallel measurements of the interstitial aerosol particles. For a better understanding, further
Ž .
measurements in clouds and in different types of fog radiation fog are necessary.
Acknowledgements
The work was funded by the Deutsche Forschungsgemeinschaft through its Sonder-forschungsbereich 233 ‘‘Chemie und Physik der Hydrometeore.’’
References
Bogs, B., 1996. Anteil und Großenverteilung der biologischen Partikel in Wolkenwasser, Master’s Thesis,¨ Institute for Atmospheric Physics, University of Mainz.
Dingle, A.N., 1966. Pollen as condensation nuclei. J. Rech. Atmos. 2, 231–237.
Durham, O.C., 1941. The volumetric incidence of atmospheric allergenes: I. Specific gravity of pollen grams. J. Allergy 14, 455–461.
Enderle, K.-H., Jaeschke, W., 1991. Sammlung und chemische Analyse von Nebelwasser unter Berucksichti-¨ gung der Mikrophysik des Nebels, Berichte des Zentrums fur Umweltforschung der Johann-Wolfgang-¨ von-Goethe-Universitat, Frankfurt am Main, ZUF-Verlag Frankfurt, ISBN 3-927338-04-4.¨
Fuzzi, S., Mandrioli, P., Perfetto, A., 1997. Fog droplets — an atmospheric source for secondary biological
Ž .
aerosol particles. Atmos. Environ. 31 2 , 287–290.
Gruber, S., 1995. Biologischer Anteil der unloslichen Bestandteile von Partikeln im Niederschlag, Master’s¨ Thesis, Institute for Atmospheric Physics, University of Mainz.
Gruber, S., 2000. Vertikalverteilung von primar biologischen Aerosolpartikeln in mariner Atmosphare, PhD¨ ¨ Thesis, Institute for Atmospheric Physics, University of Mainz, in preparation.
Ž .
Jaenicke, R., 1988. Aerosol physics and chemistry. In: Fischer, G. Ed. , Landdolt-Bornstein Zahlenwerte und¨ Funktionen aus Naturwissenschaft und Technik, Band 4 Meteorologie. Springer, Berlin, pp. 391–457. Jaenicke, R., Matthias, S., 1988. The primary biogenic fraction of the atmospheric aerosol. In: Hobbs, P.V.,
Ž .
McCormick Eds. , Aerosols and Climate Deepak Publishing.
Kramer, M., Schutz, L., 1994. On the collection efficiency of a rotating arm collector and its applicability to¨ ¨
Ž .
cloud- and fogwater sampling. J. Aerosol Sci. 25 1 , 137–148.
Maki, L.R., Galyan, E.L., Chang-Chien, M., Caldwell, D.R., 1974. Ice nucleation induced by pseudomonas syringae. Appl. Microbiol. 28, 456–459.
Maki, L.R., Willoughby, K.J., 1978. Bacteria as biogenic sources of freezing nuclei. J. Appl. Meteorol. 17, 1049–1053.
Maser, R., Jaeschke, W., 1993. Study of cloud water chemistry — a survey of our activities at the end of
Ž .
Matthias-Maser, S., 1998. Primary biological aerosol particles: their significance, sources, sampling methods
Ž .
and size distribution in the atmosphere. In: Harrison, R.M., Van Grieken, R.E. Eds. , Environmental Particles. Wiley, pp. 349–368.
Matthias-Maser, S., Gruber, S., Jaenicke, R., 1996. The size distribution of primary biological aerosol particles
Ž .
in rainwater. In: Kumala, M., Wagner, P.E. Eds. , Nucleation and Atmospheric Aerosols, Proceedings of the Forteenth International Conference On Nucleation and Atmospheric Aerosols, Helsinki. Pergamon, pp. 526–529.
Matthias-Maser, S., Jaenicke, R., 1994. Examination of atmospheric bioaerosol particles with radii)0.2mm.
Ž .
J. Aerosol Sci. 25 8 , 1605–1613.
Matthias-Maser, S., Jaenicke, R., 1995. The size distribution of primary biological aerosol particles with radii
Ž .
)0.2mm in an urbanrrural influenced region. Atmos. Res. 39 4 , 279–286.
Pouleur, S., Richard, C., Martin, J.-G., Antoun, H., 1992. Ice nucleation activity in Fusarium acuminatum and
Fusarium aÕenaceum. Appl. Environ. Microbiol. 58, 2960–2964.
Ž .
Schnell, R.C., Vali, G., 1973. World-wide source of leaf-derived freezing nuclei. Nature London 246, 212–213.
Schnell, R.C., Vali, G., 1976. Biogenic ice nuclei: Part I. Terrestrial and marine sources. J. Atmos. Sci. 33, 1554–1564.
Schutz, L., Kramer, M., 1987. Rainwater composition over a rural area with special emphasis on the size¨ ¨ distribution of insoluble particulate matter. J. Atmos. Chem. 5, 173–184.
Sprengard-Eichel, C., 1998. Die wasserlosliche Fraktion atmospharischer Aerosolpartikel: Anteil und¨ ¨ Zusamensetzung im Radiusbereich)0.2mm bis 2 mm, PhD-Thesis, Institute for Atmospheric Physics, University of Mainz, Shaker Verlag Aachen, ISBN 3-8265-4129-4, 163 pp.
Sun, F., Zhu, H., He, L., Zhang, Y., 1993. Identification of ice nucleation active bacteria on plants. In: Abstracts — Sixth Intern. Conf. on Biological Ice Nucleation, Laramie, WY, USA, August 4–6. pp. 43–44.