APPLICATION OF LiDAR DATE TO ASSESS THE LANDSLIDE SUSCEPTIBILITY
MAP USING WEIGHTS OF EVIDENCE METHOD
–
AN EXAMPLE FROM PODHALE
REGION (SOUTHERN POLAND)
Mirosław KamińskiPolish Geological Institut-National Research Institut, 4, Rakowiecka street, 00-975 Warsaw, Poland – [email protected]
Commission I, WG I/2
KEY WORDS: Susceptibility map, landslide, Weights of Evidence, LiDAR, Podhale region
ABSTRACT:
Podhale is a region in southern Poland, which is the northernmost part of the Central Carpathian Mountains. It is characterized by the presence of a large number of landslides that threaten the local infrastructure. In an article presents application of LiDAR data and geostatistical methods to assess landslides susceptibility map. Landslide inventory map were performed using LiDAR data and field work. The Weights of Evidence method was applied to assess landslides susceptibility map. Used factors for modeling: slope gradient, slope aspect, elevation, drainage density, faults density, lithology and curvature. All maps were subdivided into different classes. Then were converted to grid format in the ArcGIS 10.0. The conditional independence test was carried out to determine factors that are conditionally independent of each other with landslides. As a result, chi-square test for further GIS analysis used only five factors: slope gradient, slope aspect, elevation, drainage density and lithology. The final prediction results, it is concluded that the susceptibility map gives useful information both on present instability of the area and its possible future evolution in agreement with the morphological evolution of the area.
1. INTRODUCTION
Landslides are a very common geomorphic hazard with considerable economic and ecological consequences. Globally, landslides cause billions of dollars in damage and thousands of deaths and injuries each year. Podhale area which is located in the southern part of Poland is especially endangered by mass movements and was particularly the by landslides (Bober, 1984), (Fig.1). They cause great material damage and pose a significant threat to the local infrastructure. Presented in the article designation methodology landslide susceptibility in relation to the specifics of the area it is important both methodological as well as practical. Can provide material support to resolve issues related to mitigating the effects of natural disasters and the prevention and spatial planning. The traditional method of landslides inventory is mainly based on analysis of relief topographic maps and field studies. This is time-consuming and burdensome. Therefore, in recent years, landslides inventory technique is used airborne laser scanning ALS (Airborne Laser Scanning) sometimes referred LIDAR (Light Detection and Ranking). It is a photogrammetric method, which, combined with field research brings fast and accurate information about the ranges of landslides, their activity and the relief inside. Application of airborne laser scanning (ALS) to study the landslide was often discussed in the scientific literature, both in the world and in Poland (Hsio et al., 2003; Schulz, 2007; Derron & Jaboyedoff, 2010; Borkowski, et al, 2011; Wojciechowski et al., 2012. In spatial analysis, Weights of Evidence method was proposed by Agterberg and developed in the mineral and mining fields in late 1980s. Weights of Evidence modeling for landslide susceptibility mapping, using the log-linear form of the Bayesian probability model, has been recently applied in geomorphologic risk assessments (Van Westen, 2002; Van Westen et al., 2003, 2006; Lee et al., 2002; Mrozek et al., 2004; Ranjan et al., 2008; Barbieri & Cambuli,
2009; Kamiński, 2012). Bivariate statistical analysis methods such as WoE is one of the methods used to conduct landslide susceptibility mapping. GIS-based statistical methods have become very popular in landslide susceptibility assessment (Van Westen et al., 2006). This method is extremely impressive to data management, simultaneous use, graphic and attribute crossing of these digital layers.
Fig.1. Location study area on the background of a topographic map. (www. geoportal.gov.pl).
2. MATERIALS AND METHODS
2.1 Geology of the study area
The studied area is located within the south-western part of the Podhale Basin. It has the shape of the great asymmetric synclinorium, which had formed in the middle of the Oligocene The International Archives of the Photogrammetry, Remote Sensing and Spatial Information Sciences, Volume XLI-B1, 2016
(Watycha, 1977). Its southern wing is inclined at about 45 degrees shore and cut by numerous faults of the longitudinal direction of W-E, lowering the individual fragments of the wings. The central part of the Podhale Basin is a vast and undulating to flat shapes synclinal and anticlinal low (2-20o) slope wings. Creating landslides favor tectonic features Podhale flysch, numerous faults and the presence of contemporary tectonic movements. In terms of lithological tested area is made up Lower and Upper Chochołów Beds (Gołąb, 1959; Watycha 1959; Zimnal et al., 2007; Ludwiniak et al., 2009; Gaździcka , 2011). Generally, the lithology of these complexes, especially alternating the sandstones and shales flysh favors the formation of landslides. Chochołów Beds include in their lithological profile small thick layer of bentonite (Gołąb, 1959; Michalik & Wieser 1959; Watycha, 1977; Westfalowicz - Mogilska, 1986; Kukulak, 1988).
2.2 Weights of evidence modelling
Weights-of-evidence method using the Bayesian probability model was originally developed and widely used for the identification and exploration of mineral deposits (Bonham-Carter et al., 1989; Bonham- (Bonham-Carter, 1994, Parise, M., 2001). Recently, this method has been applied for landslide susceptibility mapping (Lee et al., 2002, Ranjan et al., 2008; Derron M.H. & Jaboyedoff M., 2010; Armas, 2011).
Where P is the probability, B is the presence of potential landslide predictive factor, is the absence of a potential landslide predictive factor, D is the presence of landslide and is the absence of a landslide. A positive weight (W+) and a negative weight (W-) indicate a positive and negative correlation between the presence of the predictive variable and the landslides, respectively. The weight contrast (C) is the difference between two weights (C = W+ - W-) and its magnitude reflects the spatial association between the predictable variable and the landslides. In this method, the assumption of conditional independence of factors was checked. Dependent factors need to be rejected from mapping the landslide susceptibility. The χ2 values between all pairs of binary patterns for each factor were calculated at the 99% significant level as:
A detailed description of this modeling is available in (Bonham-Carter, 1994).
2.3 ALS processing
Elevation data ALS (Airborne Laser Scanning) is provided in the form of aggregated measurement data in LAS format, as LiDAR point cloud density scan 4 points / m2. The rest of the processing point clouds was conducted in a dedicated programming LP 360's Q Coherent GeoCue Group. The basic processes of processing point clouds obtained by ALS is their
classification and filtering (Hejmanowska et al; 2008; Kurczyński, 2014) (Fig.2).
Fig.2. Steps of generating DEM elevation data derived from airborne laser scanning.
The products which are the results of the processing of point clouds are elevation models: DSM (Digital Surface Model) and DEM (Digital Elevation Model). In order to emphasize different elements of land cover, cloud points DSM can be displayed in different modes. Due to the amount of points and the color model similar to natural RGB (Red, Green, Blue). For further spatial analysis generated digital elevation model in the structure of the pixel GRID 10m. For interpolation height points representing the surface area used deterministic algorithm IDW (Inverse Distance Weighting) (Davis, 2002). The choice of method of interpolation was performed using a test which was to assess the accuracy of models made by various methods. In addition to the IDW algorithm was used to test two other algorithms: NN (Natural Neigbor) and simple kriging.
3. RESULTS AND DISCUSSION
Mapping landslides performed on sleepers surveying on a scale of 1:10:000 with the use of stereoscopic aerial photographs in scale 1:13 000, a digital elevation model ALS. A total of 120 landslides were inventoried, which occupy 5.25 km2 space study area (Fig.3) and (Fig.3a).
Fig.3. Landslides of the study area.
Fig.3a. Spatial view on the landslides.
The first two factors have been developed passive in vector form in the geodatabase, and the remaining three were created as a result of digital processing digital elevation model ALS in GRID format, the size of the pixel field of 10 m. The next step was to convert vector data (lithology, streams) format GRID 10 meters. Then a layer of offsets generated in ArcGis streams density map. This created seven layers grid developed software ArcGis. Before modeling a collection of inventoried landslides has been divided into two spatial subsets, which contained 60 landslides. The first subset of landslides and thematic maps were used to develop the model, and the second subset of landslides was used to verify the model. Calculated for 60 landslides a priori probability, which amounted to 0.0235. It is worth noting that the number of points used to model the impact on the calculated probability. Then developed a digital GIS layer prediction. These were: lithology, tectonic lines, elevation, slope, aspect, streams density, curvature and landslides (Fig.4).
Fig.4. Flow diagram for landslide susceptibility modelling.
Lithology
Class
Area /sq.km/
Points W+ W- C Sands 1000 19 -0.2149 0.0586 -0.2735
Sands,
graves 414 8 -0.1974 0.0194 -0.2167
Sands,
silts 909 27 0.2431 -0.0778 0.3209
Sandstone 237 4 -0.3353 0.0169 -0.3522
Shales and
sandstone 324 6 -0.2398 0.0176 -0.2575
Shales 1339 35 0.1115 -0.0561 0.1676 Elevation
Class
Area /sq.km/
Points W+ W- C
0-28 292 13 0.6652 -0.0709 0.7360 28-56 728 11 -0.4469 0.0730 -0.5200 56-85 693 9 -0.6010 0.0860 -0.6870 85-113 807 22 0.1555 -0.0403 0.1958 113-141 681 20 0.2325 -0.0512 0.2837 141-170 472 14 0.2414 -0.0347 0.2761 170-198 358 6 -0.3404 0.0265 -0.3669 198-226 170 3 -0.2885 0.0105 -0.2990 226-255 25 1 0.5365 -0.0042 0.5407
Slope
Class
Area
/sq.km/ Points W+ W- C
0-3 763 6 -1.1068 0.1400 -1.2468
3-6 2173 40 -0.2463 0.2099 -0.4562
6-9 923 35 0.4966 -0.1940 0.6905
9-11 256 10 0.5261 -0.0449 0.5710
11-15 78 5 1.0471 -0.0339 1.0810
15-19 25 3 1.7442 -0.0255 1.7697
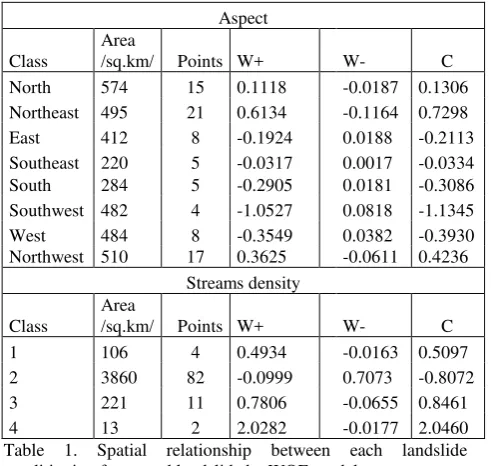
Aspect
Table 1. Spatial relationship between each landslide conditioning factor and landslide by WOE model.
After multiple iterations developed a predictive model that takes into account lithology, elevation, slope, aspect, and streams density. These variables are most important in predicting areas susceptible to landslides. Calculated positive and negative weight values, variances, contrast, and the posterior probability. Are shown in Table 1. Modeling was performed using the module ArcSDM (Spatial Data Modeller), which is an extension of ArcGis and developed by the Geological Survey of Canada. Verification of the model is to see what percentage of landslides from the second set of falls on the areas designated on the basis of a subset of the first. They obtained 78% of correctly classified pixels. In this way, they developed final resulting landslide susceptibility map (Fig.5). Conducted modeling authorizes the distribution of study area into two categories: stable and unstable. Stable areas is mainly the valley of the Black Dunajec which is built from Holocene and of geological layers with a large share of shale flysch.
Fig.5. Landslide susceptibility map.
Fig.5a. Spatial view on the landslide susceptibility map.
4.
CONCLUSION
1. Developed landslide susceptibility map shows the spatial distribution of areas with varying degrees of probability of occurrence of landslides in the future. Within a very high susceptibility were roads, residential buildings as well as forests.
2. Landslide susceptibility maps in local and regional scales (eg. 1:10 000, 1:25 000) should be done in terms of planning. 3. The presented geostatistical method Weights of Evidence (WOE) is useful for modeling prone landslides areas. 4. It is planned to test other geostatistical methods with using hydrogeological and meteorological date .
5.
REFERENCES
Armas I., 2011. Weights of Evidence method for landslide susceptibility mapping. Prahova Subcarpathians, Romania. Nat. Hazard 6, pp.31–38. mineral potential. Statistical Applications in the Earth Sciences (eds. F.P. Agterberg, G.F. Bonham-Carter). Geological Survey of Canada Paper, 89, 9, pp.171–183.
Bonham-Carter G.F., 1994. Geographic Information System for Geoscientists: modeling with GIS. Computer methods in the Geoscience vol. 13, Pergamon press, pp. 398.
Davis J.C., 2002. Statistics and data analysis in geology. John Wiley&Sons. New York, Chichester, Brisbane, Toronto, Singapore, pp. 97-98.
Derron M.H. & Jaboyedoff M., 2010. LiDAR and DEM technique for landslides monitoring and characterization. Nat. Hazard Earth Syst. Sci., 10 (9), pp.1877–1879.
Gaździcka E., 2011. Objaśnienia do szczegółowej mapy
geologicznej Tatr, arkusz Gubałówka w skali 1:10 000. Arch. PIG, pp. 1–42. (unpublished report).
Gołąb J., 1959. Zarys stosunków geologicznych fliszu zachodniego Podhala. Biul. Inst. Geol., 149, pp.225–239.
Hejmanowska B., Borowiec N., Badurska M., 2008. Przetwarzanie lotniczych danych lidarowych dla potrzeb generowania NMT i NMPT. Arch. Fotogr., Karto i Teledet, vol. 8, pp.1-13.
Hsio K.H., Yu M.F. & Stengy.H., 2003. Change Detection of Landslide Terrains Rusing Grodnu – based LiDAR date: Proc. Of the Soc. Chinese Assoc. Geogr. Infor., pp.36–54.
Kamińśki M., 2012. Landslide susceptibility map in a regional scale – example from of San Valley in the Dynów Foothills.
Biul. Państ. Inst. Geolog. 452, pp. 109-118.
Kukulak J., 1988. Powiązania morfostrukturalne w rozwoju osuwisk zachodniego Podhala. Folia Geogr., 20, pp.33–49.
Kurczyński Z., 2014. Fotogrametria. PWN Warszawa, pp.124-127.
Lee S., Choi J., Min K., 2002. Landslide susceptibility analysis and verification using the Bayesian probability model. Environmental Geology, 43, pp.1-2.
Ludwiniak M., Klimkiewicz D. & Mastella L., 2009. Tektonika Podhala. [W:] A. Uchman, J. Chowaniec (red.), Budowa
geologiczna Tatr i Podhala ze szczególnym uwzględnieniem
zjawisk geotermalnych na Podhalu. LXXIX Zjazd Naukowy
PTG, Bukowina Tatrzańska, 27–30.09.2009. Państw. Inst. Geol., pp.41–51.
Mrozek T., Poli S., Sterlacch i n i S., Zabuski L., 2004. Landslide susceptibility assessment:a case study from Beskid Niski Mts., Carpathians, Poland. Polish Geological Institute Special Papers 15, pp.13–18.
.
Parise, M., 2001. Landslide mapping techniques and their use in the assessment of the landslide hazard. Physics and Chemistry of the Earth, 26, pp.697-703.
Ranjan K.D, Shuichi H., Atsuko N., Minoru Y., Takuro M., Katsuhiro N., 2008. GIS-based weights-of-evidence modeling of rainfall-induced landslides in small catchments for landslide susceptibility mapping. Env. Geol., 54, pp.311–324.
Schulz W.H., 2007. Landslide susceptibility revealed by LIDAR imagery and historical records, Seattle, Washington.
Engineering Geology, 89, pp. 67–87.
Van Westen CJ., 1997. Statistical landslide hazard analysis, ILWIS 2.1 for Windows application guide. ITC Publication, Enschede, pp.73–84.
Van Westen CJ., 2002. Use of weight of evidence for landslide susceptibility mapping. ITC Publication, pp. 1– 21.
Van Westen C, Rengers N, Soeters R., 2000. Use of geomorphological information in indirect landslide susceptibility assessment. Nat. Hazards 30, pp.399–419.
Van Westen CJ, Van Asch TWJ, Soeters R., 2006. Landslide hazard and risk zonation: why is it still so difficult. Bull. Eng. Geo.l Environ., 65, pp.167–184.
Watycha L., 1959. Uwagi o geologii fliszu podhalańskiego we
wschodniej części Podhala. Prz. Geol., 7 (8), pp.350–356. Westfalewicz-Mogilska E., 1986. Nowe spojrzenie na genezę
osadówfliszu podhalańskiego. Prz. Geol., 12, pp.690–698.
Zimnal Z., Marciniec P., Piotrowska K., 2007. Objaśnienia do Szczegółowej mapy geologicznej Tatr, arkusz. Witów w skali
1:10 000. Arch. PIG, pp.3–36. . (unpublished report).
Zimnal Z., Marciniec P., Piotrowska K., 2007. Szczegółowa
mapa geologiczna Tatr, ark. Witów w skali 1:10 000. Arch.
PIG. (unpublished report).