RADIOMETRIC AND GEOMETRIC ACCURACY ANALYSIS OF RASAT PAN
IMAGERY
S. Kocaman*, I. Yalcin, M. Guler
Hacettepe Uni., Dept. of Geomatics Eng. 06800 Beytepe Ankara, Turkey [email protected], [email protected], [email protected]
Commission I, WG I/4
KEY WORDS: RASAT, accuracy, validation, radiometry, geometry, satellite imagery
ABSTRACT:
RASAT is the second Turkish Earth Observation satellite which was launched in 2011. It operates with pushbroom principle and acquires panchromatic and MS images with 7.5 m and 15 m resolutions, respectively. The swath width of the sensor is 30 km. The main aim of this study is to analyse the radiometric and geometric quality of RASAT images. A systematic validation approach for the RASAT imagery and its products is being applied. RASAT image pair acquired over Kesan city in Edirne province of Turkey are used for the investigations. The raw RASAT data (L0) are processed by Turkish Space Agency (TUBITAK-UZAY) to produce higher level image products. The image products include radiometrically processed (L1), georeferenced (L2) and orthorectified (L3) data, as well as pansharpened images. The image quality assessments include visual inspections, noise, MTF and histogram analyses. The geometric accuracy assessment results are only preliminary and the assessment is performed using the raw images. The geometric accuracy potential is investigated using 3D ground control points extracted from road intersections, which were measured manually in stereo from aerial images with 20 cm resolution and accuracy. The initial results of the study, which were performed using one RASAT panchromatic image pair, are presented in this paper.
1. INTRODUCTION
1.1 RASAT Sensor Characteristics
RASAT is the second Earth Observation Satellite (after BILSAT) of The Scientific and Technological Research Council of Turkey (TUBITAK) Space Technologies Search Institute (TUBITAK Space). RASAT was launched into orbit on 17th August 2011 and the first images were taken from in October 2011 (RASAT, 2016; Erdogan et al., 2016). It operates with pushbroom principle and acquire images in 4 different spectral bands (panchromatic, red, green and blue).
Technical specifications of RASAT satellite sensor is given in Table 1 (Erdogan et al., 2016). All product levels of RASAT imagery over Turkey are freely available to Turkish citizens on the web geoportal provided by TUBITAK Space (Gezgin, 2016; Teke et al., 2015).
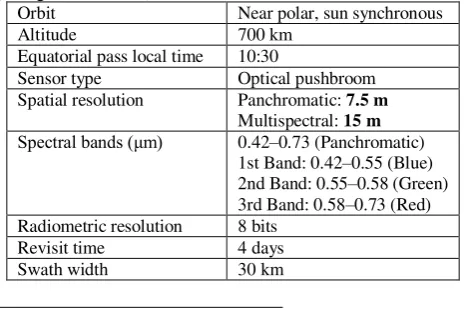
Table 1. Technical specifications of RASAT satellite sensor (Erdogan et al., 2016).
Orbit Near polar, sun synchronous
Altitude 700 km
Equatorial pass local time 10:30
Sensor type Optical pushbroom
Spatial resolution Panchromatic: 7.5 m Multispectral: 15 m Spectral bands (μm) 0.42–0.73 (Panchromatic)
1st Band: 0.42–0.55 (Blue) 2nd Band: 0.55–0.58 (Green) 3rd Band: 0.58–0.73 (Red) Radiometric resolution 8 bits
Revisit time 4 days
Swath width 30 km
* Corresponding author
The georeferencing accuracy of the RASAT images do not represent state-of-the-art, due to lack of physical sensor modelling and software development. In addition, there are deficiencies in the mechanical parts of the satellite, such as startracker and controller. These facts have been stated by different authors (Tufekci et al., 2011; Teke et al., 2015; Erdogan et al., 2016; Teke, 2016). In order to obtain high accuracy point positioning, high quality image trajectory measurement is crucial (Kocaman and Gruen, 2008). In addition, despite their weaker sensor geometry, the Linear Array CCD sensors reaches the accuracy potential of the conventional frame imagery for point determination especially with the use of self-calibration for modeling the systematic errors (Kocaman, 2009).
The aim of this study is to evaluate the radiometric and geometric quality of RASAT images over a test field near the city of Edirne/Kesan in Turkey. Two overlapping images of the area from the year 2012 and 2015 are used for the investigations. The preliminary results have shown that the dynamic range (radiometric resolution) of the images are around 6 bits for the processed dataset. On the other side, the noise level is relatively low and no significant image artifacts have been observed.
Regarding the geometric quality, no absolute accuracy assessment has been performed so far. One RASAT panchromatic image pair is processed using a total of 21 ground control points in two different point configurations. The modelling of the exterior orientation (EO) parameters has been performed using polynomial functions with different numbers of unknowns (polynomial orders). Although the dataset is far from being optimal, triangulation results in the order of 1-1.5 pixels could be obtained in the investigations. The difficulties encountered in the triangulation are manifold and the major ones
can be listed as problems in point determination (i.e. few man-made targets with the given resolution) and measurement (i.e. radiometric differences between the images due to large time interval between the image acquisitions, finding suitable GCPs in both images, etc.) and unavailability of the metadata (e.g. accurate satellite orbit and rotation data, interior orientation, etc.).
2. METHODOLOGY AND DATA
2.1 Data Characteristics
Two image acquisitions of RASAT over Kesan area are used in the study. The image processing levels are provided in Table 2 (Gezgin, 2016). The main characteristics and an overview of the testfield are provided in Table 3 and Figure 1, respectively.
The images with all available levels and channels for both acquisitions are downloaded from Gezgin Geoportal. Until the the time of this writing, only the panchromatic channel images with a ground sample distance (GSD) of 7.5 m have been investigated. The image products used for the radiometric and geometric investigations are mainly the panchromatic L1 and L1B (radiometrically pre-processed) images.
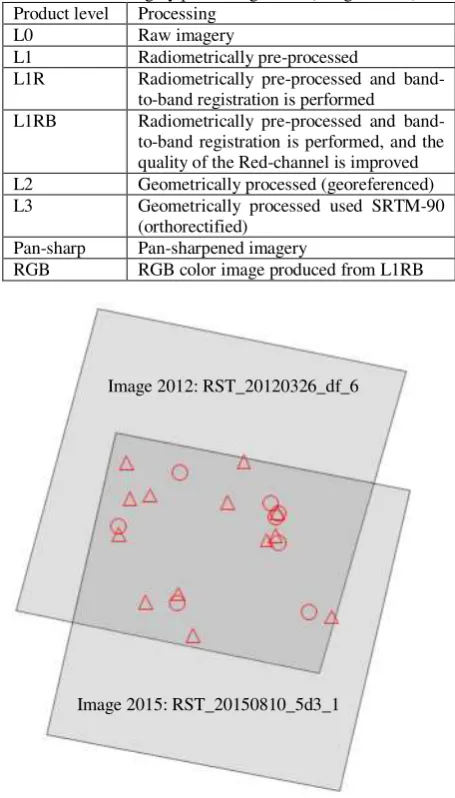
Table 2. RASAT imagery processing levels (Gezgin, 2016). Product level Processing
L0 Raw imagery
L1 Radiometrically pre-processed
L1R Radiometrically pre-processed and band-to-band registration is performed L1RB Radiometrically pre-processed and
band-to-band registration is performed, and the quality of the Red-channel is improved L2 Geometrically processed (georeferenced) L3 Geometrically processed used SRTM-90
(orthorectified) Pan-sharp Pan-sharpened imagery
RGB RGB color image produced from L1RB
Figure 1. An overview of Kesan testfield. The red triangles denote the positions of the GCPs, the red circles denote the check points and the grey rectangles denote the coverage area of the two RASAT acquisitions.
Table 3. The main characteristics of Kesan testfield. Parameter Main features
GCPs 30 points with an accuracy of ~20 cm in X,Y,Z
Stereo coverage area
22 km x 20 km
Min & max elevation
~20 m & ~400 m
Imagery from 2012
Name: RST_20120326_df_6
Acquisition date & time: 26.03.2012 9:37 Availability: All channels and all levels except L3 are available.
Acquisition angles: Roll: ~21°, Pitch & yaw: ~0°
Imagery from 2015
RST_20150810_5d3_1.
Acquisition date & time: 10.08.2015 10:10 Availability: All channels and product levels are available.
Acquisition angles: Roll: ~3°, Pitch: ~0°, Yaw: 180°
For the geometric accuracy evaluations, digital aerial orthoimages with 20 cm resolution and accuracy, and the road lines produced from the same flight mission data at the Turkish General Directorate of Land Registry and Cadastre have been used. The ground control points (GCPs) have been extracted from the road vectors and have an accuracy of 20 cm in planimetry and in height. Two examples to selected GCPs are provided in Figure 2. The image measurement accuracy of the GCPs is around one pixel.
Figure 2. Examples of 3D reference points (GCPs) selected from road intersections in the original RASAT orthoimages (contrast enhancement is applied for display purposes).
2.2 Radiometric Quality Control
In terms of radiometric quality control, MTF analysis, histogram checks, visual checks and noise analysis on homogeneous surfaces have been performed.
The MTF is a fundamental criterion for measuring the spatial resolution performance of the imagery and is mathematically defined as the normalised magnitude of the Fourier transform of the point spread function (PSF) or line spread function (LSF) of an imaging system (Akca and Gruen, 2009). The RASAT panchromatic channel images are analysed in terms of MTF, ESF and LSF using Quick MTF software (2016). The spatial frequency by the contrast 0.5 (50% of MTF) is singled out by the software and this value is called MTF50. Several road edges extracted in along-track and across-track directions are used as analysed as suggested by Crespi and de Vendictis (2009).
For the histogram analysis, histograms of L1 and L1B images from both acquisitions have been compared in terms of occupied bins, mean and standard deviations and found to be similar. Regarding the noise analysis, image patches selected on the lake surfaces have been analysed in terms of mean and standard deviation values. This method has been proposed by Baltsavias Image 2012: RST_20120326_df_6
Image 2015: RST_20150810_5d3_1
et al. (2001). The number of lakes vary with the images due to different terrain coverages.
2.3 Geometric Quality Control
Regarding the geometric accuracy, only an indirect georeferencing has been performed so far. Firstly, the GCPs which are visible on both acquisitions are measured in L1B images in stereo mode. In addition, a number of tie points has been added with automatic image matching. For the areas with low contrast, where the automatic tie point generation was not successful, a few more points have been added manually to ensure the adequacy of the planimetric point distribution. Photogrammetric bundle adjustment has been applied in ERDAS Imagine 2015 Photogrammetry tool with different model and GCP configurations. Since the sensor physical model and the orbit data are not available, generic pushbroom model of ERDAS Imagine is used. Nominal pixel size on the images (5 µ) and the ground (7.5 m), together with the focal length (466.7 mm) are used to define the sensor characteristics. The roll and pitch angles given in the metadata files are used in the adjustment as initial values.
3. RESULTS AND DISCUSSION
3.1 Radiometric Investigations
The L1 image histograms of both acquisitions are provided in Figure 3a and 3b. It can be seen that the full range (256 gray values) of the histogram are not covered. For the 2012 image (RST_20120326_df_6_L1), ca. 20% is occupied and for the 2015 image (RST_20150810_5d3_1_L1), ca. 30% is covered. These values show that the actual radiometric range of the sensor is approximately 6 bits. The mean values of the 2012 and 2015 images are 64.8 and 82.4 with standard deviations of 10.0 and 15.6, respectively. This also shows that the contrast of the latter image is better, which also could be explained by better illumination conditions in summer.
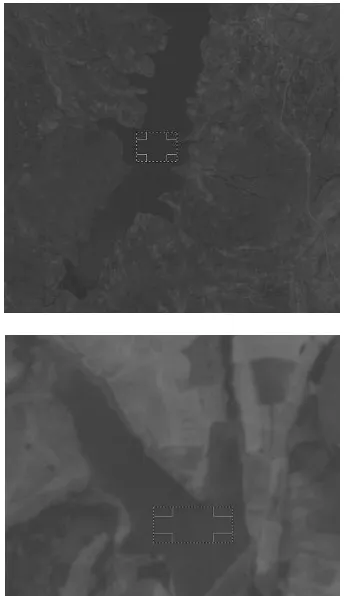
Image patches (ca. 20 x 80 pixels from L1 images) selected from the lake surfaces are analysed using a window size of 5x5 pixels with a step size of one pixel. Examples to the selected lake surfaces are given in Figure 4. Only 70% of the results for each patch is used for the final analysis. The remaining 30% with the largest standard deviations are excluded from the analysis. The analysis results of both images are given in Table 4. The minimum, the maximum and the standard deviation values are computed using the mean standard deviations obtained from all lakes per image. The results show that the noise levels in both images are relatively low. However, the low image contrast should also be taken into account while evaluating the noise level.
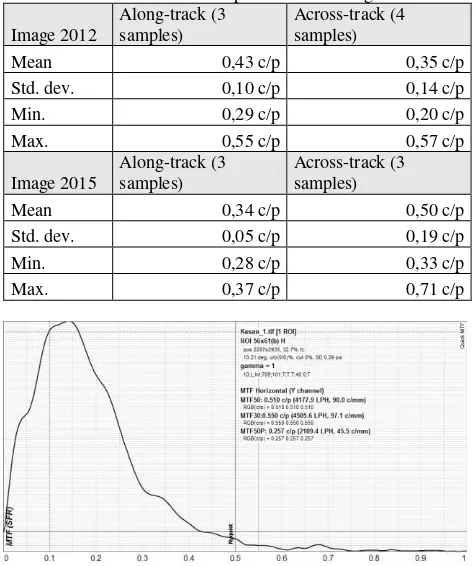
The MTF analyses have been performed using several road lines in satellite along-track and across-track directions. Finding optimal edges has however been a challenging task and the selected lines are sub-optimal for being conclusive for the spatial resolution. Examples to the line patches are given in Figure 5. A summary of the MTF results are given in Table 5. The values in the tables are statistical summaries of all samples per image and direction (i.e. along-track and across-track). These results are in accordance with the results of Turkmenoglu and Yaglioglu (2013). No significant resolution difference has been observed in the along-track and across-track directions. The MTF, ESF and LSF analysis charts for one edge are given in Figures 6 and 7.
Number of pixels
0 50 100 150 200 250 Gray value
Figure 3a: Histogram of RST_20120326_df_6 L1 image.
Number of pixels
0 50 100 150 200 250 Gray value
Figure 3b: Histogram of RST_20150810_5d3_1 L1 image.
Figure 4. Two of the lakes with RASAT L1 image patches (white rectangles with dotted lines) used for the noise estimation.
Table 4. Noise analysis results.
Image Kesan-2012 Kesan-2015
No. of lakes 9 7 (right) road lines used for the MTF analysis.
Table 5. MTF50 results of both panchromatic images.
Image 2012
Figure 6. MTF analysis output in Quick MTF for the edge sample in Figure 5 (left image).
Figure 7. ESF and LSF analysis output in Quick MTF the edge sample in Figure 5 (left image).
3.2 Geometric Accuracy Results
The triangulation results are provided in Tables 6 and 7. The interior orientation parameters are used as fixed parameters as no other option was available. The EO parameters are modelled using polynomial functions with 0th, 1st, 2nd and 3rd orders. The results from 4 different configurations of the polynomial orders are provided in Tables 6 and 7 (two cases per table). A total of 21 GCPs in two different configurations and 71 tie points are used per EO model.
The results show that the RMSE values obtained from 8 check points (CPs) do not change significantly by using higher order polynomials. Use of 1st order polynomials (shift and drift) for X and Y; and using 0th order polynomial (shift only) for the height, Omega, Phi and Kappa angles are sufficient for the EO modelling (Case 4 in Table 7). Using smaller order (shift only) for X and Y was not possible in the software for the generic pushbroom model. The absolute accuracy obtained from the CPs are around 1 pixel in Y, and 1.3 pixels in X and Z directions for all cases. Considering the fact that the image measurement accuracy for the points were around one pixel, these values could be perceived as the accuracy limit that could be obtained from this dataset.
The standard deviations (Image x,y) obtained from image space coordinates of all control points are the smallest for the Case 2, which can be interpreted as over-parametrization especially in y direction for the Case-1. In the Case-4 with 21 GCPs (no check points), the higher Image x values show that the internal errors are better modelled with higher order polynomials. It should also be noted that, control points located near the image borders show larger deviations (corrections) from their measured locations due mainly to the larger distortions at the borders.
Table 6. Triangulation results, part-1. Polynomial
order
Case 1: X,Y: 2; Z:3 Case 2: X,Y: 2; Z:3 Omega,Phi,Kappa: 2 Omega,Phi,Kappa: 1 No. of
Table 7. Triangulation results, part-2. Polynomial
order
Case 3: X,Y: 1; Z:2 Case 4: X,Y: 1; Z:0 Omega,Phi,Kappa: 1 Omega,Phi,Kappa: 0 No. of
4. CONCLUSIONS
In this paper, the preliminary results on the geometric and radiometric quality of the RASAT PAN images are presented. The radiometric investigations show that the radiometric range of the images is lower than 8 bit and equals to ca. 6 bits. The estimated noise is relatively low and around 0.6-0.7 pixels. The MTF analysis in cross-track and along-track directions do not show significant spatial resolution difference in these directions.
The geometric accuracy investigations have only been done using a total of 21 GCPs and CPs, and different number of polynomial orders for EO modelling. The results from the independent check points have shown that it is possible to obtain georeferencing accuracy around one pixel, which is as well the point measurement accuracy. The georeferencing accuracy will further be evaluated through dense matching of aerial and RASAT PAN orthoimages.
The sensor can be utilized especially for the applications where 7.5 m GSD is sufficient, e.g. automatic change detection for the land use of large areas. The stereo capability can be further analysed with other data which has better stereo configuration (e.g. acquisition angles, small temporal difference, etc.). However, due to the difficulties in point determination in the images, advanced methods for GCP selection and measurements (e.g. line feature matching instead of point matching) could be investigated as future work. Quality checks on the MS images, band-to-band registration, and pan-sharpening accuracy are also important parts of the future work.
ACKNOWLEDGEMENTS
Authors would like to thank to the Turkish General Directorate of Land Registry and Cadastre for the provision of the reference data. The financial support by Hacettepe University Scientific Research Projects Coordination Unit via grant numbered 8240 is gratefully acknowledged.
REFERENCES
Akca, D., Gruen, A., 2009. Comparative Geometric and Radiometric Evaluation of Mobile Phone and Still Video Cameras. The Photogrammetric Record 24(127), pp. 217–245.
Baltsavias, E. P., Pateraki, M., Zhang, L., 2001. Radiometric and geometric evaluation of IKONOS Geo images and their use for 3D building modeling. Joint ISPRS Workshop on "High Resolution Mapping from Space 2001", Hannover, Germany, 19-21 September. CD-ROM.
Crespi, M., de Vendictis, L., 2009. A Procedure for High Resolution Satellite Imagery Quality Assessment. Sensors, 9, pp. 3289-3313. doi:10.3390/s90503289
Erdogan, M., Yilmaz, A., Eker, O., 016 The georeferencing of RASAT satellite imagery and some practical approaches to increase the georeferencing accuracy, Geocarto International, 31:6, 647-660, DOI: 10.1080/10106049.2015.1073367.
Gezgin, 2016. www.gezgin.gov.tr (last accessed on 30.04.2016)
Kocaman, S., 2009. Sensor Modeling and Validation for Linear Array Aerial and Satellite Imagery (2009). ETH Zurich, Switzerland. ISBN:978-3-906467-88-7
Kocaman, S., Gruen, A., 2008. Orientation and self-calibration of ALOS PRISM imagery. The Photogrammetric Record, 23(123), 323-340. DOI: 10.1111/j.14779730.2008.00493.x
RASAT, 2016. http://uzay.tubitak.gov.tr/tr/uydu-uzay/rasat (last accessed on 30.04.2016)
Teke, M., Tevrizoğlu, İ., Öztoprak, A.F., Demirkesen, C., Açıkgöz, İ.S., Gürbüz, S.Z., Küpcü, R., Avenoğlu, B., 2015. GEOPORTAL: TÜBİTAK UZAY Satellite Data Processing and Sharing System. 7th International Conference on Recent Advances in Space Technologies (RAST).
Teke, M., 2016. Satellite Image Processing Workflow for RASAT and GÖKTÜRK-2. Journal of Aeronautics And Space Technologies. Vol. 9(7), pp.1-13.
Tufekci, C.S., Ertongur, N., Yavuzyilmaz, C., Gulmammadov, F., Kahraman, O., Subasi, Y., 2011. Attitude performance requirements and budgeting for RASAT satellite. Recent Advances in Space Technologies (RAST), 5th International Conference; Istanbul; 2011 Jun 9–11; p. 968–973.
Turkmenoglu, M., Yaglioglu, B., 2013. On-Orbit Modulation Transfer Function Estimation for RASAT. 6th International Conference on Recent Advances in Space Technologies (RAST), Istanbul, Turkey.
Quick MTF, 2016. http://www.quickmtf.com/ (last accessed on 30.04.2016)
Zhang, L., 2005. Automatic Digital Surface Model (DSM) Generation from Linear Array Images. Ph.D. Thesis, ETH Zurich.