EROSION MODELLING IN A MEDITERRANEAN SUBCATCHMENT UNDER
CLIMATE CHANGE SCENARIOS USING PAN-EUROPEAN SOIL EROSION RISK
ASSESSMENT (PESERA)
A. Cilek a *, S. Berberoglu a *, M. Kirkby b, B. Irvine b, C. Donmez a, M.A. Erdogan c
a Department of Landscape Architecture, University of Cukurova, Adana 01330, Turkey ([email protected], [email protected],
b School of Geography, University of Leeds, Leeds LS2 9JT, UK ([email protected], [email protected]) c Vocational School of Technical Sciences Department, Programme of GIS, University of Çukurova, Adana 01330, Turkey
THEME: BIOD - Forests, Biodiversity and Terrestrial Ecosystems
KEY WORDS: Erosion, Runoff, PESERA, Climate change, Mediterranean, Turkey
ABSTRACT:
The Mediterranean region is particularly prone to erosion. This is because it is subject to long dry periods followed by heavy bursts of erosive rainfall, falling on steep slopes with fragile soils, resulting in considerable amounts of erosion. In parts of the Mediterranean region, erosion has reached a stage of irreversibility and in some places erosion has practically ceased because there is no more soil left. With a very slow rate of soil formation, any soil loss of more than 1 t ha−1 yr−1 can be considered as irreversible within a time span of 50-100 years. The objectives of this study were i) to estimate the temporal and spatial distribution of soil erosion under climate change scenarios in study area ii) to assess the hydrological runoff processes.
In this study, climate data, land use, topographic and physiographic properties were assembled for Egribuk Subcatchment at Seyhan River Basin in Turkey and used in a process-based Geographical Information System (GIS) to determine the hydrological sediment potential and quantify reservoir sedimentation. The estimated amount of sediment transported downstream is potentially large based on hydrological runoff processes using the Pan-European Soil Erosion Risk Assessment (PESERA) model. The detailed model inputs included 128 variables derived mainly from, soil, climate, land use/cover, topography data sets. The outcomes of this research were spatial and temporal distribution of erosion amount in t ha−1 yr−1 or month−1.
1. INTRODUCTION
Soil erosion is a major environmental problem in Turkey and worldwide. It is associated with about 85 % of land degradation in the world, causing up to 17% reduction in crop productivity (Oldeman et al., 1990). Eroded soils carry nutrients, pesticides and other harmful farm chemical into rivers, streams and ground water resources (Gallaher and Hawf, 1997).
Soil erosion has increased throughout the 20th century (Angima et al., 2003), and is becoming an extremely serious environmental problem, if not a crisis (Stanley and Pierre, 2000). Much effort has been put into understanding the mechanism of soil erosion and predicting soil loss, and several empirical or process-based models have been constructed around the world (Merritt et al., 2003; Russell and William, 2001).
Over recent decades soil erosion by water has become a relevant worldwide issue, because of the progressive decrease of the ratio between natural resources and population and to climate change. Moreover, soils are more exposed to erosion for different reasons: inappropriate agricultural practices, deforestation, overgrazing, forest fires, and construction activities.
Most of models have been developed on the basis of field observations in the specific environmental contexts to which the models are applied. Physical models, ascribable to the category of quantitative approach models, adopt strict mathematical relationships. The process is described by means of relationships where, next to variables, some well-defined physical parameters are taken into account; their physical relevance can be assessed by means of direct and independent measurements. Physical models are an alternative to empirical and conceptual models,
*A. Cilek, S. Berberoglu : Cukurova University, Adana, Turkey
e-mail: [email protected] – [email protected]
and at present research efforts mainly focus on these models. Among physically based models, some very important ones are ANSWERS (Beasley et al., 1980); the WEPP (Water Erosion Prediction Project) model (Nearing et al., 1989); SHE–SED (Wicks and Bathurst, 1996) which is an integrated module of the ‘Système Hydrologique Européen’ (Abbott et al., 1986); EuroSEM (European Soil Erosion Model) (Morgan et al., 1990); and PESERA (Pan-European Soil Erosion Risk Assessment) (Gobin et al., 2003).
In respect to increases of greenhouse emissions due to anthropogenic effects, The Intergovernmental Panel on Climate Change (IPCC) has developed different climate scenarios within its 5th Assessment Report. These scenarios are called ‘Representative Concentration Pathways’ (RCPs) because they were developed to be ‘representative’ of possible future emissions and concentration scenarios published in the existing literature. Four RCPs scenarios were selected with prescribed CO2 concentrations reaching 421 ppm (RCP2.6), 538 ppm (RCP4.5), 670 ppm (RCP6.0), and 936 ppm (RCP 8.5) by the year 2100 (Australian Government, 2014).
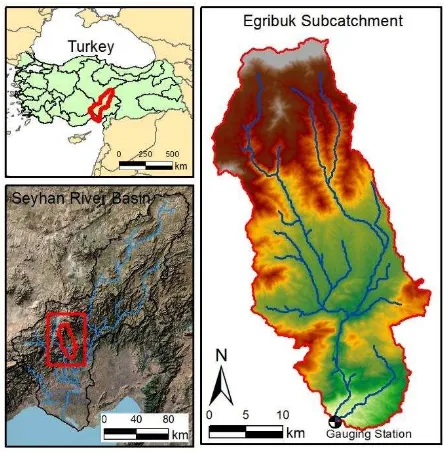
2. MATERIAL AND METHODS 2.1 Study Area
Mediterranean climate near the coast-mild, wet winters, and long, hot, arid summers with almost constant drought from May to September. The prevailing climate is characterized by Mediterranean with a mean annual precipitation of approximately 800 mm. The mean annual temperature is 19 °C (Donmez et al, 2015). The dominant soil types are Red-Brown Forest and Red Mediterranean Soils. The geological structure of the study area is characterized by karstic systems. This structure is a landscape formed from the dissolution of soluble rocks including limestone and dolomite (Donmez et al, 2011).
2.2 Material
In total 128 data layers derived from data on climate, topography, land use, crop type, planting date, and soil characteristics, are required to run the model. For climate characteristics the model makes use of the meteorological data from Turkish State Meteorological Service at approximately 8 climate stations data and further interpolated to a 100 m grid size. Future climate maps were obtained from WorldClim research group with 1-km spatial resolution which were based on climate projections from global climate models (GCMs) for the RCP 4.5 which was one of the most recent GCM climate projections defined in the IPCC Fifth Assessment report. The GCM output was downscaled and calibrated (bias corrected) as baseline 'current' climate (Hijmans et al., 2005; WorldClim, 2013). Soil hydrological characteristics were derived from the Soils Database of Turkey at 100 m grid size, and initial ground cover was estimated from the CORINE land cover data (CLC2009) at 100 m resolution, in combination with cereal planting dates to provide parameters for a crop growth model. The GTOPO30 Digital Elevation Model from the Aster Satellite was used to characterise the topography at 100 m resolution.
Figure 1. Location of study area
2.3 Methods
The method used in this study consisted two phases: i) estimation of soil erosion under climate change scenarios ii) assessment of the hydrological runoff processes.
2.3.1 PESERA Model
The Pan-European Soil Erosion Risk Assessment (PESERA) provides a more physics-based estimate of soil erosion by water across Europe than the other models, and has been developed to provide a state of the art soil erosion risk assessment at European scale (Kirkby et al., 2000, 2003, 2004). In this paper we modelled the soil erosion estimates using the PESERA model at 100 m resolution for the Seyhan River Basin. According to the model documentation, soil erosion predicted by PESERA is expressed as the sediment delivered to the base of the hillside. Permanent gully, channel erosion, channel delivery processes and channel routing are explicitly not considered (Kirkby et al., 2004). Soil erosion (E; t ha−1 yr−1) in the PESERA model is calculated as:
E= k Δ Ω (1)
Where, k stands for erodibility based on land use, soil parameters and vegetation cover, Δ stands for the topographic potential based on a digital elevation model, and Ω stands for the runoff and climate/vegetation soil erosion potential based on gridded climate data, vegetation cover, water balance and a plant growth model. A simple storage threshold model is used to convert daily rainfall to daily total overland flow runoff. Sediment transport to the base of the hillside is estimated as the product of soil erodibility and a power law function of runoff discharge and slope gradient. Finally, daily rates of soil erosion are integrated over the frequency distribution of daily rainfalls to estimate long-term average soil erosion rates. (Kirkby et al., 2003; de Vente et al, 2008).
Soil
(6 parameters)
Land Use/Cover
(25 parameters)
Climate
(96 parameters)
including Climate Change Scenarios RCP
4.5)
Topography
(1 parameter)
PESERA Model
RESULTS
(Sediment, Runoff) Validation
Data Analysis
Figure 2. The flow chart of the methodology and procedures
Figure 3. Schematic hydrological sub-model within the PESERA model (Kirkby et al. 2010).
Climate data
The Climate database provides daily time series of rainfall, temperature and potential evapotranspiration, interpolated to a 100 m grid for study area. These data have been analysed to provide the following monthly data layers for the model:
1. Rainfall: number of rain days, mean rain per rain day and its standard deviation to provide the distribution of daily rainfalls.
2. Temperature: mean, mean maximum and mean minimum
required only in areas where there is soil freezing or snowfall. 3. Potential evapotranspiration: estimates of actual evapotranspiration, plant production and water balance (Kirkby et al., 2004).
These data between 1975 and 2010 has computed an interpolated version of the 100 m resolution, using thin plate smoothing splines methods. The mean monthly rainfall data were given Figure 4 as an example.
Land cover
Land use for PESERA is based on CORINE land cover at 100 m resolution (Figure 4). This provides a suitable baseline for calculating soil erosion estimates. CORINE 2009 have eventually become available to produce the land use/cover estimates. Land use data are combined with cereal planting dates, generalised from the Sage University of Wisconsin Crop Calendar Database, to provide the parameters for a crop or natural vegetation growth model.
Soil
The Soil Database, compiled by the Pedotransfer rules, has been used to provide a consistent level of soils data at 100 m resolution across study area (Figure 4). The database has been used to provide three data layers for the model:
a. Soil erodibility, which converts runoff to erosion rates using the power law for sediment transport.
b. Readily available Soil Water Capacity, which provides the maximum storage capacity of the soil before runoff, occurs under vegetation.
c. Crustability, which sets the lower limit of storage capacity for a crusted soil in unvegetated areas (Kirkby et al., 2004).
Topography
DEM has been available from ASTER for some years, and has provided the topographic basis for work on PESERA, and for the erosion map (Figure 4). The critical parameter for the model is local relief, which has been estimated from DEMs as the standard
deviation of elevation within a circle of 300 m diameter around each cell.
Figure 3. Some example data used in model [CORINE Land Cover Map (100: Artificial land, 210: Arable land, 231: Pastures and grassland, 240: Heterogeneous agricultural land,
310: Forests, 320: Scrubs, 330: Bare land 334: Degraded forests, 400; Water surfaces and wetland) Soil Name (BA: Calcaric Cambisol, B: Cambisol, JC: Calcaric Fluvisol, LC:
Chromic Luvisol)]
3. RESULTS
PESERA model provided the results of monthly/annual soil loss and monthly runoff. In this paper, the result of annual, monthly soil loss and runoff for different land use/cover types under climate change scenarios are discussed.
3.1 Annual Soil Loss
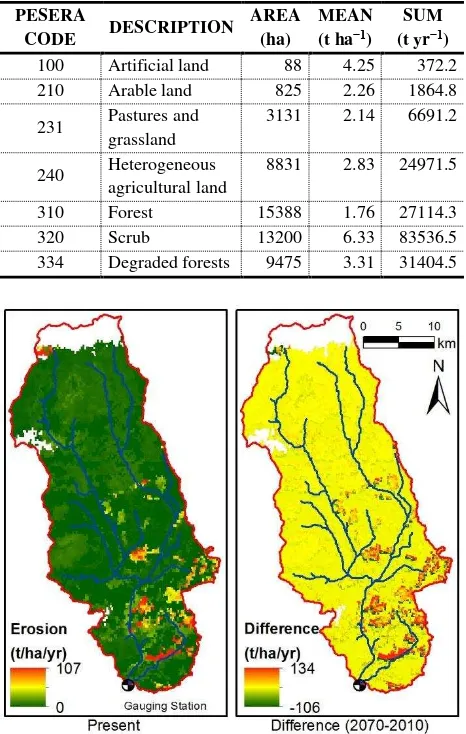
spatial and temporal distribution of erosion amount in t ha−1 yr−1. The amount of soil loss from the surface of the area in a year is estimated as 178 thousand tons. Estimated present and future annual erosion ranged from approximately 0–107 t ha−1 yr−1 and 0–145 t ha−1 yr−1 respectively. Using the PESERA model, we obtained an annual subcatchment mean erosion of 3.44 and 4.35 t ha−1 yr−1 for present and future climate change scenarios, and the erosion increased by 46,312 t yr−1 under the RCP 4.5 scenario of the IPCC Fifth Assessment Report for this area.
According to model results of PESERA Land Cover, the highest erosion risk areas were calculated to be scrubland and degraded natural vegetation, whereas the lowest erosion risk areas were estimated to be forest, pasture and grassland. In bare grounds, wetlands and water surfaces calculated the amount of any erosion (Table 1).
This clearly shows that 19% of total erosion results from the agricultural areas. It was estimated that 64% of the erosion is in the scrub and degraded forest areas, 17% of the remaining part is also in forests and urban areas.
Table 1. Annual erosion estimations for PESERA Land Cover class
PESERA
CODE DESCRIPTION
AREA (ha)
MEAN (t ha−1)
SUM (t yr−1) 100 Artificial land 88 4.25 372.2
210 Arable land 825 2.26 1864.8
231 Pastures and grassland
3131 2.14 6691.2
240 Heterogeneous agricultural land
8831 2.83 24971.5
310 Forest 15388 1.76 27114.3
320 Scrub 13200 6.33 83536.5
334 Degraded forests 9475 3.31 31404.5
Figure 5. Present Annual erosion and Annual differences in present and future estimated erosion for Egribuk Subcatchment
Annual erosion changes were investigated for all seven land cover types described in Figure 6. The largest annual decrease in erosion over time (22,562 t yr-1) occurred in forests. Arable land and heterogeneous agricultural land were less affected by climate change with an annual increase of 210 and a decrease of 2,857 t yr-1,respectively. The erosion estimations declined for four land
cover classes as a result of climate change; however, arable land, scrubland and degraded forests increased in the future as a result of a rise in temperature and heavy rains in the short-term.
Figure 6. Total erosion of the PESERA land use classes of the Egribuk Subcatchment estimated using the PESERA model.
Monthly soil loss
Present and future monthly change of estimated erosion are shown in Figure 7. The monthly estimates of erosion increased from August to January during the autumn season in the entire basin, due to heavy rain and high runoff. However, there was a sharp decrease in erosion during the winter season.
Figure 7. Monthly changes in estimated total erosion under present and future climates
Model results showed that the highest erosion amounts were estimated in December, whereas the lowest were estimated in June. On the other hand, in the future, the lowest erosion amount was calculated in August, when temperatures are high and rainfall does not occur (Table 2).
Table 2. Mean total erosion of monthly results of the Seyhan Watershed
Present Future
Months
Monthly Erosion Monthly Erosion
(t ha−1m−1) (t m−1) (t ha−1m−1) (t m−1)
Mean Total Mean Total
January 6.25 26695 10.27 43886
February 2.46 10505 4.56 19491
March 2.74 11700 3.12 13323
April 1.41 6033 1.87 8001
May 1.14 4882 1.63 6984
July 0.74 3153 1.21 5163
August 0.83 3543 0.66 2827
September 1.59 6790 2.66 11351
October 3.41 14582 4.64 19841
November 8.36 35726 7.36 31450
December 12.22 52233 13.69 58539
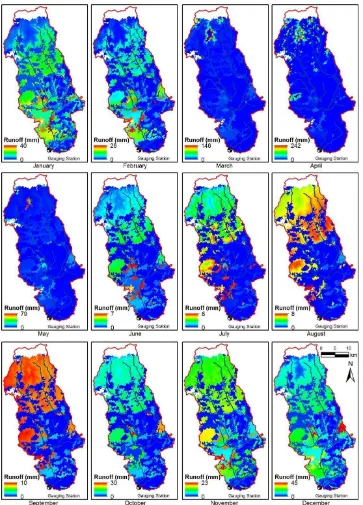
3.2 Runoff
Present and future monthly change of estimated runoff are shown in Figure 8. The graph shows that a significant increase was determined from August to January, within the autumn season, in the entire basin. Slight changes in runoff were realised from April to July until a dramatic decrease occurs in August.
Figure 8. Monthly changes in estimated total runoff under present and future climates
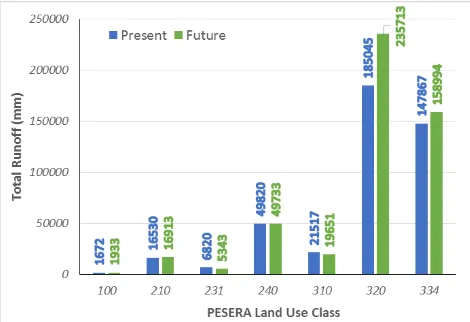
Monthly runoff changes in land cover classes of the Egribuk subcatchment were estimated with the PESERA model (Figure 9). The highest runoff was observed in the scrubland cover class for both the present and the future. Total runoff was estimated to noticeably increase in scrubland and degraded forests. On the other hand, there was a slight decrease of runoff in pasture and grassland, and forest land cover classes, under climate change scenarios (Figure 10).
Figure 10. Total runoff of the PESERA land use classes of the Egribuk Subcatchment estimated with the PESERA model
4. DISCUSSION
The focus of this study is to estimate the temporal and spatial distribution of soil erosion under climate change scenarios in the study area. The spatial distribution of simulated erosion hints at hotspots in the mountainous zones covered by shrub and degraded forests. This was caused by the combination of high-relief energy and relatively high annual precipitation. At the same time, the vegetation density is not high enough to protect the soil from erosion, which is partly a result of overgrazing and afforestation.
The process of bank erosion is not considered in PESERA; thus, the results are not valid here. In conclusion, the PESERA model is applicable with the given database. However, calibration is necessary and afterwards, the simulated soil loss rates as well as the spatial distribution are reasonable. The measured soil loss data would be of great importance to validate the model; further research should focus on this point (Klose, 2009).
The climate change scenarios that were obtained from WorldClim research group which were based on climate projections from global climate models (GCMs) for the RCP 4.5 are used in this study. The global average warming and precipitation increases for the last 20 years of the 21st century relative to the period 1986-2005 are +1.1°C/+2.1% for RCP2.6, +2.4°C/+4.0% for RCP4.5, +2.5°C/+3.3% for RCP6.0 and +4.1°C/+4.6% for RCP8.5, respectively (Baek et al. 2013). Together with an increase in the coefficient of variation of the daily precipitation, this hints to more intense rainfall events. In terms of erosion, Turkish soils are under a serious risk due to hilly topography, soil conditions facilitating water erosion (i.e.fine texture, low organic matter, poor plant coverage due to semi-arid climate), and inappropriate agricultural practices such as excessive soil tillage and cultivation of steep lands. This widespread problem threatens the sustainability of agricultural productivity in Mediterranean basins where economically important diverse crops are produced (Irvem et al. 2007) Land degradation by soil erosion is a serious problem in Turkey with an estimated soil loss of 46 million tons and 30% of total erosion result from the agricultural lands (Cilek, 2013).
In terms of erosion, Turkish soils are under a serious risk due to hilly topography, soil conditions facilitating water erosion (i.e. fine texture, low organic matter, poor plant coverage due to semi-arid climate), and inappropriate agricultural practices such as excessive soil tillage and cultivation of steep lands. This widespread problem threatens the sustainability of agricultural productivity in the Seyhan and similar basins of the Mediterranean (southern Europe and North Africa) where economically important diverse crops are produced.
ACKNOWLEDGEMENTS
We would like to acknowledge the research project grants (project no: 110Y338) from the Scientific and Technological Research Council (TUBITAK) of Turkey and the Scientific Research Project Administration Units of Cukurova University.
REFERENCES
Abbott, M. B., Bathurst, J. C., Cunge, A. J., O’Connel, P. E. and Rasmussen, J. 1986. ‘An introduction to the European Hydrological System – Système Hydrologique Européen, ‘‘SHE’’, 1. History and philosophy of a physically-based distributed modelling system’, Journal of Hydrology, 87, 45– 59.
Angima AD, Stott DE, O’Nell MK, Ong CK,Weesies GA. 2003. Soil erosion prediction using RUSLE for central Kenyan Highland conditions. Agriculture, Ecosystems and Environment 97: 295–308.
Baek, H.-J., J. Lee, H.-S. Lee, Y.-K. Hyun, C. Cho, W.-T. Kwon, C. Marzin, S.-Y. Gan, M.-J. Kim, D.-H. Choi, J. Lee, J. Lee, K.-O. Boo, H.-S. Kang, and Y.-H. Byun. 2013. Climate change in the 21st century simulated by HadGEM2-AO under representative concentration pathways. Asia-Pacific Journal of Atmospheric Sciences 49:603-618.
Beasley, D. B., Huggins, L. F. and Monke, E. J. 1980. ‘ANSWERS: A model for watershed planning’, Transactions of the American Society of Agricultural Engineers, 23, 938– 944.
Bergsma, E., 1974. Soil erosion sequences on aerial photographs. ITC Journal 1974 (3), 342–376.
Cilek, A., 2013. Erosion modelling in Turkey using Spatial Information system. Çukurova University, Institute Of Natural And Applied Sciences, Department Of Landscape Architecure, MSc Thesis. 145 pp.
de Vente, J., Poesen, J., Verstraeten, G., Van Rompaey, A., Govers, G., 2008. Spatially distributed modelling of soil erosion and sediment yield at regional scales in Spain. Global and Planetary Change 60 (3–4), 393–415.
Donmez, C. 2012. Modelling and investigating the upper-seyhan river basin ecosystem variables and their interactions under the climate change. Çukurova University, Institute of Natural And Applied Sciences, Department Of Landscape Architecure, Phd Thesis. 289 pp.
Donmez, C., S. Berberoglu, Curran, P.J. 2011. Modelling the current and future spatial distribution of NPP in a Mediterranean watershed. Int. J. Appl. Earth Observ. Geoinf. (2011), doi:10.1016/j.jag.2010.12.005
Donmez, C., S. Berberoglu, M. A. Erdogan, A. A. Tanriover, and A. Cilek. 2015. Response of the regression tree model to high resolution remote sensing data for predicting percent tree cover in a Mediterranean ecosystem. Environ Monit Assess 187:4151. DOI:10.1007/s10661-014-4151-5
Tillage for Sustainable Agriculture, University of Florida, Gainesville, FL, USA, June 24-26, pp. 23-27.
Gobin A, Cerdan O, Govers G. 2003. In Pan European Soil Erosion Risk Assessment – 3rd Annual Report – EU 5th Framework Programme, Project No. QLK5-CT-1999-01323. Chapter 4. Available at: http:// eusoils.jrc.it
Hijmans, R.J., S.E. Cameron, J.L. Parra, P.G. Jones and A. Jarvis, 2005. Very high resolution interpolated climate surfaces for global land areas. International Journal of Climatology 25: 1965-1978.
Irvem, A., F. Topaloğlu, and V. Uygur. 2007. Estimating spatial distribution of soil loss over Seyhan River Basin in Turkey. Journal of Hydrology 336:30-37
Jones, R.G.B., Keech, M.A., 1966. Identifying and assessing problem areas in soil erosion surveys using aerial photographs. Photogrammetric Record 5 (27), 189– 197. King, C., Delpont, G., 1993. Spatial assessment of erosion: Erosion Risk Assessment. Deliverable 5: PESERA Model Strategy, Land Use and Vegetation Growth, European Soil Bureau. http://eusoils.jrc.it/.
Kirkby, M.J., Irvine, B., Poesen, J., Borselli, L., Reed, M. (2010). ‘Improved process descriptions integrated within the PESERA model in order to be able to evaluate the effects of potential prevention and remediation measures’ DESIRE Report 75 D5.2.1
Kirkby, M.J., Irvine, B.J., Jones, R.J.A., Govers, G., the PESERA team (2008) ‘The PESERA coarse scale erosion model for Europe: I –Model rationale and implementation’ European Journal of Soil Science 59: 1293-1306.
Kirkby, M.J., Jones, R.J.A., Irvine, B., Gobin, A., Govers, G., Cerdan, O., Van Rompaey, A.J.J., Le Bissonnais, Y., Daroussin, J., King, D., Montanarella, L., Grimm, M., Vieillefont, V., Puigdefabregas, J., Boer, M., Kosmas, C., Yassoglou, N., Tsara, M., Mantel, S., Van Lynden, G., 2004. Pan-European Soil Erosion Risk Assessment: The PESERA Map, Version 1 October 2003. Explanation of Special Publication. No.73 (S.P.I.04.73). European Soil Bureau Research Report No.16, EUR 21176, Office for Official Publications of the European Communities, Luxembourg. Kirkby, M.J., Le Bissonais, Y., Coulthard, T.J., Daroussin, J.,
McMahon, M.D., 2000. The development of land quality indicators for soil degradation by water erosion. Agriculture, Ecosystems & Environment 81 (2), 125–135.
Klose, A. 2009. Soil characteristics and soil erosion by water in a semi-arid catchment (Wadi Drâa, South Morocco) under the pressure of global change. (Phd thesis) Angefertigt mit Genehmigung der Mathematisch-Naturwissenschaftlichen Fakultät der Rheinischen Friedrich-Wilhelms-Universität Bonn.
Merritt WS, Letcher RA, Jakeman AJ. 2003. A review of erosion and sediment transport models. Environmental Modelling & Software 18: 761–799.
Morgan, K.M., Napela, R., 1982. Application of aerial photographic and computer analysis to the USLE for area-wide erosion studies. Journal of Soil and Water Conservation 37 (6), 347– 350.
Morgan, R.P.C., Quinton, J.N., Rickson, R.J., 1990. Structure of the soil erosion prediction model for the European community. Proceedings of International Symposium on Water Erosion, Sedimentation and Resource Conservation, 9–13 Oct 1990, Dehradun, India. Central Soil and Water
Conservation Research and Training Institute, CSWCRTI, Dehradun, India, pp. 49–59.
Nearing, M. A., Foster, G. R., Lane, L. J. and Finckner, S. C. 1989. ‘A process-based soil erosion model for USDA-Water Erosion Prediction Project technology’, Transactions of the American Society of Agricultural Engineers, 32, 1587–1593. Oldeman, L.R., Van Engelen, V.W.P., Pulles, J.H.M., 1990. The extent of human induced soil degradation. In: Oldeman, R.L., Hakkeling, R.T.A., Sombroek, W.G. (Eds), Annex 5 of World Man of the Status of Human-Induced Soil Degradation: An Explanatory Note, second ed. International Soil Reference and Information Center, Wageningen, Netherlands.
Russell SH, William WD. 2001. Landscape Erosion and Evolution Modelling. Kluwer Academic/Plenum Publishers: New York, NY.
Siakeu, J., Oguchi, T., 2000. Soil erosion analysis and modelling: a review. Transactions of the Japanese Geomorphological Union 21 (4), 413–429.
Siakeu, J., Oguchi, T., 2000. Soil erosion analysis and modelling: a review. Transactions of the Japanese Geomorphological Union 21 (4), 413–429.
Stanley SW, Pierre C. 2000. US soil erosion rates—myth and reality. Science 289: 248–250.
Stephens, P.R., MacMillan, J.K., Daigle, J.L., Cihlar, J., 1985. Estimating universal soil loss equation factor values with aerial photography. Journal of Soil and Water Conservation 40 (3), 293– 296.
Van Rompaey, A.J.J., Govers, G., 2002. Data quality and model complexity for regional scale soil erosion prediction. Geomorphology 16 (7), 663– 680.
Van Rompaey, A.J.J., Govers, G., 2002. Data quality and model complexity for regional scale soil erosion prediction. Geomorphology 16 (7), 663– 680.
Vrieling, A. 2006. Satellite remote sensing for water erosion assessment: A review. Catena 65:2-18.
Wicks, J.M., Bathurst, J.C., 1996. SHESED: a physically based, distributed erosion yield component for the SHE hydrological modelling system. Journal of Hydrology 175, 213–238.
![Figure 3. Some example data used in model [CORINE Land Pastures and grassland, 240: Heterogeneous agricultural land, Calcaric Cambisol, B: Cambisol, JC: Calcaric Fluvisol, LC: Cover Map (100: Artificial land, 210: Arable land, 231: 310: Forests, 320: Scrubs, 330: Bare land 334: Degraded forests, 400; Water surfaces and wetland) Soil Name (BA: Chromic Luvisol)]](https://thumb-ap.123doks.com/thumbv2/123dok/3267201.1400671/3.595.307.538.106.546/grassland-heterogeneous-agricultural-calcaric-cambisol-cambisol-fluvisol-artificial.webp)