BUILT-UP AREAS EXTRACTION IN HIGH RESOLUTION SAR IMAGERY BASED ON
THE METHOD OF MULTIPLE FEATURE WEIGHTED FUSION
LIU Xin a, b,, ZHANG Ji-xian b, ZHAO Zheng b, MA Andong c a
Shandong Agricultural University, Shandong Tai’an, China – [email protected] b
Chinese Academy of surveying and Mapping, Beijing, China c
China University of Geosciences, Hubei Wuhan, China
Commission VI, WG VI/4
KEY WORDS: Airborne synthetic aperture radar Built-up areas Feature weighted fusion Gray symbiotic matrix Variogram
ABSTRACT:
Synthetic aperture radar in the application of remote sensing technology is becoming more and more widely because of its all-time and all-weather operation, feature extraction research in high resolution SAR image has become a hot topic of concern. In particular,
with the continuous improvement of airborne SAR image resolution, image texture information become more abundant. It’s of great
significance to classification and extraction. In this paper, a novel method for built-up areas extraction using both statistical and structural features is proposed according to the built-up texture features. First of all, statistical texture features and structural features are respectively extracted by classical method of gray level co-occurrence matrix and method of variogram function, and the direction information is considered in this process. Next, feature weights are calculated innovatively according to the Bhattacharyya distance. Then, all features are weighted fusion. At last, the fused image is classified with K-means classification method and the built-up areas are extracted after post classification process. The proposed method has been tested by domestic airborne P band polarization SAR images, at the same time, two groups of experiments based on the method of statistical texture and the method of structural texture were carried out respectively. On the basis of qualitative analysis, quantitative analysis based on the built-up area selected artificially is enforced, in the relatively simple experimentation area, detection rate is more than 90%, in the relatively complex experimentation area, detection rate is also higher than the other two methods. In the study-area, the results show that this method can effectively and accurately extract built-up areas in high resolution airborne SAR imagery.
Corresponding author
1. INTRODUCTION
The emergence of airborne high-resolution SAR image enriches the texture information in the building area, it also improves the complexity of the environment of the building area. There are bright spots, roads, vegetation and shadows in the construction area, which requires us to explore and adapt to the new method.
Texture classification includes two parts, feature extraction and feature classification, and feature extraction is the key factor of the classification effect. The texture classification method is the main method to extract the architectural area from the SAR image. At present, there are four main methods for texture feature description, which are statistical-based method, structure-based method, model-based method and filtering-based method. Wu Fan et al. extracted residential area filtering-based on SAR texture features extracted from the Gray Level Co-occurrence Matrix(GLCM)[1]. Zhao Ling-jun et al. proposed a method for extracting built-up areas from high-resolution SAR images based on variogram textural feature[2]. Xu Jia et al. proposed a method for build-up areas extraction using both grey-scale and texture features[3]. Tison C et al. revealed a new statistical model for Markovian classificati-on of urban areas in high-resolution SAR images[4]. In the above studies, a single texture description method based on statistical model is often used. Under the condition of high resolution, the Markov method is hard to accurately model the uneven region. The variation function method based on structural information has the advantages in the experiment, but the directional
information of the construction area is not considered, and the anisotropy of the variation function is ignored. Moreover, in the feature selection, the direct abandonment of the contribution of the smaller features, will inevitably lose part of the information. On this basis, a method of weighted fusion of comprehensive statistics and structure feature is proposed in this paper, and the built-up areas extraction from high resolution SAR image is realized.
2. PRINCIPLE AND METHOD
2.1 Texture analysis method based on gray level co-occurrence matrix
Gray level co-occurrence matrix is one of the most classical statistical methods, which is used to describe the texture of the texture by studying the spatial correlation of gray level. Level Co-occurrence Matrix Gray (GLCM) is defined as:
P i j d( , , )
P i j dk( , , )
N N(1) Where i is the line number of gray level co-occurrence matrix, j is the column number of the gray level co-occurrence matrix, D is the step size, M is the direction, N is the gray level of the image, K is the order number of pixels.
The gray level co-occurrence matrix is the basis of texture feature extraction, and then the feature amount of texture analysis is calculated by gray level co-occurrence matrix, and 5 features are listed in Table 1
.
Table 1 Commonly used texture features
features formula description
Mean
2.2 Texture analysis method based on Variogram
In the variation function theory, the variation function is used to measure the spatial correlation of the variables of the region. At any point, the variation function value is expressed as a random variable, at any two points, the corresponding random variable is usually not independent. The variation function can be defined as the variance of the difference between the two positions of the variable in space (two points, including distance and direction information), That is:
2
x h, Var f x h[ ( ) f x( )](2) In the practical application, the experimental semi - variation function is generally used to estimate the variation function that cannot be obtained directly: the calculation of the experimental semi - variation function, the direction of the points is fixed.
In fact, the Spatial position information can be reflected by the visual display of remote sensing data (such as SAR). In the image, each measurement value and the ground position can be linked through the presence of the function relationship. And in a certain neighborhood, the position relationship can also be determined with other measurement values. As a result, the sensor response is a regional variable, and the function is precisely to regionalized variables as the research object. Based on the above analysis, , the application of variation function is reasonable in the analysis of remote sensing image. We can calculate the experimental variogram values for each pixel on condition of a fixed h, and a picture of the texture feature map can be obtained by traversing the entire image.
2.3 Building area extraction method
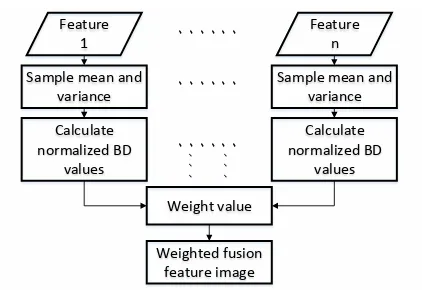
This paper presents the specific process of building area extraction method as shown in Figure 1. Concrete steps: first, the intensity image is filtered; Second, feature extraction based on gray level co-occurrence matrix and variation function. Third, according to the Bhattacharyya distance, the weight value is determined; Fourth, feature weighted fusion;
unsupervised classification used K-means clustering algorithm; Fifth, post processing. The determination of the parameters involved in feature extraction and fusion will be combined with the specific experimental procedure.
Figure 1 Build-up area extraction process
2.4 Texture feature weighted fusion method
Feature
Figure 2 Multi feature weighted fusion process The weight value is usually based on experience, or the manual allocation of expert vote, which joined too many manual intervention, will inevitably affect the credibility of the results. Weight is a part of the proportion of the contribution to the overall contribution, from its essence, this paper proposed the feature weight determination method combined with Bhattacharyya distance, in which bus distance formula is[4]:
two different classes in the same feature image. The size of BD determines the ability of distinguishing between two categories, the bigger the BD value.
image, then
p
i represents a weight value of a feature.3. EXPERIMENT
3.1 Data and preprocessing
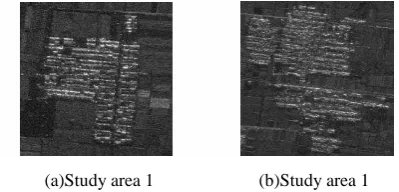
The airborne P band full polarimetric SAR image was obtained by the CASMSAR system, which is led by the Chinese Institute of Surveying and mapping, and its spatial resolution is 1m. Two
image blocks, which are 3 (a) (1000*1000) and 3 (b) (2000*2000), are used as the experimental regions. As shown in the figure, texture features of build-up areas in high resolution SAR image are more abundant, and towards and arrangement of the buildings are more obvious. This provides a priori knowledge for the direction selection when extracting features.
(a)Study area 1 (b)Study area 1 Figure 3 Study area
3.2 Determination of window size of gray level co-occurrence matrix
The window size is the key parameter, in order to determine the optimal window, we take the contrast and the variance as examples, carries on the experiment analysis. As shown in Figure 4, Considering that the large window will blur the edge information, so we choose the window size of 29*29.
Fig. 4 Relationship between sample mean and window size
3.3 Determination of texture parameters of variogram
The main parameters of the texture feature of the variation function are the direction and the texture spacing h. Taking into account the anisotropy of the variation function, the direction of the building in the experimentation area is basically east-west trend, we take 90 degree direction. When h changes, we get the texture variation function characteristic chart of different h values. As shown in Figure 5, we choose the variation function eigenvalues of the peak valley (h=13) as the classification feature.
Figure 5 Relationship between sample mean and h
3.4 Texture feature weight determination and fusion
In the study area, the samples of the construction zone and the non construction zone are selected, the normalized Bhattacharyya distance value is calculated, then the weight
value is calculated, and the weight value is integer, the results are shown in Table 2. Weighted fusion with band operation is used to obtain classification feature image.
Table 2 weight calculation built-up area Non-build-up area
1
1 2 2 BD BD p
Mean 0.4552 0.1132 0.2524 0.0604 0.6642 0.45 2
Contrast 0.3310 0.130
1 0.0886 0.0331 0.9751 0.66 3
Variance 0.2527 0.1164 0.0412 0.0200 1.0389 0.70 3 Entropy 0.7676 0.077
5 0.5374 0.0750 1.1376 0.80 4
Energy 0.3057 0.1104 0.1310 0.0457 0.6097 0.41 2 Variogram 0.0386 0.016
8 0.0019 0.0020 1.4721 1 5
3.5 Classification and post-processing
In this paper, the unsupervised classification of K means clustering algorithm is carried out, and the small patches in the classification results and the small cavities in large areas are removed and filled by the post-processing method.. The classification images are shown in Figure 6:
(a)fusion (b)post-processing
(c)statistic (d)structure
(e) fusion (f) post-processing
(g) statistic (h) structure
Figure 6 classification results and post-processing chart
3.6 Experimental results and accuracy
The build-up area in experimentation area 1 is relatively independent and complete. As shown in Figure 6 (a), the method presented in this paper can get better classification results, but in the high resolution image, shadow, open space,
especially the internal roads in the building area also has been portrayed. In order to illustrate the advantages of the method, in this paper, two sets of contrast tests are conducted, which are only considered the statistical features and the structural features, and the classification results are obtained as Figure 6 (c) and 6 (d). In Figure 6 (c), the external contour of the building area is better characterized, however, the right fields of the image were mistakenly divided into buildings due to the high gray value. In Figure 6 (d), we can see more information about the building area, especially the texture of the dark and white. The variation function takes into account the structural similarity of the surrounding ground objects, so that the error
Figure 7 Contour extraction diagram of experimentation area Further, the external contours of the building area are extracted, and then the vectors are displayed to the original image, as shown in Figure 7 (a), (b). Extraction results can coincide well with the actual area. In order to carry out the quantitative analysis, we also use the method in reference [5], the evaluation method proposed two measures of detection rate and false alarm rate, which can be expressed as:
DR AP 100%
Where AP= Pixels of correct classification EP = Pixels of error classification EN= Pixels of missing classification
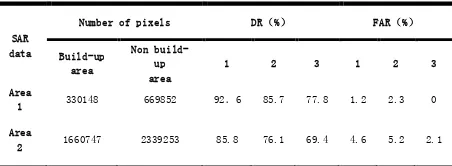
In the original image, the artificial method is used to extract the outline of the building area. The artificial extraction results are the criteria of the algorithm. The results are shown in Table 3:
Table 3 extraction accuracy contrast
SAR
From the comparison of the data in the table, this paper shows the superiority of the method. Specifically, especially for relatively simple experimentation area 1, the detection rate is more than 90%.Because of the high resolution, the variogram is more sensitive to the structure information of the dark and
white, and the detection rate is very low. The detection rate of the experimentation area 2 is lower, but the method is still better than the other two methods. From the above analysis, the detection rate of this method is higher than the other two methods. But it is worth noting that the false alarm rate of the method based on the structure is the lowest, and is lower than that of method proposed in this paper. This is determined by two factors, first integration makes the details not so obvious; furthermore in the treatment process, internal space and road is divided into the construction area. However, the method of this paper is to extract the overall range of the building area, then the false alarm rate caused by the above two reasons can accept. Therefore, this method can extract the building area outline of resolution, more rich texture information also put forward new requirements. This method combines the statistical texture features and texture features, considering the weight contribution and the Bhattacharyya distance, and the method of determining the weights is proposed, ultimately the built-up area extraction method based on the multi feature weighted Mapping and Geoinformation Research in the Public Interest (Project NO.: 201412010).
REFERENCE
WU Fan, WANG Chao, ZHANG Hong. Residential areas extraction in high resolution SAR image based on texture features [J]. Remote sensing technology and Application, 2005, 20(2):148-153.
ZHAO Ling-jun, GAO Gui, KUANG Gang-yao. Variogram-based Built-up areas extraction from high-resolution SAR images [J]. Signal Processing, 2009, 25(9):1433-1442.
Xu Jia, Chen Yuan-yuan, Huang Qi-hua. Built-up areas extraction in high resolution space-borne SAR Image based on the integration of grey and texture features [J]. Remote sensing technology and Application, 2012, 27(5):692-698.
Tison C, Nicolas J M, Tupin F, Maitre H. A new statistical model for Markovian classification of urban areas in high-resolution SAR images, IEEE Transactions on Geosicence and Remote Sensing, 2004, 42(10) 2046-2057.
Shufelt A. Performance evaluation and analysis of monocular building extraction from aerial imagery[J].IEEE Transactions on Pattern Analysis and Machine Intelligence. 1999, 21(4):311-326.
Solberg S, Jain A K. Texture fusion and feature Selection applied to SAR imagery [J]. IEEE Transactions on Geoseience and Remote Sensing, 1997, 35(2):475-479.
SHU Ning. Microwave remote sensing principle [M]. Wuhan: Wuhan University press, 2010.
HU Zhao-ling, LI Hai-quan, DU Pei-jun. Research on texture feature extraction and classification of SAR images [J]. Journal of China University of Mining and Technology, 2009, 38(3):422-427.
ZHU Jun-jie, GUO Hua-dong, FAN Xiang-tao. The application of the wavelet texture method to the classification of single-band, single-polarized and high-resolution SAR mages [J]. Land Resources Remote Sensing, 2005(2):36-39.
Lili Yan, Jixian Zhang, Guoman Huang and Zheng Zhao. Building Footprints Extraction from PolSAR Image Using Multi-Features and Edge Information [A]. 2011 International Symposium on Image and Data Fusion[C]. Tengchong, 9-11 August 2011:235-239.