Convergence and divergence in
consumer behaviour: implications
for global advertising
Marieke De Mooij
Cross Cultural Communications Company, the Netherlands
and University of Navarre, Spain
One aspect of globalisation is the convergence of income, media and technology, which in turn is expected to lead to homogeneous consumer behaviour. This convergence thesis is increasingly questioned. With converging national wealth there still is substantial variation of consumer behaviour across nations, which is not disappearing. Variation is found in all aspects of consumer behaviour: in consumption of packaged goods, in usage and ownership of durable goods, and in media behaviour. With disappearing differences of GNP per capita, culture is a powerful explaining variable. This paper provides evidence of divergence of consumer behaviour rather than convergence, it describes the influence of culture, how cultural variables can explain variance of consumption, and presents the consequences for international brand management and for global advertising.
INTRODUCTION
One aspect of globalisation is the convergence of income, media and technology. Many authors (e.g. Jain 1987; Czincota & Ronkainen 1993; Assael 1998; Bullmore 2000) expect this convergence to lead to homogeneous consumer needs, tastes and lifestyles. For example, cross-border music channels such as MTV, increased travel, and global communications have encouraged the notion of a ‘global teenager’ – that is, the notion that teenagers possess similar values, regardless of their country of origin (e.g. Assael 1998).
In his famous article titled ‘The globalization of markets’, Levitt (1983) argued that new technology would lead to homogenisation of consumer wants and needs because consumers were expected to prefer standard products of high quality and low price (as compared to more
International Journal of Advertising, 22, pp. 183–202 © 2003 Advertising Association
customised, higher priced products). His argument was based on the assumption that consumer behaviour is rational. Increasingly, however, scholars find that consumers are often not rational and do not make purchase decisions that maximise utility. The assumption of rationality is increasingly regarded as unrealistic and places consumers outside a cultural context (McCracken 1989; Süerdem 1993; Antonides 1998).
Until recently the impact of culture was not well understood. Ignoring culture’s influence has led many companies to centralise operations and marketing which, instead of increasing efficiency, has resulted in declining profitability. Several large multinational firms have seen their profits decline because centralised control lacks local sensitivity and are consequently changing their strategies from global to local. In addition, Coca-Cola decided in the year 2000 to move closer to local markets because of declining profitability. Coca-Cola’s
CEO was quoted in the Financial Times(27 March 2000) as stating that
‘We kept standardising our practices, while local sensitivity had become absolutely essential to success.’ Coca-Cola’s marketing chief stated that the firm’s ‘big successes have come from markets where we read the consumer psyche every day and adjust the marketing model every day’ (Byrnes 2000).
International marketers would like us to believe that in the ‘new Europe’ with a single currency, consumers will become more similar, will increasingly eat the same food, wear jeans and watch the same television programmes. Reality is different. There are wide differences among the value systems of consumers in different European countries – value systems that are rooted strongly in history and appear to be resistant to change. These differences were predicted to disappear with the single European market in 1992 and the advent of cross-border media, but to date they have not. Although there is evidence of converging economic and demographic systems in Europe, there is no evidence of converging value systems. On the contrary, there is evidence that consumer behaviour is diverging in Europe as reflected in the consumption, ownership and use of many products and services.
CONVERGENCE AND DIVERGENCE
anecdotal evidence. The empirical evidence that does exist is usually based on macro-developmental data, such as the numbers of telephones, television sets or cars per 1000 population. We found that, even with these data, only in a few cases can convergence be documented across European countries. In many other cases there are large consumption differences among countries that are stable over time, or countries are actually diverging. As people become more affluent, their tastes diverge. This finding is based on meta-analysis of time-series data of a large number of product categories across countries, using the coefficient of variation (CV), the standard deviation of a variable divided by its mean, as well as the mean per
cent convergence or divergence per year.1
In order to analyse the varying influence of national wealth, three groups of countries were compared: an economically heterogeneous group of 44 countries worldwide, an economically more homo-geneous group of 26 countries worldwide (GNP/capita > $8000) and an economically homogeneous group of 15 countries in Europe. The countries included in each group are listed in Appendix 1. The data used were obtained from annual reports of the World Bank, Eurostat, and the United Nations; statistical data collected by Euromonitor and
data from surveys such as Eurobarometer, Reader’s Digest, and the
European Media and Marketing Surveys (EMS). The results show, for example, that worldwide CVs varied from 1.53 for numbers of internet hosts per 1000 people to 0.51 for household cleaning products. There is greater heterogeneity worldwide than in Europe, where for 20 product categories reviewed (see Appendix 1) in 1997, CVs varied from 0.66 for sales of real jewellery per capita to 0.11 for television sets per 1000 population. Only three product categories had a CV below 0.20, a threshold that suggests convergence across countries: television sets per 1000 people (0.11), telephone main lines per 1000 people (0.17), and cars per 1000 people (0.18). Between 1960 and 1997, the CV for television sets per 1000 population decreased from 1.00 in 1960 to 0.30 in 1975 and to 0.11 in 1997, with a mean convergence of 2.4% per year. Simultaneously, though, radios per
1. Williamson and Fleming (1996, p. 354) express the mean convergence per year symbolically as follows:MC/year = [(CVt1– CVt2)/CVt1] × 100/(t2– t1) where
FIGURE 1 TV SETS PER 1000 IN EUROPE: CONVERGENCE
Source: UN Statistical Yearbooks
0
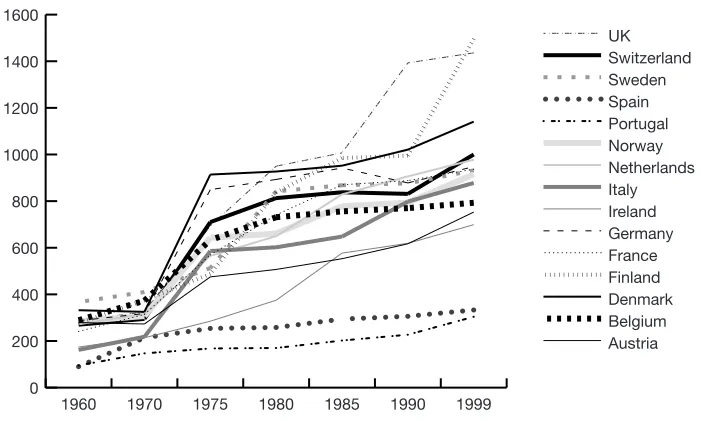
FIGURE 3 NEWSPAPERS PER 1000: STABLE DIFFERENCES
Source: UN Statistical Yearbooks
0
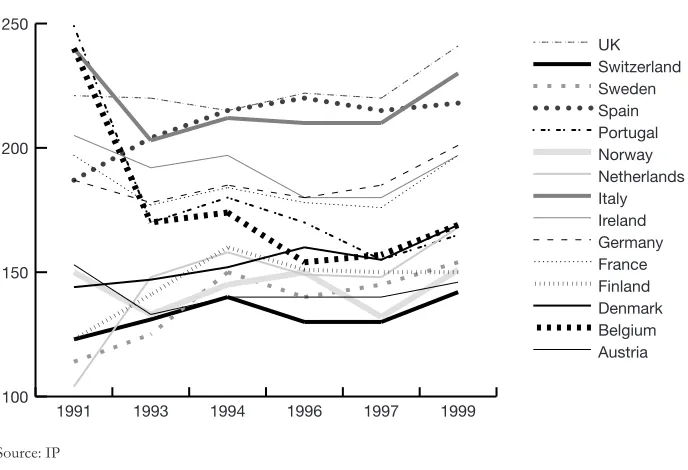
FIGURE 4 RADIOS PER 1000 IN EUROPE: DIVERGENCE
Source: UN Statistical Yearbooks
1 Footnote.
1000 population diverged and differences between countries with respect to newspaper circulation have remained stable over time. The CV for radios was 0.33 in 1960 and decreased to 0.24 in the next ten years; it then increased to 0.36. Between 1960 and 1997, the mean divergence of radios per 1000 population per year was 0.2%.
The above examples are all at macro level: ownership per 1000 population. More interesting are micro-level data: what people actually do with the products they own. Generally the distinction macro–micro refers to the level of aggregation. This distinction is not useful for comparative research across nations, as data at national level are all aggregate. We follow the distinction of Hunt (1976) and Peterson and Malhotra (2000) who describe micro-level data as being more concerned with buying behaviour of consumers, as opposed to
macro-level data being indicators of the macro-economic
environment of countries. Numbers of television sets per 1000 converge across countries, but there is variation of types of TV sets, and viewing time in particular varies considerably and diverges across Europe. In Europe between 1991 and 1999 daily viewing minutes have diverged with a mean divergence of 0.69% per year.
Countries have converged for the total number of passenger cars per 1000 population, but the distribution across populations, numbers owned per household or type of car owned, diverge. For durable products – in particular those related to wealth such as passenger cars, television sets and computers – initially, with increased wealth, countries converge, but in the developed world, at a certain level of wealth, convergence reaches a ceiling after which there is no further convergence and differences remain stable or increase. These ceilings are at different levels for different product categories. In Europe the lowest ceiling was at a CV of 0.11 for TV sets and the highest 1.60 for tea consumption. With converging wealth, convergence of consump-tion turns into divergence. For ‘old’ products such as newspapers and radio, that ceiling was reached long ago. New products such as computers have not yet reached a ceiling and differences between countries are still large. The point of convergence lies in the future, but it can be predicted by understanding the pattern of the old products.
worldwide (44), developed (26) and for Europe (15). In the long term, at macro level, products linked with economic development of countries converged fastest in the economically homogeneous Europe, while older, cheaper products such as radios and circulation of newspapers diverged.
In sum, both convergence and divergence take place at macro level, but to varying degrees in different regions. If products converge across countries, convergence is weakest in economically hetero-geneous regions and strongest in economically homohetero-geneous regions. Data for calculating convergence–divergence at micro level are not readily available worldwide. A few data are available for Europe, but only for shorter time spans. These data provide evidence of divergence. Table 2 presents divergence at micro level for five categories. The numbers of passenger cars per family between 1995 and 1999 (data EMS) diverged. For daily viewing minutes (data IP) countries converged between 1991 and 1993 and diverged after 1993. Newspaper readership in Europe, measured by the question ‘Did you read a newspaper yesterday?’ (McCann-Erickson) diverged between
TABLE 1 CONVERGENCE OR DIVERGENCE PER YEAR (%) AT MACRO LEVEL 1970–1998, PER 1000 POPULATION
Worldwide 44 Developed 26 Europe 15
Telephone main lines 1.42 2.16 2.40
Passenger cars 0.89 1.53 1.74
Television sets 1.50 1.61 2.26
Radios 1.18 1.48 0.31
Newspapers 0.00 0.15 0.37
Sources: UN Statistical Yearbooks and World Bank Development Reports.Boldindicates divergence.
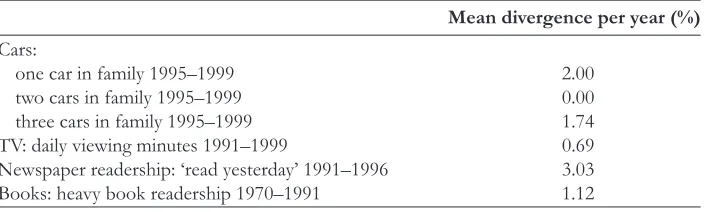
TABLE 2 DIVERGENCE PER YEAR (%) AT MICRO LEVEL (EUROPE
Mean divergence per year (%)
Cars:
one car in family 1995–1999 2.00
two cars in family 1995–1999 0.00
three cars in family 1995–1999 1.74
TV: daily viewing minutes 1991–1999 0.69
Newspaper readership: ‘read yesterday’ 1991–1996 3.03
Books: heavy book readership 1970–1991 1.12
1 Footnote.
1991 and 1996. Countries also diverged with regard to book reader-ship, measured by the question ‘Did you read more than 8 books (1970) or 12 books (1991) in the past year?’ (Reader’s Digest Surveys).
COMPARING COUNTRIES FOR INTERNATIONAL MARKETING AND ADVERTISING
Within countries socio-demographic and psychological factors tend to be used to explain consumption variations. For marketing purposes the most widely used comparison variable at country level is national wealth (GNP/capita), but as national wealth converges, its predictive or explanatory power declines. Although countries differ considerably with respect to GNP/capita when all countries in the world are considered, GNP/capita is converging among developed countries. To illustrate, using data from various United Nations statistical yearbooks, the coefficient of variation for GNP/capita was calculated to be 0.86 for 44 countries worldwide in 1997, whereas for 15 European
countries it was 0.33. Between 1960 and 1997 the mean divergence of
GNP/capita per year was 0.10% for the 44 countries whereas the
mean convergence of GNP/capita was 0.53% per year for the 15
European countries. Our analysis demonstrates that differences in national wealth can initially explain differences in ownership and usage of products across countries. At some point in time, when countries converge with respect to national wealth, the latter cannot serve as a variable for explaining variance. When that point is reached, culture becomes the only useful explaining variable.
culture. For example, culture has been shown to influence the volume of mineral water and soft drinks consumed, preferences for new or used cars, ownership of insurance products, possession of private gardens, readership of newspapers and books, television viewing, ownership of consumer electronics, use of the internet, use of cosmetics, deodorants, toothpaste and hair care products, and consumption of fresh fruit, ice-cream and frozen food as well as numerous other products and services (De Mooij 1998, 2001).
The influence of culture on consumption was analysed by
correlation and step-wise regression analyses2 using national wealth
(GNP/capita) and Hofstede’s cultural dimensions as independent variables and a variety of consumption and purchase behaviour data as dependent variables. Examples presented in this article are for the structure of private consumption, mineral water consumption and media.
CULTURE AND THE STRUCTURE OF PRIVATE CONSUMPTION
A first example is how culture explains variance of consumption categories as reflected in the structure of private consumption for 14 countries in Europe. Data are from Eurostat, the Statistical Office of the European Community. The examples are for 1999, but they are representative of a longer time span. The percentage of consumption
expenditures dedicated to food is negatively correlated (r = –0.66**)
with individualism. In collectivist cultures in Europe, people allocate a higher percentage of consumption expenditure to food than do people in individualist cultures. Generally, in collectivist cultures food has an important social function. Providing food and having food in the home for any guest who drops by is an important social value. The relationship between uncertainty avoidance and the need for being
well groomed was confirmed by the significant correlation (r= 0.58*)
between uncertainty avoidance and the percentage of consumption expenditures spent on clothing and footwear, a relationship that was stable over time.
1 Footnote.
Frequently mentioned examples of similar developments in Europe are ageing populations and similar increases in expenditures of services such as leisure activities (e.g. Leeflang & Van Raaij 1995). Leisure expenditures, however, do not converge. Between 1986 and 1999 in Europe the percentages of private income spent on leisure diverged with a mean divergence per year of 2.91%. In 1986, the CV was 0.23. Thirteen years later, in 1999, it was 0.37. The percentage was
negatively correlated with power distance (r = –0.72***) and with
uncertainty avoidance (r= –0.80***), and positively with individualism (r= 0.69***). A likely explanation is that free time is spent with family and relatives in the cultures of the configuration of large power distance, collectivism and strong uncertainty avoidance, whereas in individualist cultures of small power distance and weak uncertainty avoidance people spend more time on organised leisure activities. Other data, for example, demonstrate that playing active sports is related to weak uncertainty avoidance.
MINERAL WATER CONSUMPTION
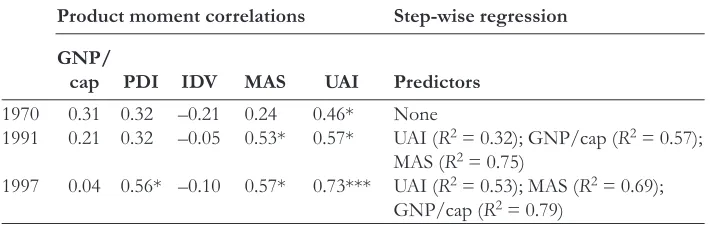
Although consumption of mineral water has increased everywhere in Europe, the differences across countries have remained similar since 1970 or have become even larger. In France, Germany, Italy and Belgium, all strong uncertainty avoidance cultures, people drink increasing volumes of mineral water, as compared to the UK and Scandinavia, cultures of weak uncertainty avoidance, where people have different perceptions of what is necessary for their health. As Table 3 shows, in 1970 only the need for purity, a value included in the uncertainty avoidance dimension, was related significantly to mineral water con-sumption. By 1991, masculinity/femininity was also related signifi-cantly to mineral water consumption, and by 1997 three of the five cultural variables (uncertainty avoidance, masculinity and power distance) were related significantly to mineral water consumption (see Appendix 2). Note that there was no relationship between national wealth and mineral water consumption in any of the three years examined.
1 Footnote.
MEDIA
Differences in media usage are persistent because the media are part of countries’ culture. Radio ownership in Europe is related to indivi-dualism: in 1997 48% of variance was explained by individualism. Over time the significance of the relationship has become stronger. While in collectivist cultures one radio per family is enough, in individualist cultures everyone wants his or her own radio. In the UK there are 1400 radios per 1000 people as compared with 330 per 1000 people in Spain. Newspaper circulation and readership are related to power distance. In 1996, 58% of variance of newspaper readership was explained by small power distance. In the more egalitarian cultures people read more newspapers. In 1991 52% of variance of heavy book readership was explained by individualism. Measurement of book readership by Eurobarometer in 1992 (answers to question ‘Did you read a book last week?’) shows an even stronger relationship: 65% of variance was explained by individualism. In individualist cultures people are more verbally oriented, while in collectivist cultures people are more visually oriented. In the collectivist cultures television is a more important medium than the press. New media and technology are converging at macro level, but differences at micro level emerged soon after introduction. Internet penetration (numbers of hosts per 10,000 population) converges, but the way the internet is used varies.
TABLE 3 MINERAL WATER CONSUMPTION ACROSS EUROPE (15 COUNTRIES)
Product moment correlations Step-wise regression
GNP/
cap PDI IDV MAS UAI Predictors
1970 0.31 0.32* –0.21 0.24* 0.46*** None
1991 0.21 0.32* –0.05 0.53* 0.57*** UAI (R2= 0.32); GNP/cap (R2= 0.57); MAS (R2= 0.75)
1997 0.04 0.56* –0.10 0.57* 0.73*** UAI (R2= 0.53); MAS (R2= 0.69); GNP/cap (R2= 0.79)
Sources: Hofstede (1991) and:
1970:Reader’s Digest(1970): drink taken in the past year: mineral springwater. 1991:Reader’s Digest(1991): drinking mineral water almost every day. 1997:Euromonitor(1997): litres/capita sales total mineral water in 1996.
1 Footnote.
CONSEQUENCES FOR INTERNATIONAL BRAND MANAGEMENT
Several aspects of branding vary by culture. An important difference is the brand type used in marketing strategy. Company brands are more customary in Asia while the product brand is a more Western, individualist phenomenon. Differentiation and positioning strategies are Western phenomena and product brands are developed for positioning purposes, both against the competition and against other brands of the company’s brand portfolio. In Asian, collectivist cultures an important purpose of marketing communications is to build relationships and trust between companies and consumers, and developing strong company brands is a better strategy than developing a portfolio of competitive product brands.
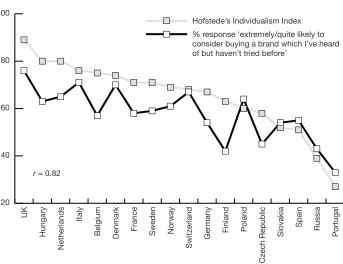
Increasingly, brands are made into personalities, analogous to human personalities. The study of personality, however, has developed within a European–American cultural framework with individualist assumptions of a unique personality that exists separate from its environment. In collectivist psychology the ego is inseparable from its social context, the family or the group to which people belong and that define their identity. A survey by Reader’s Digest(2001, 2002) asked people in 18 different countries in Europe (see Appendix 1) which brands they trust most in 18 different categories. Other questions were about personal traits and the probability of buying unknown brands. Analysis of the results demonstrates that in individualist cultures people are more likely to buy unknown brands than in collectivist cultures. The brand concept as such may be less relevant to members of collectivist cultures than to members of individualist cultures where the brand functions as a unique personality (Figure 5). The personal traits measured in the survey also vary by culture. This fits
with findings by Hofstede and McCrae (Marsella et al.2002), who are
1 Footnote.
UNEXPECTED EFFECTS OF GLOBAL ADVERTISING
Of the fast-moving consumer goods (fmcg) categories included in our analysis only three have become relatively homogeneous: household cleaning products, soft drinks and cigarettes. Initially, the use of these products in Europe converged with converging incomes, but this stopped at a certain level.
In particular the soft drink and cigarette categories have long been dominated by Anglo-American global brands (e.g. Coca-Cola, Pepsi-Cola, Fanta, Seven-Up, Sprite, Schweppes; Marlboro, Camel, Rothmans). These early global brands may have caused convergence of their product category because they were the first to apply advanced marketing techniques. With increased global competition the owners of these brands started to standardise their marketing and
FIGURE 5 THE BRAND CONCEPT AND INDIVIDUALISM
r = 0.82
Source: Reader’s Digest Trusted Brands (2002)
20 40 60 80 100
Hofstede’s Individualism Index % response ‘extremely/quite likely to consider buying a brand which I’ve heard of but haven’t tried before’
Portugal
Russia
Spain
Slovakia
Czech Republic
Poland
Finland
Germany
Switzerland
Norway
Sweden
France
Denmark
Belgium
Italy
Netherlands
Hungary
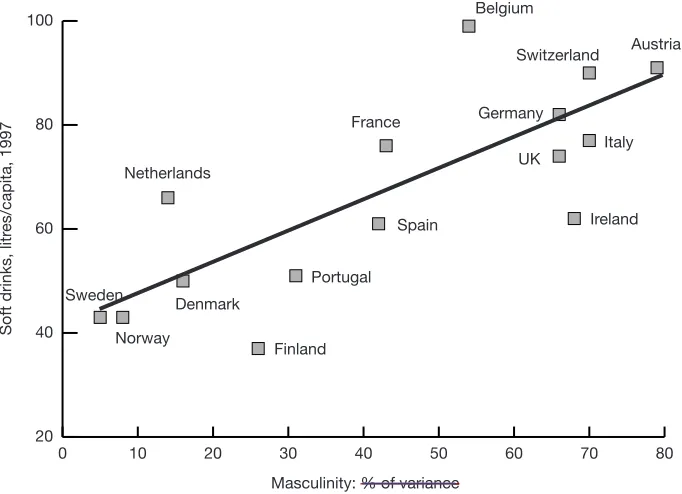
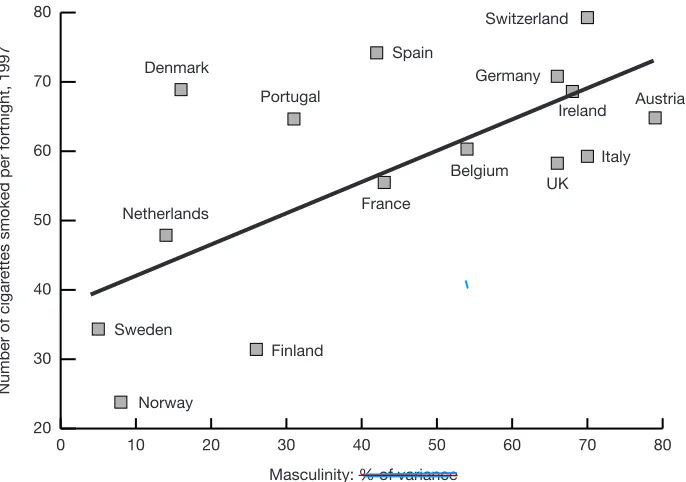
advertising for increased efficiency. Global advertising, however, does not appeal to universal values because there are no universal values. Since many global advertising campaigns are developed in London or New York, they generally include Anglo-American values. For decades the global campaigns for soft drinks and cigarettes have reflected Anglo-American values such as masculinity, adventure, status and success, which are not as appealing to all other cultures. This is reflected in the differences in volume sales across countries. In Europe (data: Euromonitor 1997), 60% of variance of soft drink consump-tion (litres per capita) is explained by Hofstede’s cultural dimension masculinity (r= 0.78***, Figure 6). For cigarettes (data: Eurostat 1997) it is 44% (r= 0.66***, Figure 7).
Thus the result of global advertising is other than intended. Global advertising may have stopped the convergence process of the product category and causedthe current differences in usage. In countries with values that differ from Anglo-American values, standardised adverti-sing campaigns have resulted in sub-optimisation of sales. Just as
FIGURE 6 SOFT DRINKS AND MASCULINITY
Masculinity: % of variance
Soft drinks, litr
es/capita, 1997
Netherlands
Sweden
Norway
Denmark
Finland Portugal
Spain France
Belgium
Austria
Ireland Italy UK
Germany Switzerland
Source: Euromonitor (1997) and Hofstede (1991)
0 10 20 30 40 50 60 70 80
1 Footnote.
consumer motives and needs are not the same across countries, so the effect of global advertising is not the same in all countries. There is waste in countries where consumer values are different from the values in global advertising campaigns.
The idea that there are universal values that can be used for global advertising is one of the global marketing myths of past decades. Another myth of global marketing is the assumed existence of global communities such as global teenagers who, across countries, would have more in common with each other than with people of their own country. The differences with respect to soft drinks consumed every day by 15-year-old students (Eurostat 2001) are similar to differences for the general public. Over time, values of young people follow a similar pattern as values of grown-ups. An example is general life satisfaction, as measured by Eurobarometer for past decades. Systematically the Danes are happier than the Belgians and the Portuguese. Surveys among young people show the same pattern.
FIGURE 7 CIGARETTES AND MASCULINITY
Masculinity: % of variance
Number of cigar
ettes smoked per fortnight, 1997
Netherlands
Sweden
Norway Denmark
Finland Portugal
Spain
France
Belgium
Austria Ireland
Italy UK Germany
Switzerland
Source: Eurostat Yearbook (1998/1999) and Hofstede (1991)
0 10 20 30 40 50 60 70 80
1 Footnote.
CONCLUSION
Some of the myths surrounding global marketing and advertising are convergence of consumer behaviour, the existence of universal values and global communities with similar values. This article has discussed these myths, focusing particularly on assumed convergence of consumer behaviour. Although for some durable products and new technologies, at macro level (ownership of products per 1000 people), countries converge, it is the case that countries tend to diverge with respect to how people use these products. Over time consumption differences between countries are stable or they increase. These differences can be explained by culture. Analysis of the influence of income or culture on consumption at country level over time shows that when countries converge with respect to national wealth, cultural variables increasingly explain the differences in country-level behaviour. The model developed by Hofstede explains most of the variation of consumption and consumer behaviour across countries and enables marketing executives to quantify the effects of culture. The persistence of cultural variety of countries worldwide as well as in Europe implies that a successful advertising approach in one country does not automatically mean similar success in other countries.
APPENDIX 1
The group of 44 countries consists of: Argentina, Australia, Austria, Belgium, Brazil, Canada, Chile, Colombia, Costa Rica, Denmark, Ecuador, El Salvador, Finland, France, Germany, Great Britain, Greece, India, Indonesia, Ireland, Israel, Italy, Japan, Malaysia, Mexico, Netherlands, New Zealand, Norway, Pakistan, Panama, Peru, Philippines, Portugal, Singapore, South Africa, South Korea, Spain, Sweden, Switzerland, Thailand, Turkey, Urugay, USA, Venezuela.
1 Footnote.
calculations both Venezuela and South Korea were included in all calculations.
Calculations for Europe are generally for 15 countries: Austria, Belgium, Denmark, Finland, France, Germany, Ireland, Italy, Netherlands, Norway, Portugal, Spain, Sweden, Switzerland, United Kingdom. When Eurostat data (available only for EU countries) are used, calculation generally is for 14 countries (Norway and Switzerland excluded) or 13, Greece excluded.
The 20 product categories reviewed are: telephony, passenger cars, television, radio, the press (newspapers, books), food, mineral water, soft drinks, alcoholic drinks, cigarettes, jewellery, personal computers, the internet, audio, household appliances, watches, cameras, personal care products, household cleaning products and financial products.
The countries included in the 2001 to 2002 surveys by Reader’s Digest
are Belgium, Czech Republic, Denmark, Finland, France, Germany, Hungary, Italy, Netherlands, Norway, Poland, Portugal, Russia, Slovakia, Spain, Sweden, Switzerland, United Kingdom.
APPENDIX 2
Geert Hofstede (1991, 2001) distinguished five dimensions of national culture: power distance (PDI), individualism/collectivism (IDV), masculinity/femininity (MAS), uncertainty avoidance (UAI) and long-term orientation (LTO). The dimensions are measured on index scales from 0 to 100. Hofstede provides scores for 66 countries and three regions. For those readers who are unfamiliar with the model, a short description of the five dimensions follows.
1. Power distance is the extent to which less powerful members of a society accept that power is distributed unequally. In large power distance cultures (e.g. France, Belgium, Portugal, all of Asia) everybody has a rightful place in society and ownership of status objects to demonstrate this position is more important than in cultures of small power distance (e.g. Great Britain, Germany, the Netherlands and Scandinavia).
1 Footnote.
harmony makes them want to conform to others. North Americans and Northern Europeans are individualists; in the south of Europe people are moderately collectivist. Asians, Latin Americans and Africans are collectivists.
3. In masculine cultures the dominant values are achievement and
success. The dominant values in feminine cultures are caring for
others and quality of life. In masculine cultures status products and brands are important to show success. Feminine cultures have a people orientation, small is beautiful and status is not so important. Examples of masculine cultures are the USA, Great Britain, Germany, Italy and Japan. Examples of feminine cultures are the Netherlands, the Scandinavian countries, Portugal, Spain and Thailand.
4. Uncertainty avoidanceis the extent to which people feel threatened by uncertainty and ambiguity and try to avoid these situations. In cultures of strong uncertainty avoidance, there is a need for rules and formality to structure life. Competence is a strong value resulting in belief in experts as opposed to weak uncertainty avoidance cultures with belief in the generalist. In weak uncertainty avoidance cultures people tend to be more innovative and entrepreneurial. The countries of South and East Europe as well as Japan score high on uncertainty avoidance, whereas England, Scandinavia and Singapore score low.
5. Long-term orientation versus short-term orientation. This fifth dimension distinguishes between long-term thinking and short-term thinking. Other elements are pragmatism, perseverance and thrift. This dimension distinguishes mainly between Western and East Asian cultures. In Europe the differences are small, but in some cases significant. The Netherlands and Norway score relatively high, and Spain scores lowest.
REFERENCES
Antonides, G. (1998) An attempt at integration of economic and psychological theories of consumption. In European Perspectives on Consumer Behaviour. Prentice Hall Europe.
1 Footnote.
Bullmore, J. (2000) Alice in Disneyland, a creative view of international advertising. In: Jones, J.P. (ed.) International Advertising, Realities and Myths. Thousand Oaks, CA: Sage.
Byrnes, N. (2000) Brands in a bind.Business Week, 28 August, pp 124–127. Czinkota, M.R. & Ronkainen, I.A. (1993) International Marketing(3rd edn). Fort
Worth: The Dryden Press.
De Mooij, M. (1998) Global Marketing and Advertising, Understanding Cultural
Paradoxes. Thousand Oaks, CA: Sage.
De Mooij, M. (2001) Convergence and Divergence in Consumer Behavior. Consequences for
Global Marketing and Advertising. Unpublished doctoral dissertation. Pamplona:
University of Navarra.
EMS (1995, 1997, 1999) European Media & Marketing Survey, a research survey of print media readership and TV audience levels within the upscale consumer group in Europe (EU, Switzerland and Norway). Amsterdam: Inter/View International.
Eurobarometer (various years) Public Opinion in the European Union. Public Opinion Surveys and Research. Belgium: European Commission.
Eurostat Annual Yearbooks (1995, 1996, 1997, 1998/99) Luxembourg: Statistical Office of the European Communities.
Eurostat (2001) Consumers in Europe 1996–2000 Facts and Figures. The European Communities.
Hofstede, G. (1991) Cultures and Organizations, Software of the Mind. London: McGraw Hill.
Hofstede, G. (2001) Culture’s Consequences(2nd edn). Thousand Oaks, CA: Sage. Hunt, S.D. (1976) The nature and scope of marketing.Journal of Marketing,40
(July), pp. 17–28.
Leeflang, P.S.H. & Van Raaij, F. (1995) The changing consumer in the European Union: a meta-analysis.International Journal of Research in Marketing,12, pp. 373–387.
Levitt, T. (1983) The globalization of markets.Harvard Business Review(May–June), pp. 2–11.
McCann-Erickson (1997) The Insider’s Reportby Robert J. Coen. McCann-Erickson, 750 Third Avenue, New York. Internet: www.McCann.com (June).
McCracken, G. (1989) Culture and consumer behaviour: an anthropological perspective.Journal of the Market Research Society,32(1), pp. 3–11.
Marsella, A.J. (series ed.), McCrae, R.R. & Allik, J. (eds) (2002) The Five Factor Model
Across Cultures. The Netherlands: Kluwer Academic.
Peterson, M. & Malhotra, N. (2000) Country segmentation based on objective quality-of-life measures. International Marketing Review,17(1), pp. 56–73. Reader’s Digest (1970) A Survey of Europe Today, A Study of Consumption Habits and
Attitudes in 16 European Countries. London: The Reader’s Digest Association.
Reader’s Digest (1991) Eurodata Survey, a Study of the Lifestyles, Consumer Spending Habits and Attitudes of People in 17 European Countries. London: The Reader’s Digest Association.
1 Footnote.
Süerdem, A. (1993) Social de(re)construction of mass culture: making (non)sense of consumer behavior.International Journal of Research in Marketing,11,
pp. 423–443.
UN Statistical Yearbooks (various years). New York: United Nations.
Williamson, J.B. & Fleming, J.J. (1996) Convergence theory and the social welfare sector: a cross-national analysis. In Inkeles, A. & Sasaki, M.Comparing Nations and Cultures. Englewood Cliffs, NJ: Prentice Hall.
World Development Report (various years). New York: World Bank.
ABOUT THE AUTHOR
Dr. Marieke de Mooij is President of Cross Cultural Communications Company, her own consultancy, based in the Netherlands. She is a Doctor in Communication, Profesora Asociada at the University of Navarra, Spain, and Hofstede Fellow at IRIC, (the Institute for Research in Intercultural Cooperation) at Tilburg University, the Netherlands. She is the author of several publications on the influence
of culture on marketing and advertising. Her book, Global Marketing
and Advertising, Understanding Cultural Paradoxes (1998), Sage Publications (USA), is used by practitioners and universities
worldwide. Forthcoming (September 2003) is a new book:Culture and