Nitrogen mass balances in conventional, integrated and ecological
cropping systems and the relationship between balance calculations and
nitrogen runoff in an 8-year field experiment in Norway
Audun Korsaeth
∗, Ragnar Eltun
Apelsvoll Research Centre, The Norwegian Crop Research Institute, N-2849 Kapp, Norway
Received 9 March 1999; received in revised form 8 December 1999; accepted 14 December 1999
Abstract
For a cropping system to be sustainable, should not only the soil nitrogen (N) content be preserved but also the N runoff be minimised. Finding a simple but robust way to estimate N runoff would thus be a great advantage when evaluating cropping systems. In this study all major N flows in six different cropping systems, each covering 0.18 ha of a separately pipe drained field lysimeter, located in southeast Norway, were either measured or estimated over a period of 8-years. The effect of the cropping system on the soil N content was evaluated using mass balances of total N, and the usefulness of such N balances to predict N runoff (total N losses via drainage and surface water) was investigated. The experiment included systems with conventional arable cropping (CON-A), integrated arable-cropping (INT-A), ecological arable cropping (ECO-A), conventional forage cropping (CON-F), integrated forage cropping (INT-F), and ecological forage cropping (ECO-F). All the arable cropping systems resulted in a net reduction in the calculated soil N pool, and the reduction increased with decreasing N input. The only system, which did not alter the soil N content, was CON-F. The largest net reduction was estimated for ECO-A and ECO-F, which averaged 45 and 43 kg N ha−1per year, respectively. The N runoff from the systems was in the range of 18–35 kg
N ha−1per year, with highest losses from the two conventional and lowest from the two ecological systems and INT-F. The
forage systems had lower N runoff than the arable systems. The INT-F system appeared to be the most favourable system in terms of both soil N balance and N runoff.
When the annual (May–April) N balance, calculated as Nfertiliser+Nslurry−Nharvest, the annual precipitation and the
precip-itation from the previous year were used as predictors in a linear regression model, 87 and 65% of the variation in N runoff could be explained from the arable and forage cropping systems, respectively. The average N balance calculated for all years, on its own predicted 86% of the variation in N runoff from the arable systems. Mass N balances were thus found to be a useful tool for predicting N runoff, especially in systems with mainly arable crops. © 2000 Elsevier Science B.V. All rights reserved.
Keywords:Cropping systems; Leaching; Nitrogen balances; Nitrogen runoff; Predictor; Symbiotic N fixation; Sustainability; Total nitrogen
∗Corresponding author. Tel.:+47-61-16-69-10; fax:+47-61-16-69-01.
E-mail address:[email protected] (A. Korsaeth)
1. Introduction
There is increasing concern about the long term productivity of soils as a resource base for food production (Dick, 1992). Nitrogen (N) is the major
limiting nutrient for producing food and maintaining the level of soil N is essential for sustaining agricul-tural productivity.
Agronomic practices affect the balance between production and mineralisation of soil organic N. The characteristically slow turnover of the N pools implies that low input farming systems may sustain fairly high productivity at the cost of a gradual decline of the soil organic N. The degree to which an agronomic system maintains the soil organic N level is thus one of several measures of its sustainability. This crite-rion is conditional, however, since net changes also depend on the history of the soil. It is difficult to avoid a net reduction of soil organic N in soils with a high content of mineralisable organic N, especially in arable cropping systems (Christensen, 1990; Uhlen, 1991; Heenan et al., 1995; Thomsen and Christensen, 1998). At the other extreme, most cultivation regimes will result in a net accumulation of soil organic N on soils with very low initial soil organic N levels (Fet-tell and Gill, 1995; Poulton, 1995; Raun et al., 1998). Thus the sustainability of cultivation regimes with respect to soil organic N levels can only be compared on equal terms, i.e., when the regimes are run side by side on the same type of soil and under identical climatic conditions.
Changes in the soil N pool can only be observed over an extended time (Poulton, 1995), since the an-nual changes are small as compared to the total pool size (e.g., Uhlen, 1991). Long term experiments are therefore needed (Dick, 1992). It is, however, desirable to obtain information on trends at an early stage, in or-der to correct the development in the present cropping systems. Good correlations have been found between calculated N balances and changes in soil N (Uhlen, 1989; Nyborg et al., 1995), and thus nitrogen mass balance (N balance) studies are a suitable approach to analyse agroecosystems (Wood et al., 1991).
Systems with a similar difference between inputs and outputs of N may, however, differ greatly in their losses of N to the environment, as high losses may be counteracted by high inputs. One major path for N losses from agriculture is the transport via surface and drainage runoff, and the resulting pollution of wa-ter resources has become an increasingly important problem (Kristensen et al., 1995). In an ideal crop-ping system, should not only the reduction of soil N be minimised but also the N runoff. Reliable
measure-ments of N runoff are difficult to obtain and require rather expensive lysimeter trials (e.g., Bergström and Brink, 1986; Uhlen, 1994; Thomsen and Christensen, 1998). Finding a simple but robust way to estimate N runoff would thus be a great advantage when eval-uating cropping systems. Different factors have been found to correlate with N runoff, such as fertiliser level (Bergström and Brink, 1986; Bergström, 1987), pre-cipitation (Jenkinson, 1990), soil mineral-N content in early autumn (Bergström and Brink, 1986; Vagstad et al., 1997) and crop yield (Vagstad et al., 1997). Hal-berg et al. (1995) stated in more general terms, that the N balance (fertiliser N plus N applied with ma-nure minus harvested N) is an expression of the to-tal potential for N losses from an agroecosystem, and thus an indirect indicator of N runoff. The direct rela-tionship between N balances and N runoff at the field level has, however, seldom been investigated.
The Apelsvoll Cropping System Experiment was established in 1988–1989 with the aim of developing sustainable and environmentally sound cropping sys-tems (Eltun, 1994). The experiment consists of six dif-ferent cropping systems with rotations of either mainly arable or mainly forage crops, ranging from low to high inputs of N and other production factors. On the basis of results from the first 8 years of this experi-ment (one entire crop rotation), the objective of the study presented here was, (i) to quantify the major N flows in the cropping systems, using a mass-balance approach, in order to analyse possible changes in the soil N content, and (ii) to test the usefulness of mass balance calculations for predicting N runoff.
2. Materials and methods
2.1. Experimental site and treatments
A detailed description of the experimental design (Eltun, 1994) and soil characteristics (Riley and El-tun, 1994) have been presented elsewhere. Briefly, a 3.3 ha field lysimeter was established in 1988–1989 at Apelsvoll Research Centre in central southeast Nor-way (60◦42′N, 10◦51′E, altitude 250 m). The climate
of the region is humid continental with a mean an-nual precipitation of 600 mm and a mean anan-nual
tem-perature of 3.6 and 12.0◦C in the growing season
2–8% towards northeast, was used as pasture from 1935 to 1975. During the following 10 years the field was cropped with a rotation including 10% root crops, 40% small grains and 50% ley, using an average of 10 tonnes slurry ha−1per year (containing approximately
50 g kg−1 total-N) plus regular amounts of inorganic
fertiliser. The field was lying fallow in 1986 and 1988 and under winter wheat in 1987.
The major soil group at the experimental site is im-perfectly drained brown earth (Oxiaquic Cryoboroll, USDA; Gleyed melanic brunisoils, Canada Soil Survey) with dominantly loam and silty sand textures, and containing about 60 g kg−1organic matter in the top soil. Six cropping systems, each with two repli-cates, were distributed on 0.18 ha trial units within a randomised complete block design in the field lysimeter. Each cropping system has an 8-year crop rotation with eight plots, so that all crops in the rota-tion are present every year. They include convenrota-tional arable cropping (CON-A), integrated arable cropping (INT-A), ecological arable cropping (ECO-A), con-ventional forage cropping (CON-F), integrated forage cropping (INT-F), and ecological forage cropping
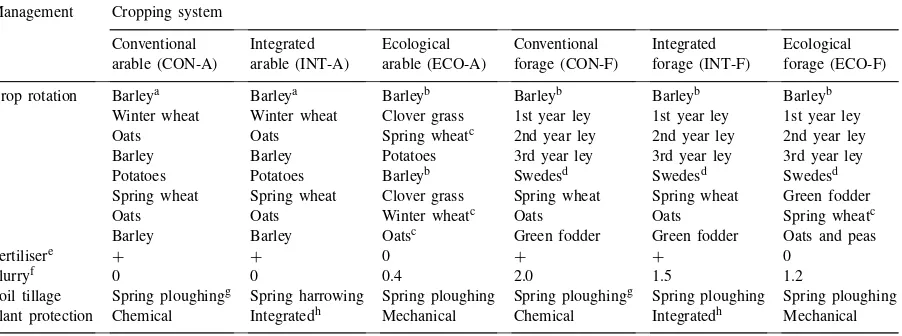
Table 1
Characteristics of the cropping systems at Apelsvoll Research Centre, southeast Norway Management Cropping system
Conventional Integrated Ecological Conventional Integrated Ecological arable (CON-A) arable (INT-A) arable (ECO-A) forage (CON-F) forage (INT-F) forage (ECO-F) Crop rotation Barleya Barleya Barleyb Barleyb Barleyb Barleyb
Winter wheat Winter wheat Clover grass 1st year ley 1st year ley 1st year ley Oats Oats Spring wheatc 2nd year ley 2nd year ley 2nd year ley
Barley Barley Potatoes 3rd year ley 3rd year ley 3rd year ley
Potatoes Potatoes Barleyb Swedesd Swedesd Swedesd
Spring wheat Spring wheat Clover grass Spring wheat Spring wheat Green fodder
Oats Oats Winter wheatc Oats Oats Spring wheatc
Barley Barley Oatsc Green fodder Green fodder Oats and peas
Fertilisere + + 0 + + 0
Slurryf 0 0 0.4 2.0 1.5 1.2
Soil tillage Spring ploughingg Spring harrowing Spring ploughing Spring ploughingg Spring ploughing Spring ploughing
Plant protection Chemical Integratedh Mechanical Chemical Integratedh Mechanical aEarly potatoes in the period 1990–1994.
bWith undersown clover grass/ley. cWith undersown crop.
dFodder beet in the period 1990–1994. eInorganic fertiliser.
fCattle slurry as big animal units per ha. gAutumn ploughing in the period 1990–1994.
hChemical protection, but with reduced amounts of pesticides and application times compared to the conventional systems.
(ECO-F). Characteristics of the cropping systems are shown in Table 1. Each trial unit is separately drained with PVC pipes at a depth of 1 m with spacing of 7.5 m. Surface runoff is collected at the lower end of each trial unit and led to a sedimentation tank. Grass covered border zones separate the trial units. Drainage water runoff and surface water runoff from the sedimentation tank is transported in sealed plastic pipes to measuring stations equipped for discharge measurements (by tipping buckets) and for volume proportional water sampling.
The experimental site was irrigated in cases of moderate or extreme moisture deficit, using a mobile rain-gun, which delivered the same amount of water to all crops.
2.2. Measurements
Cattle slurry (slurry) was sampled 1–2 weeks be-fore application and analysed for total-N (Nslurry)
us-ing the Kjeldahl method. Ammonium-N and nitrate-N in the slurry (Nslurry, inorg) were extracted with 2M
auto-analyser (Traacs, Bran and Luebbe, Germany). Pre-cipitation was sampled on a monthly basis from a rain gauge placed at the experimental area, and anal-ysed for total-N (Nwet dep.) using the Kjeldahl method
(Allen et al., 1974).
The harvested crops and straw residues (when re-moved) were weighed (four parallels on each rotation plot) and analysed for total-N (Nharvest) using Kjeldahl
digestion. The proportion of legumes was determined visually before harvest.
The water samples (surface and drainage runoff) were analysed on a monthly basis for total-N with the Kjeldahl method. Ammonium-N and nitrate-N in runoff was determined as the slurry samples, as de-scribed earlier.
Soil samples were taken at five depths (5–10, 20–25, 35–40, 50–55 and 65–70 cm) with two replicates from each model farm in 1988 (Riley and Eltun, 1994) and from topsoil (0–25 cm) at the same sites in 1995, and analysed for total-N by the Kjeldahl method.
2.3. Estimates
The input of N with seeds (Nseed) was estimated
us-ing measured N content of harvested grain and pota-toes from the CON-A system. Literature values were selected for the legumes (Lunnan, 1988, 1989) and the N content in swede seedlings was set to 0.1 g per plant. Volatilisation of NH3-N from cattle slurry (Nvolat. slurry) was estimated individually for each rotation plot
and application time by the method of Horlacher and Marschner (1990). The estimates for losses from cat-tle slurry applied to arable rotation plots were taken directly from their framework (as a percentage of the amount of NH4-N applied), by considering the factors
expected infiltration rate of the slurry, mean daily air temperature, precipitation and the time between appli-cation and precipitation or incorporation of the slurry. The estimated N losses from slurry applied to ley were multiplied by 1.5, in order to compensate for a lower expected rate of infiltration compared to arable fields (Thompson et al., 1990).
Symbiotic N fixation,Nfixation(g N m−2), was
sim-ulated by a modified model of Hansen (1995). The annual amount of fixed N was modelled as a product
of the crop yield, Y (g DM m−2), the proportion of
legumes,L(g g−1), the N content of the legumes,Nleg
(g N g−1 DM), the fraction ofNleg originating from
fixation, F(g N g−1 N), and a factor accounting for
net accumulated fixed N below stubble height,R, as
shown in Eq. (1):
Subscript i indicates the seasonal cut number, j the
legume type andkthe year of ley. Fj is given by:
Fj =Fmax, j−ajNnet inorg Fj ≥0 (2)
whereFmax, j denotes the maximal fraction
originat-ing from fixation,aj (m2g−1Nnet inorg) is a constant
and Nnet inorg(g N m−2) is the net amount of inorganic
N applied defined by:
Nnet inorg=Nfertiliser+Nslurry inorg−Nvolat. slurry (3)
All parameter values are shown in Table 2.
Dry atmospheric deposition (Ndry dep.) was set to
2 kg N ha−1 per year based on Tørseth and Manø
(1996). Denitrification (Ndenitrification) was set to 7%
of the net amount of inorganic N applied (Eq. (3)), based on experiments executed under fairly compara-ble conditions (Ryden, 1985; Svensson et al., 1991;
Maag, 1995). Net losses of NH3 to the atmosphere
by volatilisation from crops (Nvolat. crop) were set to
2 kg N ha−1per year according to Holtan-Hartwig and
Bøckman (1994). Non-symbiotic N fixation, reported
to be less than 0.8 kg ha−1 per year (Haynes, 1986),
was not considered.
2.4. Calculations and statistics
All flows were calculated as total-N (kg N ha−1). Calculations of transported N via surface and drainage runoff were based on measured N concen-trations and volumes of surface and drainage water (Eltun and Fugleberg, 1996). Nitrogen runoff occur-ring duoccur-ring one agrohydrological year, lasting from 1 May to 30 April (Høyås et al., 1997), was attributed to the cropping season in the same hydrological year. Yearly changes in soil N (1N) were calculated as:
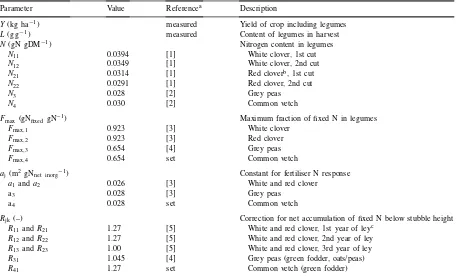
Table 2
Parameters and variables used for estimating the biological fixation of nitrogen in Eqs. (1) and (2)
Parameter Value Referencea Description
Y(kg ha−1) measured Yield of crop including legumes
L(g g−1) measured Content of legumes in harvest
N(gN gDM−1) Nitrogen content in legumes
N11 0.0394 [1] White clover, 1st cut
N12 0.0349 [1] White clover, 2nd cut
N21 0.0314 [1] Red cloverb, 1st cut
N22 0.0291 [1] Red clover, 2nd cut
N3 0.028 [2] Grey peas
N4 0.030 [2] Common vetch
Fmax (gNfixedgN−1) Maximum fraction of fixed N in legumes
Fmax,1 0.923 [3] White clover
Fmax,2 0.923 [3] Red clover
Fmax,3 0.654 [4] Grey peas
Fmax,4 0.654 set Common vetch
aj (m2 gN
net inorg−1) Constant for fertiliser N response
a1 anda2 0.026 [3] White and red clover
a3 0.028 [3] Grey peas
a4 0.028 set Common vetch
Rjk (–) Correction for net accumulation of fixed N below stubble height R11andR21 1.27 [5] White and red clover, 1st year of leyc
R12 andR22 1.27 [5] White and red clover, 2nd year of ley R13andR23 1.00 [5] White and red clover, 3rd year of ley
R31 1.045 [4] Grey peas (green fodder, oats/peas)
R41 1.27 set Common vetch (green fodder)
aReferences are: [1] Lunnan (1989), [2] Lunnan (1988), [3] Hansen (1995), [4] Hansen (1993) and [5] Steen Kristensen et al. (1995). bThe properties for alsike clover were assumed to be the same as for red clover.
cIncluding the accumulation of fixed N in the year the ley was sown.
where Nrunoff is the sum of N lost via surface and
drainage runoff.
Averaged data are presented with standard errors of the mean (SE). Analysis of variance (Gomez and Gomez, 1984) was performed on the results of har-vested N and N runoff, using a split-plot model with cropping system as major plot and year as subplot. When analysing data at the rotation plot level (dry mat-ter yield and legume content), a split-split-plot model was used, with cropping system as major plot, rota-tion plot as subplot and year as sub-subplot. Paired comparisons (LSD) were performed using appropriate
standard errors of the mean difference and student t
values (Gomez and Gomez, 1984).
Various mass N balance calculations were con-ducted in order to find a simple predictor for Nrunoff
Starting with the major N flows, Nfertiliserand Nharvest,
the balance calculation was expanded stepwise to
include all the N flows in (Eq. (4)). Thus the most
complex way to express the potential for Nrunoff
(Balcomplex) was calculated as:
1Balcomplex=Nfertiliser+Nslurry+Nwet dep. +Ndry dep.+Nseed+Nfixation −Nharvest−Nvolat.slurry−Nvolat.crop
−Ndenitrification (5)
To assess the usefulness of the balances to predict Nrunoff , we used the classical linear regression model
(Johnson and Wichern, 1992):
Y =β0+β1z1+β2z2+β3z3+ε (6) whereYis Nrunoff for each system and year,β0–3are
parameters, z1–3 are predictors and ε is the random
In Step A the annual N balances (Balx) were used
as only predictor (z1=Balx,z2=z3=0). Since
precip-itation has been found to be an important factor for N runoff (Jenkinson, 1990), annual total precipitation (Prect) was alternatively tested (z1=Prect,z2=z3=0).
In Step B both calculated N balances and precipita-tion were included as predictors (z1=Balx,z2=Prect,
z3=0). In Step C we added the total precipitation
of the previous year (Prect−1) as a third predictor
(z1=Balx, z2=Prect, z3=Prect−1). The rationale for
so doing was the assumption that the amount of leachable N, which is not lost in 1 year (e.g. due to shortage of water for N transport in a dry year), increases the runoff potential the following year due to nitrate storage below the root zone. In order to eliminate the effect of the climatic variations on the regressions, we finally regressed N balances averaged
over all years against average N runoff (Y=average
Nrunoff,z1=average Balx,z2=z3=0) (Step D).
All statistical tests were performed at the 0.05 level of probability.
3. Results
3.1. Nitrogen measurements
The N content of cattle slurry averaged 2.47 g kg−1
(SE=0.22), of which 58% (SE=4.48) was
ammonium-N. Nitrogen input via precipitation was 6.20 kg N ha−1
(SE=0.40) on average for the 8 years.
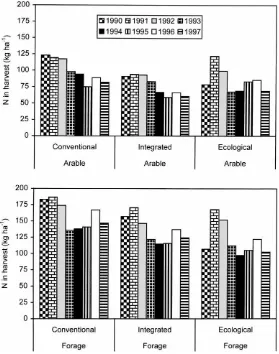
The amounts of harvested N differed significantly between the cropping systems (Fig. 1,p<0.001), and the LSD0.05 test showed significant differences
be-tween all pairs but one; INT-A and ECO-A.
The dry matter yield for ley (Table 3) differed
significantly (p=0.001) between cropping systems
(sum of two cuts). Total dry matter production of ley was significantly lower in ECO-F than in CON-F and INT-F (LSD0.05). The content of red clover and
alsike clover, averaged over cuts, differed
signifi-cantly between cropping systems (p=0.014) and
be-tween ley years (p=0.009). ECO-F had significantly
higher content of clover (LSD0.05) than CON-F and
ECO-F, which did not differ statistically. The con-tent of white clover in ley was very low and had no significant sources of variation. For green fod-der neither the dry matter yield nor the content of
grey peas differed significantly between cropping systems.
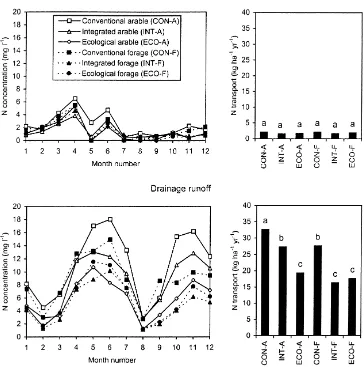
Nitrogen concentrations in surface and drainage runoff are shown on a monthly basis (averaged over years) in Fig. 2. The N concentrations in drainage runoff as a yearly average (averaged over months and years) differed significantly (p=0.002) between the cropping systems. Highest N concentrations were found in drainage water from CON-A, whereas ECO-A, INT-F and ECO-F had the lowest concentra-tions. The N concentration in surface runoff did not differ significantly between cropping systems.
In 1988 the N content in topsoil (measured at 5–10 and 20–25 cm) and subsoil (measured at 35–40, 50–55 and 65–70 cm) was 2.7 g kg−1(SE=0.35,n=24) and
0.5 g kg−1(SE=0.06,n=24), respectively (Riley and
Eltun, 1994). This corresponds to 14.3 tonnes N ha−1
(95% confidence limits:±0.38 tonnes N ha−1). Only
the upper 25 cm of the soil was analysed in 1995, and the N content averaged 2.6 g kg−1(SE=0.06,n=24). The measurements showed no significant differences in N content between the cropping systems in 1995. Moreover, the soil N content had not changed signifi-cantly between 1988 and 1995 for any of the cropping systems.
3.2. Nitrogen estimates
The estimated symbiotic N fixation was much higher for ECO-F than for the other systems with legumes (Fig. 3). In all the forage systems the esti-mated N fixation was larger in the first and the second year than in the third ley year. Clover grass (ECO-A) fixed about the same amounts as the first year of ley in ECO-F.
The estimated NH3-N losses for crops receiving
cat-tle slurry varied considerably, and averaged 13% of total-N applied with the slurry for ECO-A and 23–27% for the forage systems. Estimates of ammonia volatil-isation, N in seeds and denitrification are shown in Table 4 as average over all years for the entire crop-ping system (average over eight rotation plots).
3.3. Calculations
concentra-Fig. 1. Total harvested N in the arable (upper figure) and forage systems (lower figure) for the years 1990–1997 at Apelsvoll.
tions between the systems. Total N runoff (drainage
plus surface runoff) (kg N ha−1 per year) increased
in the order INT-F (18.0)<ECO-F (19.5)<ECO-A (21.1)<INT-A (28.8)<CON-F(29.7)<CON-A (34.9). The runoff losses contributed 10–25% of the total N output from the systems. The fraction of inorganic N in runoff was 84%.
The changes in soil N (1N) are shown as average
values in Table 4. All the arable systems had a reduc-tion in the soil N content. INT-A and ECO-A had
re-ductions of about 10 and 30 kg N ha−1per year more
than CON-A, respectively. The soil N changes were small for CON-F and INT-F. The greatest reductions were calculated for ECO-A and ECO-F, which
accu-mulated to 357 and 341 kg N ha−1 over 8 years,
re-spectively. This corresponds to approximately 2.5% of the initial soil N pool.
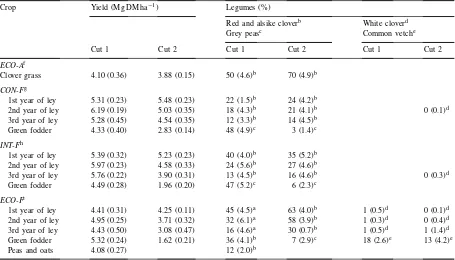
Table 3
Dry matter yields of the crops including legumes and visually estimated legume content in the cropping systems at Apelsvoll (mean 1990–1997)a
Crop Yield (Mg DM ha−1) Legumes (%)
Red and alsike cloverb White cloverd
Grey peasc Common vetche
Cut 1 Cut 2 Cut 1 Cut 2 Cut 1 Cut 2
ECO-Af
Clover grass 4.10 (0.36) 3.88 (0.15) 50 (4.6)b 70 (4.9)b
CON-Fg
1st year of ley 5.31 (0.23) 5.48 (0.23) 22 (1.5)b 24 (4.2)b
2nd year of ley 6.19 (0.19) 5.03 (0.35) 18 (4.3)b 21 (4.1)b 0 (0.1)d
3rd year of ley 5.28 (0.45) 4.54 (0.35) 12 (3.3)b 14 (4.5)b
Green fodder 4.33 (0.40) 2.83 (0.14) 48 (4.9)c 3 (1.4)c INT-Fh
1st year of ley 5.39 (0.32) 5.23 (0.23) 40 (4.0)b 35 (5.2)b
2nd year of ley 5.97 (0.23) 4.58 (0.33) 24 (5.6)b 27 (4.6)b
3rd year of ley 5.76 (0.22) 3.90 (0.31) 13 (4.5)b 16 (4.6)b 0 (0.3)d
Green fodder 4.49 (0.28) 1.96 (0.20) 47 (5.2)c 6 (2.3)c ECO-Fi
1st year of ley 4.41 (0.31) 4.25 (0.11) 45 (4.5)a 63 (4.0)b 1 (0.5)d 0 (0.1)d
2nd year of ley 4.95 (0.25) 3.71 (0.32) 32 (6.1)a 58 (3.9)b 1 (0.3)d 0 (0.4)d
3rd year of ley 4.43 (0.50) 3.08 (0.47) 16 (4.6)a 30 (0.7)b 1 (0.5)d 1 (1.4)d
Green fodder 5.32 (0.24) 1.62 (0.21) 36 (4.1)b 7 (2.9)c 18 (2.6)e 13 (4.2)e
Peas and oats 4.08 (0.27) 12 (2.0)b
aStandard error of mean in parentheses.
bRed clover (Trifolium pratenseL.) and Alsike clover (Trifolium hybridumL.). cGrey peas (Pisum arvenseL.).
dWhite clover (Trifolium repensL.).
eCommon vetch (Vicia sativaL.), sown in ecological greenfodder only (ecological forage cropping). fEcological arable cropping.
gConventional forage cropping. hIntegrated forage cropping. iEcological forage cropping.
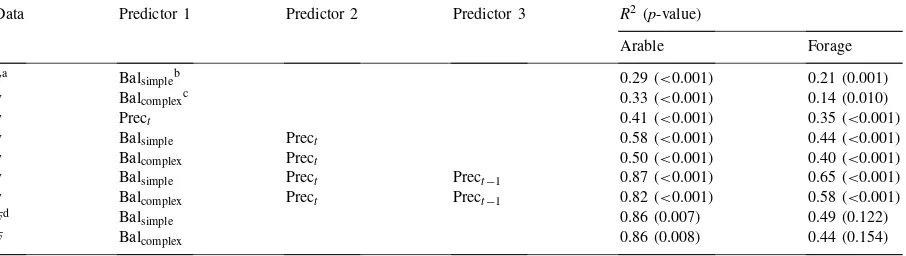
runoff from the arable and the forage systems, respec-tively, could be explained. The linear regressions gave generally poorer fits to data from the forage systems than from the arable systems. No improvement in the regressions was gained when all negative N balances where excluded or when only data from drainage N runoff was used (i.e. excluding surface N runoff) or by using ungrouped data (data from both arable and forage systems) (data not shown). Only three N flows, fertiliser-N, N in slurry and harvested N, were needed to calculate the N balance which was best suited to pre-dict N runoff (Balsimple=Nfertiliser+Nslurry−Nharvest).
Including more N flows in the N balance did not im-prove the model performance.
When we used data averaged over all 8 years (Step D), instead of data on a yearly basis, most of the vari-ation in N runoff between the arable systems could be explained by Balsimple. No such significant
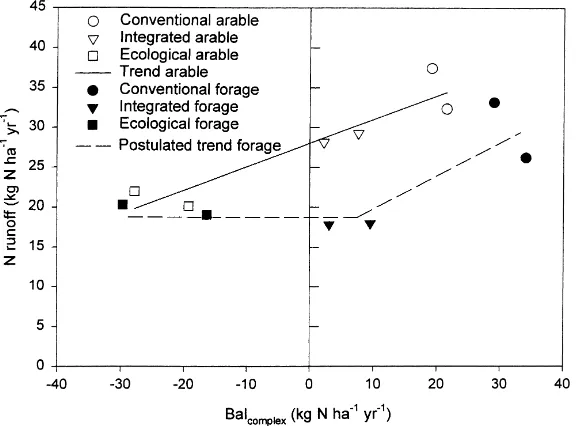
rela-tion between accumulated balances and N runoff was found when using the same model on the data from the forage systems. Plots of N runoff against N bal-ance for the different systems (shown for Balcomplex,
Fig. 2. Measured total N concentrations as monthly averages (lines) and transport of total N averaged over the agrohydrological years (May–April) 1990–1997 (bars), for surface runoff (upper two figures) and drainage runoff (lower two figures) from the six cropping systems at Apelsvoll. Bars with same letter are not significantly different (p=0.05).
The statistics for the best fitting regressions are shown in Table 6. From the regression equations it may be calculated that a difference in total precipita-tion of 100 mm between a dry year and a subsequent wet year, would increase the N runoff in the wet year
by 6 and 5 kg N ha−1 per year from the arable and
the forage cropping systems, respectively, assuming the same N balance both years. For the arable systems an increase in the N balance (i.e. Balsimple) by 10 kg
N ha−1per year would over time imply an increase in
N runoff by 1.5 kg N ha−1per year.
4. Discussion
4.1. Effects of cropping systems on the soil N content
The calculated net change in soil organic N (1N)
Fig. 3. Estimated N-fixation in leys, greenfodder and peas/oats in the cropping systems at Apelsvoll. Mean for 1990–1997.
valid criterion for its sustainability. Thus, the systems sustainability cannot be evaluated by the absolute
val-ues of1N found in our study. On the other hand, the
ranking of the cropping systems is useful as an indi-cation on the degree to which each cultivation regime is able to sustain soil organic N levels relative to the others.
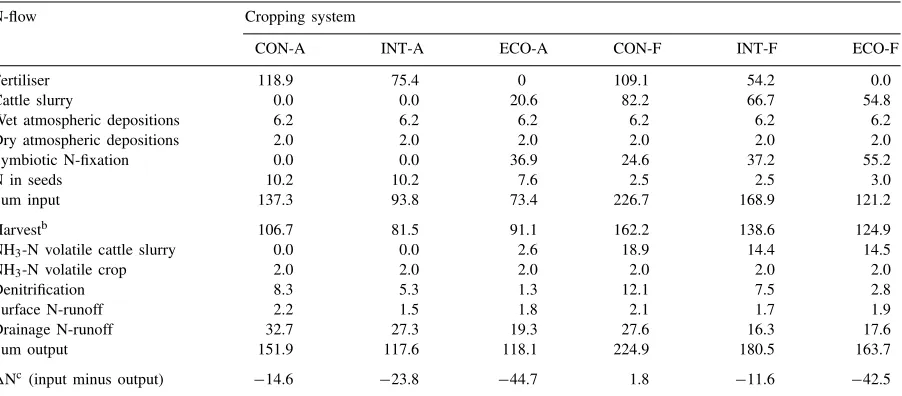
Table 4
Measured and estimated nitrogen flows (kg N ha−1 per year) in the cropping systems at Apelsvoll, mean 1990–1997a
N-flow Cropping system
CON-A INT-A ECO-A CON-F INT-F ECO-F
Fertiliser 118.9 75.4 0 109.1 54.2 0.0
Cattle slurry 0.0 0.0 20.6 82.2 66.7 54.8
Wet atmospheric depositions 6.2 6.2 6.2 6.2 6.2 6.2
Dry atmospheric depositions 2.0 2.0 2.0 2.0 2.0 2.0
Symbiotic N-fixation 0.0 0.0 36.9 24.6 37.2 55.2
N in seeds 10.2 10.2 7.6 2.5 2.5 3.0
Sum input 137.3 93.8 73.4 226.7 168.9 121.2
Harvestb 106.7 81.5 91.1 162.2 138.6 124.9
NH3-N volatile cattle slurry 0.0 0.0 2.6 18.9 14.4 14.5
NH3-N volatile crop 2.0 2.0 2.0 2.0 2.0 2.0
Denitrification 8.3 5.3 1.3 12.1 7.5 2.8
Surface N-runoff 2.2 1.5 1.8 2.1 1.7 1.9
Drainage N-runoff 32.7 27.3 19.3 27.6 16.3 17.6
Sum output 151.9 117.6 118.1 224.9 180.5 163.7
1Nc(input minus output) −14.6 −23.8 −44.7 1.8 −11.6 −42.5
aTimestep used is the agrohydrological year (May–April), thus covering the period May 1990–April 1998. bIncluding N removed with straw in 1990–1992 (otherwise the straw was left on the field).
cChanges in soil total-N.
4.1.1. Effects of arable cropping systems on the soil N content
1995; Thomsen and Christensen, 1998). Least reduc-tion was found by the system with the largest N in-put (CON-A), and the depletion of soil N increased with decreasing fertiliser input. Raun et al. (1998) also reported a positive relationship between fertiliser N input and soil N content in a long term experiment (>23 years) with continuous wheat. They found,
how-ever, mainly positive values of 1N (accumulation),
which may be explained by the low initial N content (<1.0 g kg−1) in their experimental soil.
ECO-A had the highest calculated N depletion of all the systems (Table 4). The N export via harvest was larger than the total N input for all crops but clover grass in this system (data not shown), and this relatively high yield level was a major reason for the calculated large reduction in soil N. A factor, which further increased the N deficits, is the low input of cat-tle slurry. The amount of catcat-tle slurry followed a fixed plan in the experiment. In practice the livestock num-ber would be adjusted according to the fodder pro-duction (or vice versa), which again would affect the amount of cattle slurry available to the crops. Consid-ering the relatively high fodder production in ECO-A, the application rates of slurry may have been too low. In spite of the relatively large calculated reduction of the soil N pool in ECO-A, no changes could be mea-sured. The high initial content of total-N (14.3 tonnes N ha−1), more than two times the average in agricul-tural soils in Norway, may explain the lack of
signif-Table 5
Coefficients of determination (R2) for linear regressions using the N balance calculations (Bal), precipitation (prect) and precipitation from
the previous year (prect–1) as predictors, and N runoff as the dependent variable
Data Predictor 1 Predictor 2 Predictor 3 R2 (p-value)
Arable Forage
yd Balsimple 0.86 (0.007) 0.49 (0.122)
y Balcomplex 0.86 (0.008) 0.44 (0.154)
ay=Data from each agrohydrological year (May–April). bBal
simple=Nfertiliser+Nslurry−Nharvest. cBal
complex=Nfertiliser+Nslurry+Nwet dep.+Ndry dep.+Nseed+Nfixation−Nharvest−NNH3volat. slurry−NNH3volat. crop−Ndenitrification.
dy=Data averaged over all agrohydrological years (1990–1997).
icant changes, since the calculated reductions of soil N during the 8-year experiment were within the statis-tical error of the measured soil N content (Riley and Eltun, 1994). Penfold et al. (1995), who investigated soil properties of organic, biodynamic, integrated and conventional cropping systems with rotations of grain and forage crops, found no significant differences in organic C between the systems after 6 years, and con-cluded that considerable time are needed before iden-tifiable changes in soil fertility emerge.
The results for N runoff corresponded well with findings of other authors, both for measured concen-trations (Bergström, 1987; Uhlen, 1994; Thomsen and Christensen, 1998), and for calculated N transport (Uhlen, 1991; Vinten et al., 1991; Høyås et al., 1997; Vagstad et al., 1997). ECO-A had significantly lower N runoff than the other arable systems. Decreasing N runoff with decreasing fertiliser level is commonly re-ported for arable crops (e. g. Bergström, 1987; Uhlen, 1994), at least above a certain threshold level.
Fig. 4. Total N runoff (surface and drainage runoff) plotted against the estimated N balance (Balcomplex=Nfertiliser+Nslurry+Nwet dep.+Ndry dep.+Nseed+Nfixation−Nharvest−Nvolat.slurry−Nvolat.crop−Ndenitrification). Data averaged over the agrohydrological years (May–April)
1990–1997.
next 52 years approaching an equilibrium level. We assume that none of the systems in our experiment are N limited. A further reduction in the soil N content in the arable systems is thus expected, with a devel-opment over time similar to that reported by Mitchell et al. (1991).
Table 6
Statistics for the regressions which best described the variation in N runoff from the cropping systems at Apelsvoll, using the linear model:
Y=β0+β1z1+β2z2+β3z3+ε, whereYis N runoff (kg N ha−1per year)a,β0–3are parameters,z1–3are predictors andεis the random error
System Data Predictors (z) and parameters (β) R2
z1=Balsimpleb z2=Prectc z3=Prect–1d
β0 β1 β2 β3
Arable ye 31.05 (4.49)f 0.16 (0.02) 0.06 (0.01) −0.06 (0.01) 0.87
Forage y 24.93 (7.82) 0.10 (0.03) 0.05 (0.01) −0.05 (0.01) 0.65
Arable yg 31.52 (1.27) 0.15 (0.03) 0.86
aAgrohydrological year (May–April). bBal
simple=Nfertiliser+Nslurry−Nharvest, unit: kg N ha−1per year. cPrecipitation, unit: mm per year.
dPrecipitation from the previous year, unit: mm per year. ey=Data from each agrohydrological year.
fStandard deviation in parentheses.
gy=Data averaged over all agrohydrological years (1990–1997).
4.1.2. Effects of forage cropping systems on the soil N content
The system CON-A had a1N value close to zero,
very close to CON-A. Although INT-F was similar to
CON-F with regard to calculated1N, the underlying
N flows differed considerably between the two sys-tems. INT-F had about 25% lower N input, but only 15% lower N yields than CON-F. The N runoff via drainage water from INT-F was among the lowest of all the cropping systems (Fig. 2). Conservation or even an increase in soil N has also been reported for other rotations containing pasture or ley receiving organic N on relatively N-rich (>2.0 g kg−1) soils (Uhlen, 1991; Heenan et al., 1995).
Our calculations suggest that the soil N pool was
re-duced by 45 kg N ha−1per year every year in ECO-F.
Why were the soil N losses in ECO-F so large com-pared to the other systems? The considerations regard-ing slurry application are the same for ECO-F as for ECO-A as discussed earlier. Underestimation of fixed nitrogen (Fig. 3) is one possible reason for the low
1N, although the estimated amounts were within the
range of findings made by other authors (Høgh-Jensen and Steen Kristensen, 1995; Whitehead, 1995; Fis-cher, 1996). The legume content in ley decreased with increasing N input and age, also reported by Petterson et al. (1998). This may be a result of the negative ef-fect of fertiliser N on clover growth, as has been com-monly reported (Høgh-Jensen and Steen Kristensen, 1995; Petterson et al., 1998).
Our results on N runoff showed in general that the forage systems had lower N runoff than the arable systems. This confirms earlier results from the present experiment (Eltun, 1995; Eltun and Fugleberg, 1996), and is in accordance with other studies (Bergström, 1987; Gustafson, 1987; Uhlen, 1991; Solberg, 1995). In summary, it appeared that the system CON-F had a N input which balanced its N export, but that it also had higher N losses to the environment than the other
forage rotations. The calculated 1N in INT-F was
similar to that in CON-A. When taking into account the low N runoff from INT-F, it appeared to be the
most favourable in terms of both 1N and N runoff.
Major adjustments are needed for ECO-F to avoid a further decrease in the soil N pool.
4.2. Mass balance of total-N as a predictor of N runoff
On an annual basis there was a positive correlation between N balance and N runoff (Step A), but
an-nual precipitation explained more of the variation in N runoff from the cropping systems than did the N balance (Table 5). Other authors have also found high correlations between precipitation and N runoff (Jenk-inson, 1990; Eltun and Fugleberg, 1996; Vagstad et al., 1997). N runoff from agricultural fields depends primarily on the mobility of the soil N present, and surplus water to transport soluble N out of the field (Vagstad et al., 1997). Even if mobile soil nitrogen is present, no runoff occurs if surplus water for N trans-port is lacking. This means that some of the leachable N may be left in the soil in a dry year, thereby increas-ing the potential for N runoff the followincreas-ing year. Such ‘delayed N runoff’ would cause reduced efficiency in the annual regressions. By combining annual N bal-ances, total precipitation from the same year and from the previous year in a three-predictor model (Step C), some of this effect was obviously reduced. In this way up to 87 and 65% of the variation in N runoff between systems and years could be explained for the arable and the forage systems, respectively (Table 5).
A factor, which may have contributed to the ob-served differences between arable and forage systems, is the difference in the composition of the N inputs. The fraction of inorganic N was much higher in the N input to the arable systems than in that of the for-age systems. As a result, the proportion of inorganic N would generally be higher in the arable than in the forage systems after N application, and thus more sus-ceptible to leaching. This is confirmed by measure-ments of relatively high N concentration in drainage runoff from CON-A soon after fertiliser application (Month Numbers 5–7, Fig. 2).
average values, and a one-predictor model could then be used. The differences between the arable systems were well described by this model (Table 5), but those between the forage systems were not. Plotting the results, however, revealed a different pattern between the two groups of cropping systems. The forage sys-tems appeared to have a higher N balance threshold, below which the N runoff was insensitive to the N bal-ance (Fig. 4). We speculate that this may be explained by the effect of the perennial ley. Perennial grassland, with a long growing period, takes up inorganic N at times when it would otherwise be exposed to runoff (e.g. Bergström, 1987; Gustafson, 1987). Our mea-surements of the N concentrations in drainage water (Month Numbers 10–12, Fig. 2) substantiate this hy-pothesis. The largest discrepancies between arable and forage systems were found in autumn, after crop harvest.
5. Conclusions
The arable cropping systems in this experiment were found to have negative N balances, implicating a net ‘soil N mining’ in all systems. The net exploitation of the soil N pool increased with decreasing N input. These results underline the difficulties in maintain-ing long term crop production in ecological rotations with a high proportion of arable crops. The low-input arable system (ECO-A) had, however, the lowest N runoff. In the long run the systems are expected to ap-proach new equilibria, with lower contents of soil N. Only the forage system with the highest N input (CON-F) maintained the initial soil N content, but this system also had the highest N runoff of the forage rotations. When considering both preservation of soil N and N losses, the forage system with reduced N inputs (INT-F) appeared to be the most favourable of all systems in the present experiment. The ecological forage system (ECO-F) needs some major adjustments in order to balance the N budget.
Nitrogen balance calculations are well suited as simple predictors for N runoff from different cropping systems. When using annual N balances (Nfertiliser+Nslurry−Nharvest), annual precipitation
and the precipitation from the previous year in a three-predictor linear regression model, 87 and 65% of the variation in annual N runoff could be explained
from the arable and forage cropping systems, respec-tively. Using the same balance model, but with the N flows averaged over 8 years, 86% of the variation in N runoff from the arable systems was accounted for by the N balance alone.
Acknowledgements
We gratefully acknowledge T.M. Henriksen for fruitful discussions and valuable comments during the writing of this paper, L.R. Bakken and H. Riley for critically reading the manuscript and O. Nordheim for his skilled technical assistance. The project was funded jointly by the Research Council of Norway, Hydro Agri Norway and by the Norwegian Ministry of Agriculture.
References
Allen, S.E., Grimshaw, H.M., Parkinson, J.A., Quarmby, C., 1974. Chemical Analysis of Ecological Materials. Blackwell Scientific Publications, Oxford, 565 pp.
Bergström, L., 1987. Nitrate leaching and drainage from annual and perennial crops in tiledrained plots and lysimeters. J. Environ. Qual. 1, 11–18.
Bergström, L., Brink, N., 1986. Effects of differentiated applications of fertilizer N on leaching losses and distribution of inorganic N in the soil. Plant Soil 93, 333–345.
Christensen, B.T., 1990. Long-term changes in soil organic matter content of three experiments: effect of fertilization, straw incorporation and crop rotation. Decomposition and soil organic matter, NJF-utredning/rapport 57, 123–128.
Dick, R.P., 1992. A review: long-term effects of agricultural systems on soil biochemical and microbial parameters. Agric. Ecosyst. Environ. 40, 25–36.
Eltun, R., 1994. The Apelsvoll cropping system experiment I. Background, objectives and methods. Norw. J. Agric. Sci. 8, 301–315.
Eltun, R., 1995. Comparisons of nitrogen leaching in ecological and conventional cropping systems. Biol. Agric. Hortic. 11, 103–114.
Eltun, R., Fugleberg, O., 1996. The Apelsvoll cropping system experiment VI. Runoff and nitrogen losses. Norw. J. Agric. Sci. 10, 229–248.
Fettell, N.A., Gill, H.S., 1995. Long-term effects of tillage, stubble, and nitrogen management on properties of a red-brown earth. Aust. J. Exp. Agric. 35, 923–928.
Fischer, N.M., 1996. The potential of grain and forage legumes in mixed farming systems. In: Younie, D. (Ed.), Legumes in Sustainable Farming Systems. No. 30, pp. 290–299. Gomez, K.A., Gomez, A.A., 1984. Statistical Procedures for
Gustafson, A., 1987. Nitrate leaching from arable land in Sweden under four cropping systems. Swed. J. Agric. Res. 17, 169–177. Halberg, N., Steen Kristensen, E., Sillebak Kristensen, I., 1995. Nitrogen turnover on organic and conventional mixed farms. Agric. Environ. Ethics 8, 30–51.
Hansen, S., 1993. Ecological agriculture: nitrogen balance in field influenced by fertilization and soil compaction. In: Hansen, S. (Ed.), Agronomic and Environmental Effects of Fertilization and Soil Compaction. Agricultural University of Norway, pp. 1–28.
Hansen, S., 1995. Effects on soil compaction and manure level on utilization of nitrogen in cattle slurry. In: Samuelsen, R., Solsheim, B., Pithan, K., Watten-Melwaer, E. (Eds.), Crop Development for the Cool and Wet Regions of Europe — Nitrogen Supply and Nitrogen Fixation of Crops for Cool and Wet Climates. Proceedings of the COST 814 Workshop, Tromsø, Norway, pp. 135–142.
Haynes, R.J., 1986. Mineral Nitrogen in the Plant–soil System. Academic press, London, 483 pp.
Heenan, D.P., McGhie, W.J., Thomson, F.M., Chan, K.Y., 1995. Decline in soil organic carbon and total nitrogen in relation to tillage, stubble management, and rotation. Aust. J. Exp. Agric. 35, 877–884.
Holtan-Hartwig, L., Bøckman, O.C., 1994. Ammonia exchange between crops and air. Norw. J. Agric. Sci. 14, 5–40. Horlacher, D., Marschner, H., 1990. Schätzrahmen zur
Beurteilung von Ammoniakverlusten nach Ausbringung von Rinderflüssigmist. Z. Pflanzen. Bodenk. 153, 107–115. Høgh-Jensen, H., Steen Kristensen, E., 1995. Estimation of
biological N2 fixation in a clover–grass system by the 15N
dillution method and the total-N difference method. Biol. Agric. Hortic. 11, 203–219.
Høyås, T.R., Vagstad, N., Bechmann, M., Eggestad, H.O., 1997. Nitrogen budget in the river Auli catchment: a catchment dominated by agriculture, in southeastern Norway. Ambio 26, 289–295.
Jenkinson, D.S., 1990. Leaks in the nitrogen cycle. In: Merckx, R., Vereecken, H., Vlassak, K. (Eds.), First International Symposium: Fertilization and Environment. Universitaire Pers Leuven, Leuven, Belgium, pp. 35–49.
Johnson, R.A., Wichern, D.W., 1992. Applied Multivariate Statistics. Prentice-Hall, London, 642 pp.
Kristensen, L., Stopes, C., Kølster, P., Granstedt, A., 1995. Nitrogen leaching in ecological agriculture: summary and recommendations. Biol. Agric. Hortic. 11, 331–340. Lunnan, T., 1988. Mixtures of barley and different legumes for
forage. Norsk landbruksforsking 2, 219–232.
Lunnan, T., 1989. Red clover, white clover, lucerne and goat’s rue in mixture with timothy and in pure stands. Norsk landbruksforsking 3, 25–39.
Lyngstad, I., 1990. A lysimeter study on the nitrogen balance in soil I. Fate of 15N-labelled nitrate fertilizer applied to barley. Norw. J. Agric. Sci. 4, 119–128.
Maag, M., 1995. Denitrification losses from sandy and sandy loam soils under spring barley fertilized with slurry and ammonium nitrate. Acta Agric. Scand. B 45, 234–241.
Macdonald, A.J., Powlson, D.S., Poulton, P.R., Jenkinson, D.S., 1989. Unused fertilizer nitrogen in arable soils — its contribution to nitrate leaching. Sci. Food Agric. 46, 407–419. Minderman, G., 1968. Addition, decomposition and accumulation
of organic matter in forest. Ecology 56, 255–362.
Mitchell, C.C., Westerman, R.L., Brown, J.R., Pech, T.R., 1991. Overview of long-term agronomic research. Agron. J. 83, 24– 29.
Nyborg, M., Solberg, E.D., Izaurralde, R.C., Malhi, S.S., Molina-Ayala, M., 1995. Influence of long-term tillage, straw and N fertilizer on barley yield, plant-N uptake and soil-N balance.. Soil Till. Res. 36, 165–174.
Penfold, C.M., Miyan, M.S., Reeves, T.G., Grierson, I.T., 1995. Biological farming for sustainable agricultural production. Aust. Exp. Agric. 35, 849–856.
Petterson, P., Salomonsson, L., Nordkvist, E., 1998. Differences in botanical and chemical composition of forage from organic and conventional leys: a survey at farm field level. Acta Acric. Scand. B 48, 18–25.
Poulton, P.R., 1995. The importance of long-term trials in understanding sustainable farming systems: the Rothamsted experiance. Aust. Exp. Agric. 35, 825–834.
Raun, W.R., Johnson, G.V., Phillips, S.B., Westerman, R.L., 1998. Effect of long-term N fertilization on soil organic C and total N in continous wheat under conventional tillage in Oklahoma. Soil Till. Res. 47, 323–330.
Riley, H., Eltun, R., 1994. The Apelsvoll cropping system experiment II. Soil characteristics. Norw. J. Agric. Sci. 8, 317– 333.
Ryden, J.C., 1985. Denitrification loss from managed grassland. In: Golterman, H.L. (Ed), Denitrification in the Nitrogen Cycle. Plenum Press, New York, pp. 121–134.
Solberg, S.Ø., 1995. Influence of crops and cultivation management on the nitrogen leaching potential on ecological farms in south east Norway. Biol. Agric. Hortic. 11, 115–121.
Steen Kristensen, E., Høgh-Jensen, H., Sillebak Kristensen, I., 1995. A simple model for estimation of atmospherically-derived nitrogen in grass–clover systems. Biol. Agric. Hortic. 2, 263– 276.
Svensson, B.H., Klemedtsson, L., Simkins, S., Paustian, K., Rosswall, T., 1991. Soil denitrification in three cropping systems characterized by differences in nitrogen and carbon supply I. Rate distribution frequencies, comparison between systems and seasonal N-losses. Plant Soil 138, 257–271.
Thompson, R.B., Pain, B.F., Lockyer, D.R., 1990. Ammonia volatilization from cattle slurry following surface application to grassland I. Influence of mechanical separation, changes in chemical composition during volatilization and the presence of grass sward. Plant Soil 125, 109–117.
Thomsen, I.K., Christensen, B.T., 1998. Cropping system and residue management effects on nitrate leaching and crop yields. Agric. Ecosyst. Environ. 68, 73–84.
Tørseth, K., Manø, S., 1996. Overvåking av langtransportert forurenset luft og nedbør. Atmoskfærisk tilførsel 1996. Norsk institutt for luftforskning, Kjeller, Norway.
Uhlen, G., 1991. Long-term effects of fertilizers, manure, straw and crop rotation on total-N and total-C in soil. Acta Agric. Scand. B 41, 119–127.
Uhlen, G., 1994. The leaching behaviour and balances of nitrogen and other elements under spring wheat in lysimeter experiment 1985–92. Acta Agric. Scand. B 44, 201–207.
Vagstad, N., Eggestad, H.O., Høyås, T., 1997. Mineral nitrogen in agricultural soils and nitrogen losses: relation to soil properties, weather conditions and farm practices. Ambio 26, 266–272.
Vinten, A.J.A., Howard, R.S., Redman, M.-H., 1991. Measurements of nitrate leaching losses from arable plots under different nitrogen input regimes. Soil Use Manage. 7, 3–14. Whitehead, D.C., 1995. Grassland Nitrogen. CAB International,
Wallingford, 397 pp.