PROBABILISTIC FEASIBILITY OF THE RECONSTRUCTION PROCESS OF
RUSSIAN-ORTHODOX CHURCHES
M. Chizhovaa∗, A. Brunnb, U. Stillac
a,b
University of Applied Sciences W¨urzburg-Schweinfurt, R¨ontgenring 8, 97070, W¨urzburg, Germany cTechnical University of Munich, Arcisstr. 21, 80333 M¨unchen, Germany
a
[email protected],[email protected],[email protected]
Commission V, WG V/2
KEY WORDS:Building reconstruction, laserscanning data, 3d-point cloud, russian-orthodox churches, probability
ABSTRACT:
The cultural human heritage is important for the identity of following generations and has to be preserved in a suitable manner. In the course of time a lot of information about former cultural constructions has been lost because some objects were strongly damaged by natural erosion or on account of human work or were even destroyed. It is important to capture still available building parts of former buildings, mostly ruins. This data could be the basis for a virtual reconstruction. Laserscanning offers in principle the possibility to take up extensively surfaces of buildings in its actual status.
In this paper we assume a priori given 3d-laserscanner data, 3d point cloud for the partly destroyed church. There are many well known algorithms, that describe different methods of extraction and detection of geometric primitives, which are recognized separately in 3d points clouds. In our work we put them in a common probabilistic framework, which guides the complete reconstruction process of complex buildings, in our case russian-orthodox churches.
Churches are modeled with their functional volumetric components, enriched with a priori known probabilities, which are deduced from a database of russian-orthodox churches. Each set of components represents a complete church. The power of the new method is shown for a simulated dataset of 100 russian-orthodox churches.
1. INTRODUCTION 1.1 Motivation
The cultural human heritage is important for the identity of the following generations and has to be preserved in a suitable man-ner. Knowledge about findings in combination with the age and the local environment allows a reconstruction of the cultures. The complete capture of the findings and the documentation of the material legacies is absolutely necessary. Knowledge on cultural objects, especially on buildings, was lost to some degree in the course of time. A lot of buildings have been completely distroyed or strongly damaged. Nowadays a lot of buildings are just ruins.
The stone orthodox churches could be considered as an example. There are a lot of such churches, especially on the territory of Russia, Belarus and Ukraine. Lots of them are partly destroyed and are not used for religious prupose any more. There is a huge interest in reconstruction and restauration of this objects. It is necessary to observe a considerable quantity of the architectural canons determined by the clergy to reconstruct those damaged churches. These canons were result of the evolution of culture in that territory (and that time), in which we observe specific churches. Nevertheless it is possible to claim, that each church has accurately certain topological structure of some elements, de-termined by the architects of the clergy. Each of these elements (component) is featured by geometrical properties.
3d-laserscanning is an actual and efficient method to document the actual status of the damaged churches in an “as they are” status. Starting from the resulting 3d-point clouds plan update, findings documentation and production of facade views becomes possible.
∗Corresponding author
A virtual visualization of the real scenario is provided thus by the measuring with this non-touch techniques. From the large quantity of measured points a high quality information results, which allows a quick, detailed picture of complicated objects. The application of our method, developed in this work, help us to classify those partly destroyed canonic components according to their remaining geometrical features by probabilistic knowledge, to reconstruct the complete church and, lateron, to optimize the probabilitic modeling for the 3d-recontruction and 3d-modeling of subsequent reconstructions.
Therefore, the following of the article is devided in three parts: after a brief review on previous work (sec. 2.) the new recon-struction method for buildings is presented focussing on russian-orthodox churches (sec. 3.). The arcticle finishes with an outlook and some conclusions.
2. PREVIOUS WORK
For this article previous work on building reconstruction is im-portant.
On the one hand the reconstruction of geometric models from point clouds has been handled in a large number of papers. Early works used range images (e.g. (Maitre et al., 1990), (Lim et al., 1990)) similar to airborne laserscanner data. Recent approaches prefer algorithms on 3d-point clouds. Point clouds result from terrestrial laserscanning, airborne laserscanning or image match-ing techniques. This paper uses 3D point clouds in reconstruction process too.
(Nguatem et al., 2013) is looking for the main structures of build-ings. (Wichmann et al., 2015) builts a topological graph of the plane parts of roof, but uses just range images again. Neverthe-less, airborne laserscanning is very good for the roof reconstruc-tion of buildings.
In (Overby et al., 2004) a measured building was bounded with a virtual box, a roof surface was fitted and reconstruct using roof points clustering. In (Nizar et al., 2006) they reconstruct building roof, using crease line extraction on roof surfaces following the application of geometric constraints.
Considering reconstruction from terrestrial Laserscanning, we ob-serve such methods, like an automatically buildings reconstruc-tion using rotating box method in (Meouche et al., 2013). In (Jenke et al., 2006) the scene recontruction is based on Bayesian statistics considering the set of possible scenes with comparison to all possible measurements of them.
An important pre-step for building reconstruction is the extrac-tion resp. detecextrac-tion of geometry in the point cloud. The detailed descriptions of geometrical primitive extraction from point cloud using the methods of differential geometry are given in (Becker, 2005). RANSAC is most common for the detection of different geometric primitives in the point cloud. (Schnabel et al., 2007) uses efficient RANSAC for the fitting of geometrical forms. The algorithm finds a best-fit geometrical form from candidates for the surface. In (Pu and Vosselman, 2013) they do point cloud segmentation using planar surface growing algorithm, then they consider feature recognition for the following building extraction. (Kollmann, 2013) uses the orientation graph of global relations between shape primitives, to extract the non-conflicting set of parallel and orthogonal orientations.
All mentioned research believes in the geometric interpretation of the point cloud or range images. (Xiong et al., 2015) added the topological point of view for the complete roof structure. Each face of the building is represented as a node in a graph with the graph edges showing spatial neighborhood relations.
On the other hand Constructive-Solid-Geometry (CSG) knows the concept of creating complex building by set operations like intersection and union on volumetric objects.
It becomes clear, that a strong object model is necessary for our task, especially for uncomplete buildings. In this article we pro-pose a set of building models for Russian-Othodox Churches, that model could be extended to the grammar of church com-ponents. In our work we consider non-planar, unregular objects, which consist of sets of modeled components. We reconstruct ab-sent parts and components (destroyed or ruined) with the highest probability using a library with mathematical described church components. Our approach is an extension of the work presented in (Brunn, 2000), where functional graph components have been modeled on a low representation level for building reconstruction from airborne laserscanner data.
We use the graph representation to get an optimal detection path for each component. We rely on the following assumption, which is proved from architectural literature:
Russian-Orthdox churches consist of several known parts. A lot of them can be modeled by aggregation of different building parts. Each part can be named, e.g. cupola, crucifix, altar, nave and aisle. All church components have topological and probablistic conjunctions to each other (cf. (Kesler, 2003), cf. fig. 1).
Idea: we build a set of church models. Each set has a different number of nodes and different number of node types which are
(a) Overlay on church.
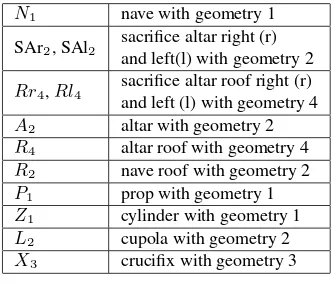
Figure 1: Modeling of the church ”Pokrova-na-Nerli” by its com-ponents.
N1 nave with geometry 1
SAr2, SAl2 sacrifice altar right (r)
and left(l) with geometry 2
Rr4,Rl4
sacrifice altar roof right (r) and left (l) with geometry 4 A2 altar with geometry 2
R4 altar roof with geometry 4
R2 nave roof with geometry 2
P1 prop with geometry 1
Z1 cylinder with geometry 1
L2 cupola with geometry 2
X3 crucifix with geometry 3
Table 1: ID-names of church components
functions. Each node has several possible geometric realiations in behind. In this paper we assume a given graph for the set of churches with the fixed number of nodes and the fixed number of fuction parts. We will show in this paper, how to reconstruct the geometric type of missing building parts by Bayesian statistics.
3. RECONSTRUCTION METHOD 3.1 Outline of the method
Figure 2: Forms development of cupola and crucifix.
components have a defined geometry. We have created a clas-sification library of such components and organized the church-construction like a graph, which presents different combinations of the structure components and their geometries. We have rec-ognized possible combinations and quantities of churches with those combinations. From this research, we can get some prob-ability relations between church components in the graph. The algorithm starts with detection/extraction in the point cloud of ge-ometric objects, which will be considered as founded or detected church components. This data will be organized in subgraph/ ”subcombination”. Our statistical research of real churches helps our algorithm, to make a correct decision and to determine with defined probability based on derived relations between structural components, what components else could have a destroyed church (what components are missed in the graph) and how it could be seemed, if we have already found the others components.
3.2 Church components classification
The external architecture of the orthodox churches is determined by the internal sacred duties and stamps itself by building typol-ogy corresponds to the certain cannons. Still there is also a big architectural variety under these churches. The temporal devel-opment of the orthodox church construction is distinguished by a essential influence of other cultures and epochs. There are also regional differences, because a large part of the east church com-munities is autocephalic, on the other hand, a regional building materials and influence of other religious communities plays an important role in this process. Thus, we can class the concrete component of the Russian churches. Historical development had especially an effect on the forms of cupola and crucifix, what has caused the variety of their different combinations (cf. fig. 2).
A short classication of most common Russian cupolas and cru-cixes can be found in tab. 2.
3.3 Step-to-Step workflow example We use simulated data to show our method.
3.3.1 Simulation of data For classification we have taken three variations of most common in the Central Region of the Rus-sia (Region of the Golden Ring) crucifixes and cupolas, which differ from each other in geometry. So we have simulated 100 churches according to our classifications in considering of all
L1 X1
L2 X2
L3 X3
L4 X4
L5 X5
Table 2: Geometries of church components in the region of the golden ring (central region of Russia).
possible combinations of its structure elements. In our example we would like to recognize only crucifixes (X) and cupolas (L).
Crucifixes and cupolas have certain geometries, which we repre-sent with an additional number of the component: crucifix geom-etry -X0,X1,X2,X3; cupola geometry -L0,L1,L2,L3. With 0
we have marked the absent components. We have it so simulated (the investigation of orthodox churches will show it later), that all churches will have cupola and crucifixes, then the probability of X0andL0is 0.
And now we must make a clear separation between not detected and absent objects. Absent objects are the objects, that not all churches would have (for example: not all churches will have 4 neighbouring cupolas). We call these objects ”0”-objects (like X0orL0).
We can state, that the component was not detected, if:
• The objects do not have sufficient amount of the points (if the component are ruined or cannot be scanned on account of her physical features or reflection);
• The point cloud of the component exists, but its geometry is not known for the system (or is not described), it means there is no such component in our library. As the next step the system puts this component as a new geometry which should be recognized and describe. Such object we mark with indexn(XnorLn).
With the statement ”not (concrete component)” (for example, not X3or notL2) we say, that the necessary detection terms are
ful-filled (for the geometry detection of the components except ”0”-component it becomes, e.g., the sufficient number of the points,
for ”0”-component is almost full absence of the points (then we have such ”a hole” in the point cloud)), but the suggested geom-etry does not fit the object.
Ci C1 C2 C3 C4 C5 C6 C7 C8 C9 C10 C11 C12 C13 C14 C15 C16
Xk X0 X1 X2 X3 X0 X1 X2 X3 X0 X1 X2 X3 X0 X1 X2 X3
Lj L0 L0 L0 L0 L1 L1 L1 L1 L2 L2 L2 L2 L3 L3 L3 L3
#(Ci) 0 0 0 0 0 16 1 16 0 13 5 24 0 14 4 7
Table 3: Simulation of numbers all 16 types of churches.
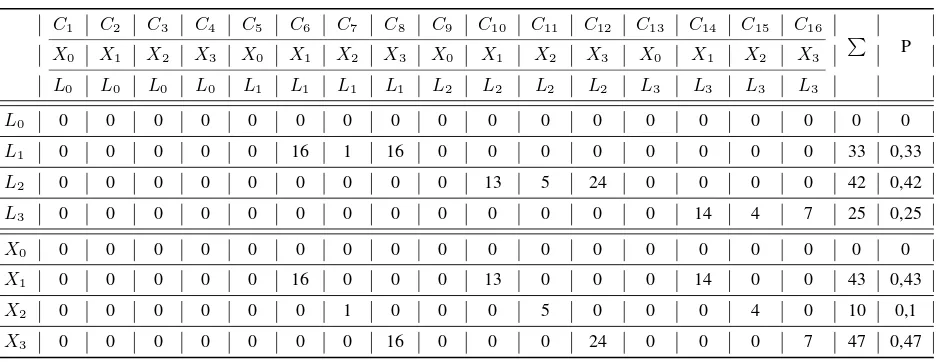
C1 C2 C3 C4 C5 C6 C7 C8 C9 C10 C11 C12 C13 C14 C15 C16
P
P
X0 X1 X2 X3 X0 X1 X2 X3 X0 X1 X2 X3 X0 X1 X2 X3
L0 L0 L0 L0 L1 L1 L1 L1 L2 L2 L2 L2 L3 L3 L3 L3
L0 0 0 0 0 0 0 0 0 0 0 0 0 0 0 0 0 0 0
L1 0 0 0 0 0 16 1 16 0 0 0 0 0 0 0 0 33 0,33
L2 0 0 0 0 0 0 0 0 0 13 5 24 0 0 0 0 42 0,42
L3 0 0 0 0 0 0 0 0 0 0 0 0 0 14 4 7 25 0,25
X0 0 0 0 0 0 0 0 0 0 0 0 0 0 0 0 0 0 0
X1 0 0 0 0 0 16 0 0 0 13 0 0 0 14 0 0 43 0,43
X2 0 0 0 0 0 0 1 0 0 0 5 0 0 0 4 0 10 0,1
X3 0 0 0 0 0 0 0 16 0 0 0 24 0 0 0 7 47 0,47
Table 4: Calculation of the border numbers of allLandX.
The golden cupolas were not represented because of its reflec-tion properties. Thus we can think that our algorithm puts this cupola as absent or ”0”-component (a probability of its event is 0). However, this does not happen because our system based of statistical and probabilistic derivations will sort out the compo-nent with probability = 0 and puts the most likely compocompo-nent.
At first we define all possible combinations of structure compo-nents and score in the table 3 the number#(Ci) = #(Li, Xi)
of the churches with such combination.
So we have a set of100churches with16different geometries Ci, i= 1. . .16, i.e. 16 different combinations including the0
casesL0andX0. In non simulated scenarios this would be the
result of the analysis of a database of churches.
All frequencies and probabilities, which are used in the following steps, can be calculated from the data in tab. 3.
3.3.2 Probabilistic strategy We perform a guided search al-gorithm to find the optimal church reconstruction. The search is statistical driven starting with the most probable geometry for each component.
In general there are several possibilities to start the search:
• probable church (most probable combination of components) and
• the combination of the most probable components
We prefer the second alternative. We assume, that there are un-kown types of churches around, which can be constructed using the modeled components, although there is no example of this church in the database.
To calculate the finding of the most probable components, we have deduced the border numbers of all combinations ofLand
Xfrom the simulated data (cf. tab. 4).
F(Xk) = X
i
F(Ci|X =k) (1)
F(Lj) = X
i
F(Ci|L=j) (2)
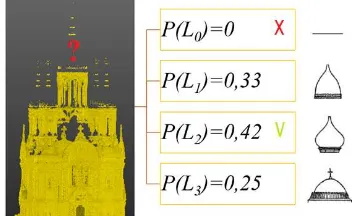
Then we write out a quantity of those churches, which have a cer-tain structural component, add it up and calculate the probability of each component with this formula:
P(Xk;Lj) =
number of churches with concrete component number of all churches (3)
fork, l= 1, . . .4.
In the shown exampleL2withP = 0,42andX3withP= 0,47
have to choosen. The geometries of both components are tested in the 3d point cloud, e.g. by 3d cloud matching. There are four possible results (cf. tab. 5):
L2found L2not found
X3found case A1 case A2
X3not found case A3 case A4
Table 5: All possible results in the first geometry test.
A1 L2 detected (known geometry after applying of geometric
algorithm on laserscanner data),X3detected (known
geom-etry from laserscanner data);
A2 L2 detected, X3 not detected (not known geometry from
laserscanner data);
A3 L2not detected,X3detected;
Variation X0 X1 X2 X3 X0 X1 X2 X3 X0 X1 X1 X3 X0 X1 X2 X3 Churches quantity
L0 L0 L0 L0 L1 L1 L1 L1 L2 L2 L2 L2 L3 L3 L3 L3
A2 0 0 0 0 0 0 0 0 0 13 5 0 0 0 0 0 18
A3 0 0 0 0 0 0 0 16 0 0 0 0 0 0 0 7 23
A4 0 0 0 0 0 16 1 0 0 0 0 0 0 14 4 0 35
P
=76
Table 6: Remaining numbers in the cases 2 to 4.
Vari-ation
X0 X1 X2 X3 X0 X1 X2 X3 X0 X1 X2 X3 X0 X1 X2 X3 Churches
quantity
L0 L0 L0 L0 L1 L1 L1 L1 L2 L2 L2 L2 L3 L3 L3 L3
B2 0 0 0 0 0 16 0 0 0 0 0 0 0 0 0 0 16
B3 0 0 0 0 0 0 0 0 0 0 0 0 0 0 4 0 4
B4 0 0 0 0 0 0 1 0 0 0 0 0 0 0 0 0 1
P
=21
Table 7: Remaining numbers in the cases B2-B4.
By the 1st variant the system will be stopped, because all the components are detected.
Let us consider the residual variants 2 to 4, according to this vari-ations we have the combinvari-ations shown in tab.6.
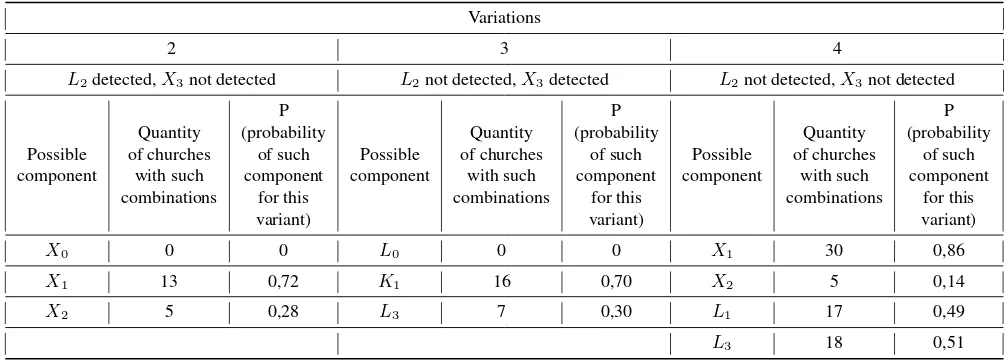
In this variations we can observe the following situations with suitable probabilities
P(Xk, k6= 2;Lj, j6= 3) =
component number
churches number in the variation (4)
So we can consider following situations according to each varia-tion:
A2 In the 2nd variation we can detect eitherX1with
probabil-ity 0,72 orX2 with probability 0,28. If both components
were not detected, we can state, that there are not sufficient conditions for geometry detection or it is a new geometrical object to recognize and to describe.
A3 In the 3rd variation we can detect eitherL1with
probabil-ity 0,69 orL3 with probability 0,31. If both components
were not detected, we can state, that there are not sufficient conditions for geometry detection or it is a new geometrical object to recognize and to describe.
A4 As we can see, in the 4th variation, in which 2 components were not detected, we have 4 variations again:
B1 X1detected,L3detected;
B2 X1detected,L3not detected;
B3 X1not detected,L3detected;
B4 X1not detected,L3not detected;
Analogical to previous step we recognize the variations 2, 3, 4 (in the 1st variation all components are detected) with residual com-binations (without componentsL2andX3from previous cycle)
shown in tab. 7.
In this step we can observe following situations:
B2 IfX1was detected andL3was not detected, then:
• possible component isL1;
• in case, that this component -L1- was not detected,
we can state, that there are not sufficient conditions for geometry detection or it is a new geometrical object to recognize and to describe.
B3 IfX1was not detected andL3was detected, then:
• possible component isX2;
• in case, that this component -X2 - was not detected,
we can state, that there are not sufficient conditions for geometry detection or it is a new geometrical object to recognize and to describe.
B4 IfX1was not detected andL3was not detected, then:
• possible elements areL1andX2;
• in case, that the both components -L1andX2- were
not detected, we can state, that there are not sufficient conditions for geometry detection or it is a new geo-metrical object to recognize and to describe.
If we dont consider the situation, where the new object must be described, the algrotihm find the missed part of the church and definde the geometrical outlook of this part (cf. fig. 3).
Variations
2 3 4
L2detected,X3not detected L2not detected,X3detected L2not detected,X3not detected
Possible
Table 8: Calculation of the border numbers of allLandX.
L2?,X3?
Table 9: Searchgraph of the example. The leaves of the graph in light red color mark final classifications steps.
4. OUTLOOK AND CONCLUSIONS
In this article we presented a new method in 3d building recon-struction, that uses statistical information to steer the reconstruc-tion process. The feasibility of the algorithm has been demon-strated for a part of russian-orthodox church.
As we can see, this process is final and can lead either to the detection or the invention of a new unrecognized object (cf. 9). In the worst case all combinations have to be tested. If the geo-metry does not fit to any component type, a new geogeo-metry of this component has to be created to extend the number of geometries.
This method is only one step in the reconstruction of partly dis-troyed russian-orthodox churches. Geometric model fitting of the components in the 3d point cloud have to be faced in future work.
Actual activities try to substitute the simulated probabilities by real data for a closed geographic region and architectural period.
REFERENCES
Becker, R., 2005. Differentialgeometrische Extrak-tion von 3D-Objektprimitiven aus terrestrischen Laser-scannerdaten. PhD thesis, Ver¨offentlichungen des
Geod¨atischen Instituts der Rheinisch-Westf¨alischen Tech-nischen Hochschule Aachen, N63, https://www.deutsche-digitale-bibliothek.de/binary/WI6IH566CY75KXJY3QX JBTG-MXWKJI5TS/full/1.pdf.
Brunn, A., 2000. A step towards semantic-based building recon-struction using markov-random-fields. ISPRS Congress, Amster-dam, IAPRS, Vol. 32(B).
Jenke, P., Wand, M., Bokeloh, M., Schilling, A. and Strasser, W., 2006. Bayesian point cloud reconstruction. Computer Graphics Forum, Volume 25, Number 3.
Kesler, M., 2003. Pravoslavnye hramy i komplexy, Tom 2, Poso-bie po proektirovaniju i stroitelstvu. MDS 31-9.2003.
Kollmann, I. R., 2013. Reconstruction of 3D Models from Im-ages and Point Clouds with Shape Primitives. PhD thesis, Tech-nische Universit¨at Wien.
Lim, Y. S., Cho, T. and Park, K. H., 1990. Range image seg-mentation based on 2d quadratic function approximation. Journal Pattern Recognition Letters 11(10), pp. 699-708.
Meouche, R. E., Rezoug, M., Ihab, H. and Maes, D., 2013. Au-tomatic reconstruction of 3d building models from terrestial laser scanner. ISPRS Annals of Photogrammetry, Remote Sensing and Spatial Information Sciences 01/2013.
Nguatem, W., Drauschke, M. and Mayer, H., 2012. Finding cuboid-based building models in point clouds. In: International Archives of Photogrammetry, Remote Sensing and Spatial Infor-mation Sciences, Vol. XXXIX-B3.
Nguatem, W., Drauschke, M. and Mayer, H., 2013. Roof re-construction from point clouds using importance sampling. In: ISPRS Annals of Photogrammetry, Remote Sensing and Spatial Inforamtion Sciences, Vol. II-3/3.
Nizar, A. A., Filin, S. and Doytsher, Y., 2006. Reconstruction of buildings from airborne laserscanning. ASPRS Annual Confer-ence Reno, Nevada 2006.
Overby, J., Bodum, L., Kjems, E. and Ilsoe, P. M., 2004. Auto-matic 3d building reconstruction from airborne laserscanning and cadastral data using hough transform. ISPRS proceedings, 2004.
Pu, S. and Vosselman, G., 2013. Automatic extraction of building
features from terrestrial laserscanning. ISPRS Annals of the Pho-togrammetry, Remote Sensing and Spatial Information Sciences, Volume II-4/W1, 2013.
Schnabel, R., Wahl, R. and Klein, R., 2007. Efficient ransac for point-cloud shape detection. Computer Graphics Forum (Juni 2007), 26:2, pp. 214-226.
Wichmann, A., Jung, J., Sohn, G., Kada, M. and Ehlers, M., 2015. Integration of building knowledge into binary space parti-tioning for the reconstrction of regularized building models. In: ISPRS Annals of Photogrammetry, Remote Sensing and Spatial Inforamtion Sciences, Vol. II-3/W5.
Xiong, B., Jancosek, M., Elberink, S. O. and Vosselman, G., 2015. Flexible building primitives for 3d building modeling. IS-PRS Journal of Photogrammetry & Remote Sensing 101, pp. 275-290.