PHOTOGRAMMETRIC 3D ACQUISITION AND ANALYSIS OF MEDICAMENTOUS INDUCED PILOMOTOR REFLEX
(
“
GOOSE BUMPS”
)
D. Schneider, A. Hecht
Institute of Photogrammetry and Remote Sensing, Technische Universität Dresden, Germany – [email protected], [email protected]
Commission V, WG V/5
KEY WORDS: surface measurement, structured-light, structure-from-motion, medical science, depth image, image analysis
ABSTRACT:
In a current study at the University Hospital Dresden, Department of Neurology, the autonomous function of nerve fibres of the human skin is investigated. For this purpose, a specific medicament is applied on a small area of the skin of a test person which results in a local reaction (goose bumps). Based on the extent of the area, where the stimulation of the nerve fibres is visible, it can be concluded how the nerve function of the skin works. The aim of the investigation described in the paper is to generate 3D data of these goose bumps. Therefore, the paper analyses and compares different photogrammetric surface measurement techniques in regard to their suitability for the 3D acquisition of silicone imprints of the human skin. Furthermore, an appropriate processing procedure for analysing the recorded point cloud data is developed and presented. It was experimentally proven that by using (low-cost)photogrammetric techniques medicamentous induced goose bumps can be acquired in three dimensions and can be analysed almost fully automatically from the perspective of medical research questions. The relative accuracy was determined with 1% (RMSE) of the area resp. the volume of an individual goose bump.
1. INTRODUCTION
Photogrammetric methods and image analysis methods are used in medical research and medical practice since a long while although the potential of photogrammetric methods is not exploited yet. This is in particular true if three-dimensional information is needed for specific medical questions since most applied techniques are based on 2D processing.
3D scanning techniques in medical applications are rather common within a considerable smaller scale such as microscopic dimensions (e.g. confocal laser scanning microscopy, focus variation microscopy, coherence scanning interferometry) and nano-dimensions (e.g. scanning electron microscopy), but rarely used in macroscopic dimensions of a few millimetres or centimetres (Scherer, 2007), (Koerfer & Schmitt, 2007). If scanning systems for macroscopic dimensions are used, they are mainly adapted from industrial systems (e.g. systems based on structured light projection) and therefore only partly appropriate for medical practice (Berggold & Häusler, 2010). For example, (Handels, 2009) shows that light sheet scanning can be used to capture silicone imprints of the human skin. However, structure-from-motion (SfM) methods are rather promising (Forsyth & Ponce, 2012) as they are much more flexible, require only low costs and offer much more acceptance if they are applied on humans as they are based on off-the-shelf cameras. Other alternatives are depth-from-focus (Geißler & Dierig, 1999), shape-from-shading techniques (Horn, 1970) or photometric stereo (Woodham, 1987).
In a current study at the University Hospital Dresden, Department of Neurology, a specific medical question is addressed: the autonomous function of nerve fibres of the human skin. The human skin covers an area of 1,5 – 2 m² and is therefore the largest organ of the human organism (Fritsch, 2009). Basically it consists of three layers: subcutaneous fat layer, dermis (1-2 mm thick) and the epidermis (0.07 mm thick) (Moll et. al., 2005). The skin fulfils a whole slew of functions, among others the function of protection: external stimuli, e.g. temperature or mechanical pressure, are transmitted by the autonomous nerve fibres to the
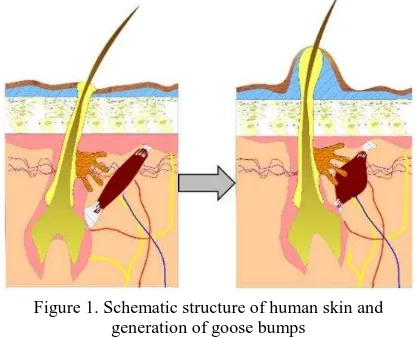
central nervous system which reacts thereupon. One possible reaction becomes visible in terms of goose bumps on the surface of the skin (pilomotor reflex). Such goose bumps arise because the arrector pili muscle (hair muscle) located within the second skin layer contracts (see Fig. 1) and stimulates sebaceous glands,
which convey sebum to the skin’s surface in order to protect it
from the external stimuli.
Figure 1. Schematic structure of human skin and generation of goose bumps
In order to investigate the autonomous function of nerve fibres, in this study a specific medicament is applied on a small area of the skin of the forearm of a test person (Siepmann et. al., 2013). Analysing the extent of the area, where the goose bumps become visible due to the indirect stimulation, and analysing the magnitude and shape of these goose bumps, allows for conclusions on the function of nerve fibres.
area of individual bumps as well as the total area and the number of individual bumps within that area. In contrast, 3D parameters promise much more valuable information for the medical research, which cannot be obtained by this evaluation method.
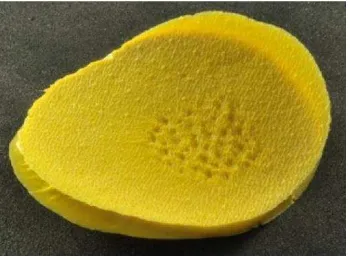
Figure 2. Silicone imprint of a goose bump area (approximately 5 cm diameter)
Therefore, first aim of the research described in this paper is to investigate and to compare different three-dimensional optical surface measurement techniques regarding their suitability for the recording of 3D point clouds of these silicone imprints, which allow for obtaining the relevant information with the desired accuracy (Chen et. al., 2000). Second aim is to apply the different measurement techniques to a selection of silicon imprints and to use these data to develop an appropriate processing procedure for analysing the recorded point clouds in terms of medical relevant parameters. Such parameters are for example the total number of goose bumps, the base area and volume of individual bumps as well as the total area and the volume of the whole stimulated region. Both, the recording methods and the developed processing method will be evaluated with regard to their accuracy.
2. DATA ACQUISITION
Assuming that an individual bump is at least 0.05 mm high, a method can be considered as suitable when its resolution is significantly below this value. Taking into account the practical feasibility, four different methods (Fig. 3) have been selected and tested experimentally:
Figure 3. Systems used for the acquisition of point clouds
1. Laser light sheet scanning (MicroScan) 2. Structured light projection
(GOM ATOS Triple Scan II)
3. Phasogrametry (Fraunhofer Kolibri Flex) 4. Structure-from-motion (Nikon D700 + Agisoft
PhotoScan)
In comparison to the first three methods, structure-from-motion requires a scale information within the object. Therefore, the silicone imprint was placed in the centre of a turning table and 20 coded targets, whose coordinates where measured in advance, where placed around the imprint and used as control points within the commercial SfM-software Agisoft PhotoScan. The image recording was done with a DSLR Nikon D700 in combination with a 55 mm macro lens and intermediate rings in order to increase the image scale (Yanagi & Chikatsu, 2010) (Fig. 4). In order to get problems with the depth of field under control a very small aperture was chosen (f/32), which has to be compensated by long exposure times of some seconds. Of course, this required the usage of a tripod.
Figure 4. Image configuration using a DSLR Nikon D700 with a macro lens and a turntable (Screenshot Agisoft PhotoScan)
In all cases the result is a three dimensional point cloud of the silicon imprint (negative copy of the real goose bumps). The accuracy assessment of the results is described in the following section.
3. COMPARISON OF DATA ACQUISITION METHODS
As the silicone imprint is placed on a plane surface for all data acquisition methods, the points around the silicone imprint representing this surface are used for the assessment of the accuracy. For this purpose, a plane is mathematically fitted into these points and the standard deviation of the remaining orthogonal distances is used as accuracy criterion in depth direction. In case of the GOM ATOS Triple Scan II and the
Fraunhofer Kobibri Flex the manufacturer’s accuracy
specifications could be confirmed. In case of the MicroScan the accuracy could be confirmed by the standard deviation resulting from the system calibration. The accuracy of the structure-from-motion data was computed as the average value of the residuals of the control points. Tab. 1 shows the results of the accuracy assessment together with other relevant information.
1. 2.
MicroScan Triple Scan II
Kolibri Flex
PhotoScan
Recording+ processing
time
60 min 60 min 45 min 330 min
System
costs 18,000 € 100,000 € 80,000 € 8,000 €
Calibration
method test field test field simultan. simultan.
Absolute
precision 0.138 mm 0.005 mm 0.005 mm 0.015 mm
Relative
precision 1 : 362 1 : 10,000 1 : 10,000 1 : 3,333
Lateral
resolution 0.138 mm 0.104 mm 0.053 mm 0.018 mm
Point density
179 pts/mm²
107 pts/mm²
663 pts/mm²
2916 pts/mm²
Table 1. Comparison of data acquisition methods
The accuracy assessment has shown that the best accuracy can be achieved with the systems ATOS Triple Scan II and Kolibri Flex (0.005 mm) in combination with short recording times. The image-based SfM method yielded poorer accuracy (0.015 mm). With the MicroScan system the required accuracy could not be achieved (0.138 mm). Differences in the point density result from an automatic reduction of the point number within the systems which are not relevant as the point densities of all data sets were sufficient for the aim of this study.
In spite of lower precision values, structure-from-motion represents an interesting alternative as it can be considered as low-cost-system. However, the recording and processing time is currently very high, but might be reduced in future by more application-adapted algorithms and other more specific settings.
4. DATA PROCESSING
In case of all acquisition methods the result is a dense point cloud (e.g. Fig. 5), which now has to be processed in order to obtain the medical relevant parameters. These parameters are the total number of goose bumps, the base area and volume of individual bumps as well as the total area and the volume of the whole stimulated region.
Figure 5. Structure-from-motion result (Screenshots Agisoft
–
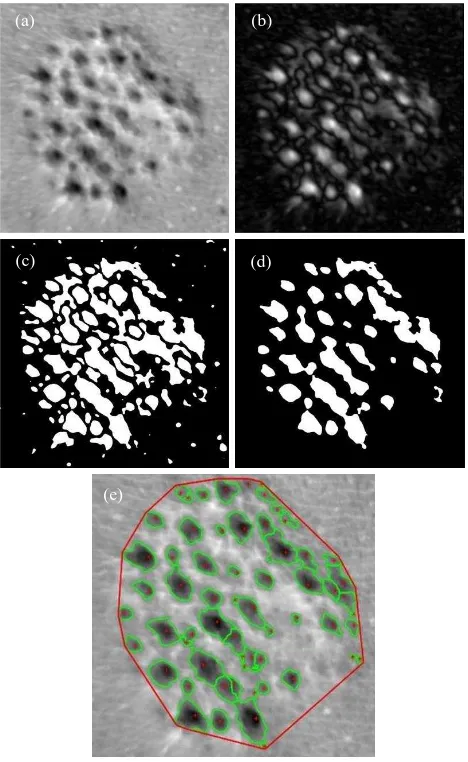
For that purpose, different methods were analysed. The final approach which was used for processing the recorded point clouds consists of a combination of different processing steps (Fig. 6) and can be summarized as follows. The individual steps are explained in more detail in subsections 4.1 – 4.4.
elimination of the long-wave portion caused by the curvature of the silicone imprints
generation of depth images by interpolating the point cloud on a regular grid (Fig. 6a)
smoothing with a median filter for eliminating high-frequency noise
calculation of the texture energy by Laws (Fig. 6b) binarisation using a relative threshold (15% of the
maximum texture energy) (Fig. 6c)
final segmentation by applying additional conditions (e.g. exclusion of negative heights) (Fig. 6d)
separation of connected bumps by a neighbourhood analysis method
counting number of bumps, calculation of base area and volume of individual bumps (Fig. 9) and their accuracies
calculation of the total area and volume of the stimulated region
visualization for medical qualitative interpretation (Fig. 6e)
Figure 6. Data processing chain
(a) (b)
(c) (d)
4.1 Depth images
In a first step the relevant area with visible goose bumps (ca. 2 × 2 cm) is cut out from the original point cloud.
The silicone imprints represent a part of the forearm of test persons, which result in an obvious curvature of the imprint. This natural curvature can be described as long-wave signal, which can be removed by fitting a polynomial surface into the original point cloud. The orthogonal distances between the original points and the polynomial surface are used as Z-coordinates for the resulting point cloud without that curvature. The optimal degree of the polynomial surface is determined by analysing the fitting quality and was defined in the study with a degree of 5. Based on the surface specific 2.5-dimensional character of the point cloud a transformation on a regular grid is possible by interpolation (e.g. Lohmann, 1998). The result of that interpolation are depth images, where the grey values represent the Z-coordinate (Fig. 6a). For these images a size of 1024 × 1024 pixel is defined which results in a grid element size of ca. 0.02 × 0.02 mm². The advantage of such depth images is the possibility of a direct application of standard 2D image processing algorithms.
Since some of the depth images contain high-frequency noise, they are smoothed by applying a median filter (Jiang & Bunke, 1997). For the determination of the optimal filter size, a RMSE-map is used (Vosselmann & Maas, 2010). It has to mentioned that the effect of filtering the point cloud data from the systems ATOS Triple Scan II and Kolibri Flex was very low. It is assumed that a similar filtering is already performed within the system.
4.2 Segmentation
The segmentation is carried out using a texture analysis method described in (Handels, 2009): at first the texture energy by Laws (Laws, 1980) is calculated (Fig. 6b) and afterwards an empirical defined relative threshold of 15% of the texture energy is applied in order to achieve a binarisation. The result of the binarisation is an initial segmentation of the depth image (Fig. 6c).
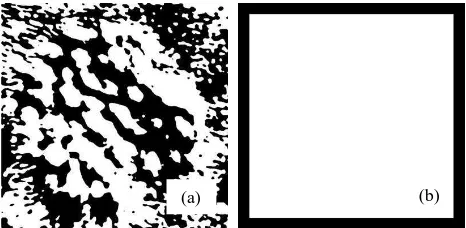
The segmentation is refined by applying two additional conditions: First condition is that no elevations may exist with a height value smaller than zero (Fig. 7a). The second condition says that there are no bumps in the boundary area of the matrix (Fig. 7b). Both conditions are formulated as binary matrices with the same size as the depth image. The final segmentation is produced by a logical conjunction of the matrices (Fig. 6d).
Figure 7. Addtional conditions formulated as binary matrices
4.3 Separation of connected bumps
In the next step all connected areas are numbered in an ascending order. Since two or more contiguous elevations may have been segmented together, a further inspection of each segmented area is necessary. This inspection is based on a neighborhood analysis method using a patch with a size of 5 × 5 pixels, which moves pixel-wise over each single segmented elevation in order to determine local minima. In case the method detects one minimum for the segmented evaluation, the segmentation remains unchanged. In case this method detects more than one minimum, the elevation is split into separate areas. Alternatively, a mathematical morphology approach might be eligible. However, in the study described here, the neighbourhood analysis method turned out to be more constructive. Fig. 8 shows the segmentation result before (Fig. 8a) and after (Fig. 8b) the separation.
Figure 8. Visualisation of the segmentation before (a) and after (b) the refinement through a neighboorhood analysis method
4.4 Calculation of medical relevant parameters
The results of the segmentation are boundaries of the separated elevations which represent the single bumps. These boundaries are visualized as additional layer on the original depth image for the purpose of a qualitative interpretation (Fig. 6e).
The boundaries might be considered as intermediate result which allow for the derivation of several parameters which are relevant for the medical research:
Directly as a result of the segmentation the number of separated segments, which corresponds to the number of bumps within the stimulated area, can be determined.
The base area of an individual goose bump can be computed by counting the raster elements consisting to a goose bump and multiplication with the area of one raster element (0.02 × 0.02 = 0.0004 mm²).
In order to get the volume of an individual goose bump at first the volume of the cuboid of each raster element, which consists to this goose bump, is computed and subsequently added together (Fig. 9).
Based on the entire segmented area a convex hull algorithm is applied which produces the borderline between stimulated area and surrounding area (red line in Fig. 6e). The number of pixel within the borderline multiplied with the area of one raster element results in the area of the stimulated region.
Figure 9. Calculation of the volume of an individual elevation as sum of the volumes of raster element cuboids
5. RESULTS
The method described in section 4 was implemented in MATLAB and fully automatic applied to the data of the silicone imprint shown in Fig. 2, Fig. 5 and Fig. 6 recorded with the system Kolibri Flex. This sample shows relatively obvious structured goose bumps. The results of selected medical relevant parameters are summarized in Tab. 2.
Parameter Sample 1
Number of goose bumps 61 Sum of base areas 71.77 mm²
Total volume of goose bumps 8.29 mm³
Area of stimulated region 220.11 mm²
Table 2. Relevant parameter values as result of a sample with obvious structured goose bumps (compare Fig. 6e)
In order to assess the accuracy of the area and volume of the goose bumps, a variance propagation was performed. The variance propagation bases on the absolute single point precision presented in Tab. 1., which was 0.005 mm for the Kolibri flex system. The accuracy values still depend on the area and volume values itself. Therefore, only a relative precision value was calculated based on the real point cloud data for each single elevation. Tab. 3 shows the minimal, maximal and average (RMSE) relative precision.
Area Volume
Minimum 0.49 % 0.56 %
Maximum 5.82 % 6.04 %
RMSE 1.03 % 1.05 %
Table 3. Accuracy assessment of the computed goose bump area and goose bump volume
The accuracy assessment revealed that both parameters, area respectively volume can be derived with a relative accuracy of approximately 1∙σA : A = 1∙σV : V = 1 : 100.
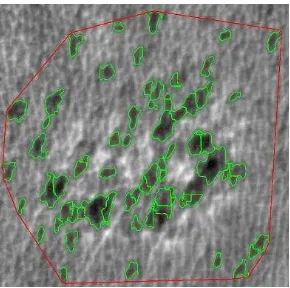
Figure 10. Visualisation of the results on the basis of a sample with very low structured goose bumps
Fig. 10 visualizes the results of another sample which shows in contrast to sample 1 (Fig. 6e) a very low structured goose bump area. However, a visual assessment exhibits that the method described in section 4 could be applied successfully in this case as well, although the reliability of the results might be lower here. The derived parameter values of sample 2 are shown in Tab. 4.
Parameter Sample 2
Number of goose bumps 73 Sum of base areas 44.82 mm²
Total volume of goose bumps 2.24 mm³
Area of stimulated region 254.82 mm²
Table 4. Relevant parameter values as result of an sample with very low structured goose bumps (compare Fig. 10)
6. CONCLUSIONS AND OUTLOOK
This paper describes and proves experimentally that by using photogrammetric techniques medicamentous induced goose bumps can be acquired in three dimensions and can be analysed almost fully automatically from the perspective of medical research questions. The relative accuracy was determined with 1% of the area resp. the volume of an individual goose bump (RMSE). A comparison between the previous two-dimensional method and the three-dimensional method described here resulted in deviations of the area values in the order of magnitude up to 10%. Of course, the volume parameters can only be determined with the three-dimensional method. A more detailed investigation of precision and reliability subject to a larger number of different silicone imprints and recorded with the different systems should be a key issue in future work. Particularly the accuracy has to be evaluated using a reference object with known geometry and known parameter values.
The silicone imprint might represent a significant error source. However, the imprint was essential for the previous two-dimensional method. In future studies it would be very interesting to forgo the silicone imprint and to implement a method which can be applied on the human skin directly.
ACKNOWLEDGEMENTS
The authors would like to thank Elka Frenz and Timo Siepmann from the University Hospital Carl Gustav Carus Dresden, Department of Neurology, for the motivation for the investigations described here and the constructive discussions and valuable remarks.
REFERENCES
BERGGOLD,W. &HÄUSLER, G.,2010. Optische 3D-Sensoren, Den passenden Sensor für die gestellte Messaufgabe in der optischen 3D-Messtechnik finden. Optik & Photonik, Issue 3, pp. 28-32.
CHEN,F.,BROWN,G.M.&SONG,M.,2000. Overview of three-dimensional shape measurements using optical methods. Optical Engineering, Issue 39, pp. 10-22.
FRITSCH, P., 2009. Dermatologie und Venerologie für das Studium. Heidelberg: Springer Medizin Verlag.
FORSYTH,D.A.&PONCE,J.,2012. Computer Vision - A modern approach. 2. Edition, Harlow: Pearson.
GEIßLER,P.&DIERIG,T.,1999. Depth-from-Focus. In: B. Jähne, H. Haußecker & P. Geißler, Eds. Handbook of Computer Vision and Applications - Volume 2 Signal Processing and Pattern Recognition. San Diego: Academic Press, pp. 592-623.
HANDELS, H., 2009. Medizinische Bildverarbeitung - Bildanalyse, Mustererkennung und Visualisierung für die computergestützte ärztliche Diagnostik und Therapie. 2. Edition, Wiesbaden: Vieweg + Teubner.
HORN, B. K. P., 1970. Shape from Shading: A Method for Obtaining the Shape of a Smooth Opaque Object from One View, Cambridge: MIT Press.
JIANG, X. & BUNKE, H., 1997. Dreidimensionales Computersehen - Gewinnung und Analyse von Tiefenbildern. Berlin: Springer-Verlag.
KOERFER, F. & SCHMITT, R., 2007. In-Prozess
Mikrostrukturprüfung. Eds. N. Bauer, Handbuch zur Industriellen Bildverarbeitung - Qualitätssicherung in der Praxis. Stuttgart: Fraunhofer IRB Verlag, pp. 182-186.
LAWS, K., 1980. Textured Image Segmentation. Ph.D. Dissertation, University of Southern California.
LOHMANN, G., 1998. Volumetric Image Analysis. Stuttgart: Wiley Teubner.
MOLL, I., JUNG, E.&AUGUSTIN, M.,2005. Dermatologie. 6. Edition. Stuttgart: Thieme.
SCHERER, S., 2007. Fokus-Variation zur optischen 3-D-Messung im Mikro- und Nanobereich. In: N. Bauer, Eds. Handbuch zur industriellen Bildverarbeitung - Qualitätssicherung in der Praxis. Stuttgart: Fraunhofer IRB Verlag, pp. 198-202.
SIEPMANN, T., GIBBONS, C.H., ILLIGENS, B.M. LAFO, J.A., BROWN, C.M., FREEMANN, R., 2012. Quantitative Pilomotor Axon Reflex Test - A Novel Test of Pilomotor function. Archives of Neurology, 69[11], S. 1488-1492.
SIEPMANN, T., ILLIGENS, B. M. & PENZLIN, A. I., 2013.
Autonome Nervenkrankheiten - Früherkennung und leitliniengerechte Behandlung. DMW - Deutsche Medizinische Wochenschrift, Issue 30, pp. 1529-1532.
VOSSELMANN,G.&MAAS,H.-G.,2010. Airborne and Terrestrial Laser Scanning. Dunbeath: Whittles Publishing.
WOODHAM,R.J.,1978. Photometric Stereo: A reflectance map
technique for determining surface orientation from image intensity. SPIE, Image Understanding Systems and Industrial Applications I, Issue 155, pp. 136-143.