LAND COVER CHANGE DETECTION USING SALIENCY AND WAVELET
TRANSFORMATION
Haopeng Zhanga, b,∗
, Zhiguo Jianga, b, Yan Chengc a
Image Processing Center, School of Astronautics, Beihang University, Beijing, 100191, China -(zhanghaopeng, jiangzg)@buaa.edu.cn
b
Beijing Key Laboratory of Digital Media, Beijing, 100191, China c
93707 PLA Troops, Zhangjiakou, Hebei, 075000, China - [email protected]
Commission VII, WG VII/5
KEY WORDS:Change detection, Saliency detection, Local entropy, Wavelet transformation
ABSTRACT:
How to obtain accurate difference map remains an open challenge in change detection. To tackle this problem, we propose a change detection method based on saliency detection and wavelet transformation. We do frequency-tuned saliency detection in initial difference image (IDI) obtained by logarithm ratio to get a salient difference image (SDI). Then, we calculate local entropy of SDI to obtain an entropic salient difference image (ESDI). The final difference image (FDI) is the wavelet fusion of IDI and ESDI, and Otsu thresholding is used to extract difference map from FDI. Experimental results validate the effectiveness and feasibility.
1. INTRODUCTION
Land cover change detection is to identify differences in the state of an object or phenomenon by observing it at different times (S-ingh, 1989). It is a fundamental problem in multi-temporal re-mote sensing image analysis and plays an important role in both civil and military applications, such as agricultural survey (Bruz-zone and Serpico, 1997), forest monitoring (Hame et al., 1998), natural disaster monitoring (Di Martino et al., 2007), urban change analysis (Ridd and Liu, 1998), military reconnaissance etc. Man-ual labelling can obtain accurate change annotation by observ-ing, comparobserv-ing, and analyzing two corresponding multi-temporal remote sensing images. However, such work is inefficient and time consuming, and cannot handle the explosive growth of re-cent remote sensing data. In the past decades, many automatic change detection methods have been studied, including image d-ifferencing, vegetation index differencing (Townshend and Jus-tice, 1995), change vector analysis (Bruzzone and Prieto, 2000), principal component analysis (Chang and Wang, 2006), low-rank representation (Cheng et al., 2014), etc. But the key issue that how to obtain accurate difference map remains an open challenge.
Recently, visual attention model has become a research hot-spot in the area of computer vision and pattern recognition. Such mod-el tries to simulate visual attention system of human by comput-ers, and detects salient regions in an image where human eyes fo-cus. For land cover change detection, the area of changed region is usually less than that of unchanged region, and the changed re-gion can be regarded as the salient area by visual attention mod-el. Some researchers (Li, 2009, Yu, 2013) introduced Itti visual attention model (Itti et al., 1998) to change detection. They com-puted difference map directly on the saliency map, and weakened the details of changed region.
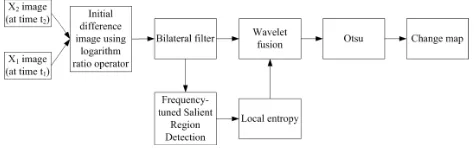
In this paper, we address the problem of detecting accurate dif-ference map using saliency model. As shown in Figure 1, firstly, we use the traditional logarithm ratio method to construct the ini-tial difference image (IDI). Secondly, we detect salient region in IDI using frequency-tuned saliency detection method, and get a
∗Corresponding author
salient difference image (SDI). Then, we calculate local entropy of SDI to an entropic salient difference image (ESDI). Finally, IDI and ESDI are fused by wavelet transformation to get final d-ifference image (FDI), and the dd-ifference map can be extracted from FDI by Otsu thresholding (Otsu, 1975). There may be noise in IDI obtained by logarithm ratio, and frequency-tuned salien-cy detection can suppress noise, enhance the change areas in IDI by the saliency and get SDI with the same spatial resolution as IDI. Moreover, dim change region and details of the edges can be kept in ESDI. Thus, when combining IDI with ESDI by wavelet transformation, we can effectively highlight the change region and simultaneously preserve the details. We performed quanti-tative experiments on two real multi-temporal datasets acquired by Landsat-7 and Landsat-5, and compared with the state-of-the-arts. Experimental results validate the effectiveness and feasibil-ity of the proposed method.
Figure 1: Framework of the proposed method
The rest of the paper is organized as following. In Section 2, we present the proposed change detection method in detail. Experi-mental results are given in Section 3. Finally, Section 4 comes to a conclusion.
2. METHOD
2.1 Initial Difference Image
times, the difference image by log-ratio method is as follows
We apply a bilateral filter toDLto reduce noise, and then obtain the initial difference image (IDI)DI.
2.2 Salient Difference Image
In the initial difference imageDI, the changing area usually takes small ratio of the whole image and with high intensity pixels, while the pixel values in the large unchanging area are close to zero. Thus the changing area can be detected as a salient region by a visual attention model. Following such observation, we in-troduce frequency-tuned salient region detection (Achanta et al., 2009) to simulate the perception of changing area by human vi-sion, in order to improve change detection result. This method was proposed by Achanta et al. in 2009. It can output full reso-lution saliency maps with well-defined boundaries of salient ob-jects by retaining substantially more frequency content from the original image.
Give a RGB imageI of sizeH×W, whereH andW are the height and width ofI, its saliency mapS can be calculated by frequency-tuned salient region detection method as the following steps.
Step 1 Apply Gaussian filter to original imageIto avoid noise, coding artifacts, and texture patterns. The resulting image after Gaussian filtering is
Ig(i, j) =I(i, j)⊗G (2)
where(i, j), i∈ {1,2,· · ·, H}, j∈ {1,2,· · ·, W}is the pixel coordinate,⊗stands for convolution operator, andGis a Gaus-sian filter in size of3×3in this paper.
Step 2 Transfer imageIgfrom RGB color space to Lab color space, and obtain the luminosity imageLand color imagesaand
b.
Step 3 Calculate the mean of imageL,a,brespectively as
uL=
Step 4 Calculate the square of Euclid distance between the mean of imageL,a,bto each pixel in them, i.e. the saliency maps of
Step 5 Final saliency map is the linear combination of the salien-cy maps ofL,a,bas
S(i, j) =SL(i, j) +Sa(i, j) +Sb(i, j) (9)
Notice that our initial difference imageDIhas only one channel, thus its saliency map, i.e. the salient difference imageDScan be regarded as the saliency map of the luminosity image according to the above method.
2.3 Local Entropy
Changing area in the initial difference imageDIcan be enhanced in the salient difference imageDS, but details of edges may be-come weak. Local entropy can represent the level of intensity variation in a local region of an image. Thus we compute local entropy ofDS to enhance the details inDI on the premise of retain the salient changing region inDS, and obtain an entropic salient difference image (ESDI)DE, of which the value at loca-tion(i, j)defined as the entropy value of the9×9neighborhood aroundDS(i, j)as
2.4 Image Fusion Using Wavelet Transformation
Wavelet transformation is a mathematical tool designed for mul-tiresolution signal decomposition (Mallat, 1989) and widely used for image fusion (Chao et al., 2004, Amolins et al., 2007, Hong and Zhang, 2008). In 2D case, let{V2
l , l∈ Z}be a multireso-lution analysis of the Hilbert space of functionsL2
(R2), where ZandRdenote the set of integers and real numbers respectively. For eachl ∈ Z, the scaling functions{Φl,m
1,m2|(m1, m2) ∈
Z2}are the orthonormal basis ofV2
l, and the wavelet functions
{Ψǫ
l can be represented by its projectionAlf(i, j)∈Vl2as applying on rows and columns respectively, then wavelet decom-position can be represented as
are high frequency coefficients. For a remote sensing imageX,
C0(X)isXitself. The wavelet reconstruction equation is
Cl=H
of the fused imageDFis
Cl+1,F = 0.75×Cl+1,I+ 0.25×Cl+1,E (16)
whereCl+1,I andCl+1,E are the low frequency coefficients of
DI andDErespectively, and the high frequency coefficients of
DF are
Dlǫ+1,F =D ǫ
l+1,E, ǫ= 1,2,3 (17) where{Dǫ
l+1,E, ǫ= 1,2,3}are the high frequency coefficients ofDE.
In this paper, we practically use Haar wavelet functions and 2-layer wavelet decomposition.
2.5 Difference Map
When we get a fused difference imageDF, Otsu thresholding (Ot-su, 1975) is used to obtain the final difference map.
3. EXPERIMENTS
3.1 Datasets
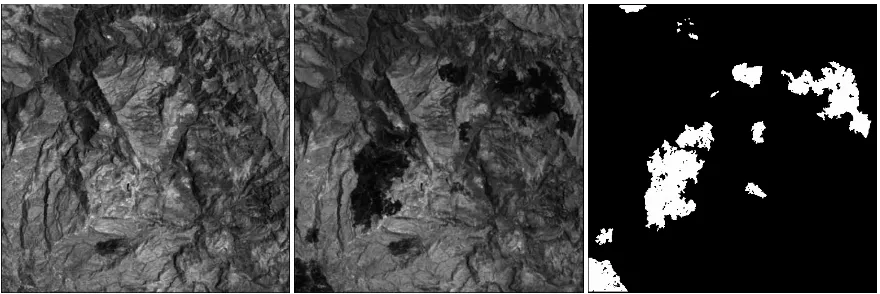
We performed experiments on two real remote sensing datset-s to evaluate our method. Mexico dataset(Ghosh et al., 2007) is made up of two multi-temporal images acquired by Landsat-7 satellite (channel 4) in an area of Mexico in April 2000 and May 2002, as shown in Figure 2. The two 8-bit images are of size 512×512, and contain 236545 unchanged pixels and 25599 changed pixels in each image. Sardinia dataset(Ghosh et al., 2007) is made up of two multi-temporal images acquired by Landsat-5 satellite (channel 4) in September 1995 and July 1996 in the area of Lake Mulargia on the Island of Sardinia (Italy), as shown in Figure 3. The image size is300×412, and there are 115974 unchanged pixels and 7626 changed pixels.
3.2 Results and Analysis
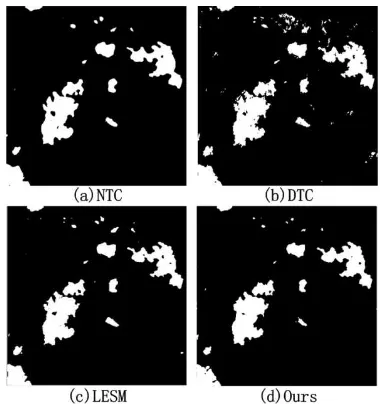
We compared our method with three state-of-the-art change de-tection methods, including nonsubsampled contourlet transfor-m (NCT) (Li et al., 2012), dual-tree cotransfor-mplex wavelet transfortransfor-m (DTC) (Celik and Ma, 2010), and local entropy saliency mod-el (LESM) (Yu, 2013). Qualitative visual comparison results are shown in Figure 4 and 5, while quantitative comparison results are collected in Table 1 and 2. We can see that results of NC-T (Li et al., 2012) contain many false alarm pixels or patches, and DTC (Celik and Ma, 2010) and LESM (Yu, 2013) lose the details of edges. However, our results contain completer chang-ing region with more details and less false alarm pixels. This validates the power of the fusion of entropic salient difference image. Our method achieves the best total change detection error on both datasets, showing its effectiveness.
4. CONCLUSION
In this paper, we have proposed a change detection method based on saliency detection and wavelet transformation. By using wavelet transformation, the initial difference image obtained by logarithm ratio is fused into the entropic salient difference image computed by frequency-tuned saliency detection and local entropy calcu-lation, in order to obtain the final difference image. Then Otsu thresholding is applied to get difference map. Experimental re-sults show that our method can detect accurate changing region with more details and less false alarms.
Figure 4: Visual comparison on Mexico dataset
Figure 5: Visual comparison on Sardinia dataset
ACKNOWLEDGEMENTS
This work was supported in part by the National Natural Sci-ence Foundation of China (Grant Nos. 61501009, 61371134 and 61071137), the Aerospace Science and Technology Innovation Fund of CASC, and the Fundamental Research Funds for the Central Universities.
REFERENCES
Achanta, R., Hemami, S., Estrada, F. and Susstrunk, S., 2009. Frequency-tuned salient region detection. In: Computer vision and pattern recognition, 2009. cvpr 2009. ieee conference on, IEEE, pp. 1597–1604.
Amolins, K., Zhang, Y. and Dare, P., 2007. Wavelet based im-age fusion techniques?an introduction, review and comparison. ISPRS Journal of Photogrammetry and Remote Sensing 62(4), pp. 249–263.
Bruzzone, L. and Prieto, D. F., 2000. Automatic analysis of the difference image for unsupervised change detection. Geoscience and Remote Sensing, IEEE Transactions on 38(3), pp. 1171– 1182.
(a) Image captured on April 2000 (b) Image captured on May 2002 (c) Groud truth of difference map
Figure 2: Mexico dataset
(a) Image captured on September 1995 (b) Image captured on July 1996 (c) Groud truth of difference map
Figure 3: Sardinia dataset
Table 1: Quantitative comparison on Mexico dataset
Methods False alarm (pixel) Missed alarm (pixel) Total error (pixel)
NTC (Li et al., 2012) 2842 1847 4671
DTC (Celik and Ma, 2010) 3698 834 4532
LESM (Yu, 2013) 2207 1692 3899
Ours 1611 2101 3712
Table 2: Quantitative comparison on Sardinia dataset
Methods False alarm (pixel) Missed alarm (pixel) Total error (pixel)
NTC (Li et al., 2012) 3005 583 3588
DTC (Celik and Ma, 2010) 3821 400 4221
LESM (Yu, 2013) 1005 1210 2215
Ours 1392 662 2054
Celik, T. and Ma, K.-K., 2010. Unsupervised change detection for satellite images using dual-tree complex wavelet transform. Geoscience and Remote Sensing, IEEE Transactions on 48(3), pp. 1199–1210.
Chang, C.-I. and Wang, S., 2006. Constrained band selection for hyperspectral imagery. Geoscience and Remote Sensing, IEEE Transactions on 44(6), pp. 1575–1585.
Chao, R., Zhang, K., Li, Y.-j. et al., 2004. An image fusion algo-rithm using wavelet transform. ACTA ELECTRONICA SINICA. 32(5), pp. 750–753.
Cheng, Y., Jiang, Z., Shi, J., Zhang, H. and Meng, G., 2014. Re-mote sensing image change detection based on low-rank repre-sentation. In: Advances in Image and Graphics Technologies, Springer, pp. 336–344.
Di Martino, G., Iodice, A., Riccio, D. and Ruello, G., 2007. A novel approach for disaster monitoring: fractal models and tools.
Geoscience and Remote Sensing, IEEE Transactions on 45(6), pp. 1559–1570.
Ghosh, S., Bruzzone, L., Patra, S., Bovolo, F. and Ghosh, A., 2007. A context-sensitive technique for unsupervised change de-tection based on hopfield-type neural networks. Geoscience and Remote Sensing, IEEE Transactions on 45(3), pp. 778–789.
Hame, T., Heiler, I. and San Miguel-Ayanz, J., 1998. An un-supervised change detection and recognition system for forestry. International journal of remote sensing 19(6), pp. 1079–1099.
Hong, G. and Zhang, Y., 2008. Comparison and improvement of wavelet-based image fusion. International Journal of Remote Sensing 29(3), pp. 673–691.
Itti, L., Koch, C. and Niebur, E., 1998. A model of saliency-based visual attention for rapid scene analysis. IEEE Transactions on Pattern Analysis & Machine Intelligence (11), pp. 1254–1259.
contourlet transform. Geoscience and Remote Sensing Letters, IEEE 9(5), pp. 836–840.
Li, Z., 2009. Research on visual attention models and applicaiton on imagery processing. PhD thesis, Shanghai Jiao Tong Univer-sity. Shanghai Jiao Tong UniverUniver-sity.
Mallat, S. G., 1989. A theory for multiresolution signal decompo-sition: the wavelet representation. Pattern Analysis and Machine Intelligence, IEEE Transactions on 11(7), pp. 674–693.
Otsu, N., 1975. A threshold selection method from gray-level histograms. Automatica 11(285-296), pp. 23–27.
Ridd, M. K. and Liu, J., 1998. A comparison of four algorithms for change detection in an urban environment. Remote sensing of environment 63(2), pp. 95–100.
Singh, A., 1989. Review article digital change detection tech-niques using remotely-sensed data. International journal of re-mote sensing 10(6), pp. 989–1003.
Townshend, J. and Justice, C., 1995. Spatial variability of images and the monitoring of changes in the normalized difference veg-etation index. International Journal of Remote Sensing 16(12), pp. 2187–2195.