MAPPING OF PLANETARY SURFACE AGE BASED ON CRATER STATISTICS
OBTAINED BY AN AUTOMATIC DETECTION ALGORITHM
Atheer L. Saliha, M. Mühlbauera, A. Grumpea, J. H. Pasckertb, C. Wöhlera, H. Hiesingerb
aImage Analysis Group, TU Dortmund, 44227 Dortmund, Germany – {atheer.altameemi | maximilian.muehlbauer | arne.grumpe |
christian.woehler}@tu-dortmund.de b
Institut für Planetologie, Westfälische Wilhelms-Universität Münster, 48149 Münster, Germany – {jhpasckert | hiesinger}@uni-muenster.de
Commission IV, WG IV/8
KEY WORDS: Crater statistics; CSFD; automatic crater detection; absolute model age; age mapping
ABSTRACT:
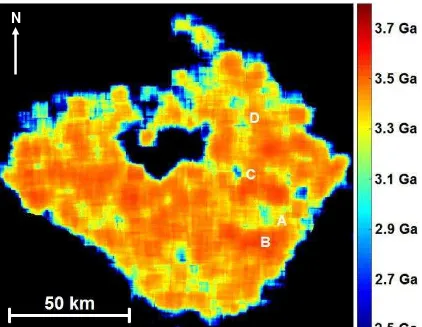
The analysis of the impact crater size-frequency distribution (CSFD) is a well-established approach to the determination of the age of planetary surfaces. Classically, estimation of the CSFD is achieved by manual crater counting and size determination in spacecraft images, which, however, becomes very time-consuming for large surface areas and/or high image resolution. With increasing availability of high-resolution (nearly) global image mosaics of planetary surfaces, a variety of automated methods for the detection of craters based on image data and/or topographic data have been developed. In this contribution a template-based crater detection algorithm is used which analyses image data acquired under known illumination conditions. Its results are used to establish the CSFD for the examined area, which is then used to estimate the absolute model age of the surface. The detection threshold of the automatic crater detection algorithm is calibrated based on a region with available manually determined CSFD such that the age inferred from the manual crater counts corresponds to the age inferred from the automatic crater detection results. With this detection threshold, the automatic crater detection algorithm can be applied to a much larger surface region around the calibration area. The proposed age estimation method is demonstrated for a Kaguya Terrain Camera image mosaic of 7.4 m per pixel resolution of the floor region of the lunar crater Tsiolkovsky, which consists of dark and flat mare basalt and has an area of nearly 10,000 km2. The region used for calibration, for which manual crater counts are available, has an area of 100 km2. In order to obtain a spatially resolved age map, CSFDs and surface ages are computed for overlapping quadratic regions of about 4.4 x 4.4 km² size offset by a step width of 74 m. Our constructed surface age map of the floor of Tsiolkovsky shows age values of typically 3.2-3.3 Ga, while for small regions lower (down to 2.9 Ga) and higher (up to 3.6 Ga) age values can be observed. It is known that CSFD-derived absolute model ages can exhibit variations although the surface has a constant age. However, for four 10-20 km sized regions in the eastern part of the crater floor our map shows age values differing by several hundred Ma from the typical age of the crater floor, where the same regions are also discernible in Clementine UV/VIS color ratio image data probably due to compositional variations, such that the age differences of these four regions may be real.
1. INTRODUCTION
Impact crater counting is one of the most important tools for estimating the geologic age of a planetary surface, i.e. the period of time that has passed since the last resurfacing event. Recent planetary spacecraft missions have provided enormous amounts of high-resolution image data of global coverage for various solar system bodies, allowing for the construction of crater catalogues comprising large numbers of small craters (Stepinski et al., 2012; Robbins, 2009, 2016).
Impacts of small bodies on planetary surfaces lead to the formation of craters (Hörz et al., 1991). Impact craters are especially abundant on Mercury, the Moon and Mars (Grieve et al., 2007), where they persist over long periods of time due to the lack of plate tectonics, an atmosphere, and life. For planetary bodies without an atmosphere, the areal impact crater density increases with increasing surface age, i.e. densely cratered surface parts are usually older than surface parts with a low abundance of craters. The impact crater size-frequency distribution (CSFD), denoting the diameter-dependent areal density of impact craters for a given surface part, allows for an estimation of the so-called absolute model age (AMA) of the surface (Hartmann, 1999; Hartmann and Neukum, 2001; Michael and Neukum, 2010; Michael et al., 2012; Michael, 2013, 2014, 2015; Hiesinger et al., 2011).
In this paper an automatic crater detection algorithm (CDA) is applied to the mare-like floor region of the lunar farside crater Tsiolkovsky, in order to obtain crater counts of similar accuracy as manual crater counts. A surface age map is created based on the automatically obtained crater counts, resulting in a spatially resolved map of the AMA of the examined surface area.
2. CRATER DETECTION ALGORITHMS
In the domain of planetary science, crater counts are typically performed by manual inspection of orbital images (e.g., Michael and Neukum, 2010). On the other hand, an important research topic in remote sensing is the development of crater detection algorithms (CDAs) which automatically determine the locations and sizes of craters in images (Salamanićcar and Lončarić, 2008, 2010). Numerous CDAs have been developed as a consequence of the high importance of knowledge about the impact crater distribution for remote geologic studies of planetary surfaces (Stepinski et al., 2012). However, many works about CDAs are limited to the demonstration of the accuracy of a particular algorithm on a small set of test images displaying quite simple and clearly pronounced craters, while meaningful studies in the field of planetary science require CDAs achieving a high performance also for less obvious, e.g., degraded, impact craters (Stepinski et al., 2012).
Since the start of the last decade, there was a further increase in research works regarding the automatic detection of craters (Salamunićcar and Lončarić, 2010). Existing CDAs can be divided into two different groups. CDAs of the first group detect craters in images, while CDAs of the second group detect craters based on digital elevation models (Salamunićcar and Lončarić, 2010; Di et al., 2014).
According to Stepinski et al. (2012), some image-based CDAs consist of techniques which process the image to detect the characteristic circular or elliptical shapes of crater rims, followed by a matching stage such as the Hough transform (Hart, 2009), while other CDAs employ machine learning approaches for crater detection. These systems are trained using image data sets labelled by human experts, and the detector performance is tested on new image data not used during the training stage (Stepinski et al., 2012, see also Chung et al., 2014). Examples for classifier architectures are boosting techniques allowing for a combination of various feature detectors (Wetzler et al., 2005; Salamunićcar and Lončarić, 2010; Di et al., 2014; Stepinski et al., 2012) and support vector machines (Wetzler et al., 2005; Chung et al., 2014).
In this work, the template matching based CDA introduced by Grumpe and Wöhler (2013) with the ability of automatic detection of small craters (<10 image pixels diameter) in lunar images will be used for crater detection. This template-based algorithm will be applied to orbital image data of the mare-like floor region of lunar crater Tsiolkovsky. The main step in the estimation of the absolute surface age is the statistical analysis of the CSFD constructed using the image-based CDA for determining the locations and diameter values for the derivation of the AMA. Accordingly, a spatially resolved AMA map of the whole floor of Tsiolkovsky will be constructed.
3. TEMPLATE-BASED AUTOMATIC CRATER DETECTION
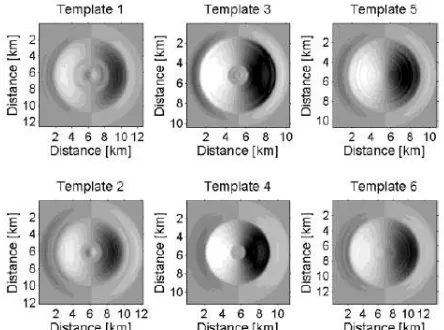
The algorithm by Grumpe and Wöhler (2013) used for the analyses in this paper is based on six generic 3D crater models. These six templates were created based on track data of the Lunar Orbiter Laser Altimeter (LOLA) instrument (Smith et al., 2010) of three craters of about 8 km diameter in the vicinity of lunar crater Plato, making use of the known illumination conditions and the known reflectance behavior of the lunar surface, which allow for generating artificial crater template images.
Artificially illuminating the 3D models using the Hapke model (Hapke, 1984, 2002) for the known illumination conditions then resulted in a set of six crater template images. Six of these templates are shown in Figure 2. All available templates were scaled to sizes between 5 and 200 image pixels in order to allow for the detection of craters across a broad range of diameters based on the normalized cross-correlation coefficient between the templates and the image parts being analyzed.
The template matching stage is followed by a fusion process that replaces multiple detections of the same crater at slightly different positions or with slightly different diameters by the average of these positions or diameters.
4. THE REGION OF INTEREST: TSIOLKOVSKY
The crater Tsiolkovsky (Figure 3) is one of a small number of lava-filled lunar farside craters, thus having a very dark and smooth crater floor. It is located at (20° S, 129° E) and has a diameter of approximately 200 km. The central peak located in the northern part of the mare-filled region has a “W” shape (Tyrie, 1988a).
Previous studies regarding Tsiolkovsky crater suggest ages around 3.8 Ga (Walker and El-Baz, 1982) and 3.5±0.1 Ga (Tyrie, 1988b) for the floor region. The image used in this work was a mosaic of images taken by the Terrain Camera (TC) of depends on the number of craters per diameter interval and per area, the CSFD. We chose a surface part of around 100 km2 size inside the crater Tsiolkovsky as a reference dataset for the crater detection, which has been evaluated manually by Pasckert et al. (2015). The crater diameter interval considered for estimating the AMA ranges from 128 m to 1000 m. Smaller craters were not taken into account because the detection rate of the CDA decreases with decreasing diameter for diameters less than about 100 m, leading to an artificial “roll-off” of the CSFD.
Like virtually all other object detection algorithms, our template matching based CDA relies on a threshold value which controls the sensitivity of the detector. We adjusted this threshold value such that for a given reference area with available manual crater counts, it yields an AMA that comes as close as possible to the manually determined AMA.
To validate this approach, the 100 km2 reference area has been divided into three parts of equal size, for each of which the absolute difference between CDA-based and manually determined AMA was minimized by a quasi-Newton method. The resulting threshold is then tested on the remaining two areas. The number of craters in each sub-area detected by the CDA and by manual counting, respectively, is summarized in Table 1. The derived CDA-based AMA values between 3.00 Ga and 3.44 Ga are always consistent with the manually determined AMA values (Table 2). obtained by Pasckert et al. (2015) based on manual counting.
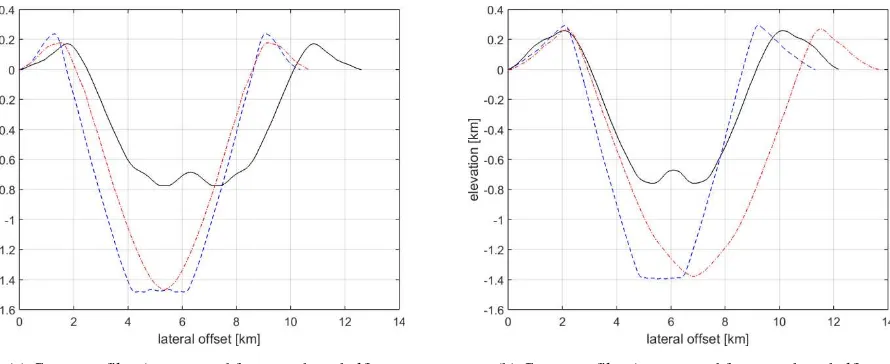
(a) Crater profiles (constructed from southern half) (b) Crater profiles (constructed from northern half)
Figure 1. Cross-sections of the crater models. The crater models were constructed from LOLA tracks that closely resemble sections of approximately 8 km diameter satellite craters of the lunar crater Plato. Each track was split at the centre of the cross-section, respectively, and the models were derived by rotating the resulting profiles around the centre of the corresponding satellite crater, respectively. (a) Model cross-sections derived from the southern half of the LOLA track. (b) Model cross-sections derived from the northern half of the LOLA track.
Tested on Trained on
Area 1 Area 2 Area 3 Manual Count
Optimal Threshold 0.6562 0.6562 0.6579 -
Area 1 231 craters 231 craters 229 craters 157 craters
Area 2 238 craters 238 craters 234 craters 145 craters
Area 3 244 craters 244 craters 238 craters 146 craters
Table 1. Results of the threshold adaptation: number of craters.
Tested on Trained on
Table 2.Results of the threshold adaptation: estimated AMA.
5. TSIOLKOVSKY AGE MAP
To create a spatially resolved AMA map, the template matching technique has been applied to the 7.4 m/pixel resolution Kaguya image data with a 600x600 pixel (4.4x4.4 km²) wide sliding window moving over the whole image of the crater Tsiolkovsky with a step width of 10 pixels (74 m). The CDA successfully identifies a high fraction of the manually determined craters and determines reasonable diameter values, as apparent from Figure 4 (a more detailed performance analysis of the CDA is currently in progress). Slight offsets by a few pixels between the CDA-based and manual crater positions tend to occur, which do not affect the AMA estimation as it only depends on the estimated diameters and areal density of the craters.
Based on the optimal threshold value of 0.6568, CSFDs were computed for overlapping quadratic sub-regions covering the whole mare-like crater floor in order to estimate an AMA value
for each sub-region, leading to a spatially resolved AMA map walls and the parts of the crater floor not covered by mare basalt were excluded. According to stratigraphic considerations, the age of these steeply sloped regions exceeds that of the dark mare floor.
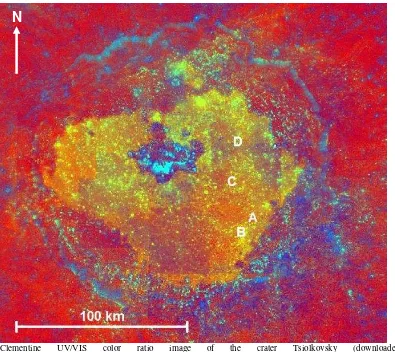
The color ratio map of the crater Tsiolkovsky (Figure 6) was derived from Clementine UV/VIS multispectral data (red channel: 750 nm/415 nm reflectance; green channel: 750 nm/950 nm reflectance; blue channel: 415 nm/750 nm reflectance, according to Pieters et al. (1994) and http://www. mapaplanet.org/explorer/help/data_set.html#moon_clementine_ ratio). It can be used to identify compositionally distinct
geological units on the mare-like crater floor. If the mapping of the CDA-derived AMA yields reliable results, similar units should be found within the age map. Although frame-specific calibration artefacts make it hard to unambiguously divide the color ratio image into geological units, some similarities between structures visible in Figures 5 and 6 are clearly apparent through visual comparison. Specifically, four localized AMA anomalies can be found in the eastern part of the crater Figure 6, these small regions can all be distinguished spectrally from the surrounding surface, indicating compositional variations of the mare basalt.
Figure 2. Basic crater templates. Templates 1 and 2: craters with a small central mound. Templates 3 and 4: craters with flat floor. Templates 5 and 6: simple bowl-shaped craters (Grumpe and Wöhler, 2013).
Van der Bogert et al. (2015) showed for a cratered surface area of 100 km² for which the CSFD has been synthetically generated under the assumption of a uniform AMA of 4.0 Ga that estimates of the AMA for sub-regions of 4 km² size deviate by several hundred Ma from the true AMA, while accurate and reliable estimated AMA values are obtained for 10 km² sub-regions. Given the comparably large size of about 20 km² of the overlapping sub-regions analyzed in this work, the AMA fluctuations apparent in Figure 5 are likely to be real, which is confirmed by their correlation with spectral variations in the Clementine color ratio image.
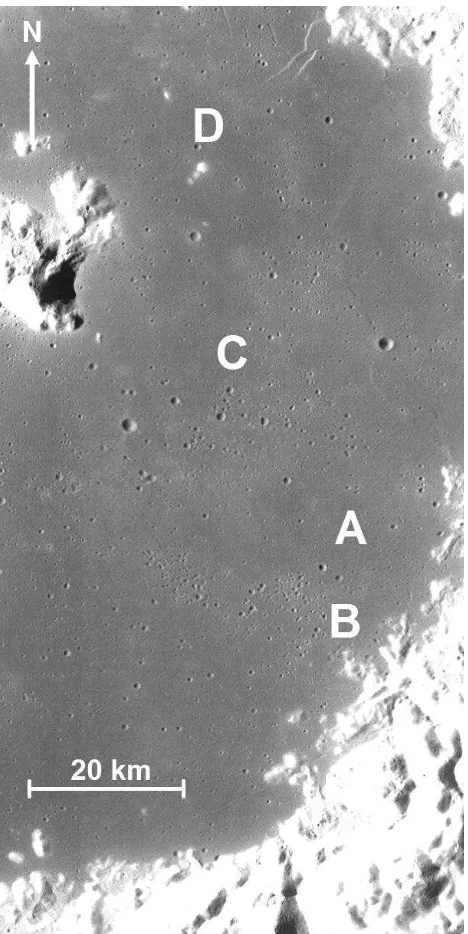
A more detailed view of the eastern and southeastern part of the crater Tsiolkovsky is shown in Figure 7. It reveals that the two small low-AMA anomalies marked in Figures 5 and 6 by the letter D are located at the same locations as two bright details in Figure 3, corresponding to small mountains of the original crater floor that penetrate through the dark mare basalt layer. Hence, the lower estimated AMA is probably due to small craters being destroyed more easily on the steep slopes on the flanks of these mountains. The low-AMA anomalies marked by the letters A and C cannot be identified with any conspicuous surface details but correspond to dark surface parts with a visually apparent low abundance of small impact craters. In contrast, the high-AMA anomaly marked by the letter B corresponds to an area of slightly increased albedo characterized by a visually apparent exceptionally high abundance of small
craters. The distribution of these craters as a cluster, however, suggests that they are secondary craters (McEwen and Bierhaus, 2006). The seemingly increased AMA of region B is thus probably not due to the real surface age but to the presence of these secondary craters (a detailed analysis of the effect of secondary craters on the estimated surface age is provided by McEwen and Bierhaus, 2006).
Hence, the AMA anomalies B and D are not due to lava flows having an age differing from the mean age of the crater floor. The negative AMA anomalies A and C might be interpreted as lava flows of a composition and age different from most of the crater floor area, which would imply the occurrence of small eruptions on the floor of Tsiolkovsky several hundred Ma after the emplacement of the majority of the mare basalts. An alternative interpretation for regions A and C is that the distribution of small craters on the floor of Tsiolkovsky may be affected in a spatially variable manner by secondary craters, which would then cause the observed AMA variations across the crater floor.
6. SUMMARY AND CONCLUSION
In this work, an image template matching based CDA has been applied to a Kaguya spacecraft image of the mare-like floor of the lunar crater Tsiolkovsky. The AMA of the surface has been estimated based on the CSFD inferred from the detection results of the CDA. The detection threshold was calibrated based on manual crater counts performed for a small sub-region of the crater floor. The average AMA of the crater floor is consistent with previous surface age estimates.
A spatially resolved map of the AMA has been constructed by applying the CDA to overlapping sub-regions of the crater floor. Correlations between structures in the AMA map and local variations of spectral properties in Clementine UV/VIS color ratio data could be established. Two small local negative anomalies in the AMA map could be identified with highland-like remnants of the original crater floor penetrating the mare fill, while one positive anomaly is probably due to the presence of a cluster of secondary craters. Two other local negative AMA anomalies may correspond to lava flows of different age and composition than most of the crater floor, but they may likewise be due to the spatially varying influence of secondary craters on the CSFD of the small craters on the floor of Tsiolkovsky.
Independent of these interpretations, the proposed surface age estimation and mapping technique allows for a distinction between different geological units in terms of their AMAs. It accurately known. Regarding the CDA, the choice of a constant detection threshold for all crater sizes as suggested in this work is the simplest possible one. Hence, since we found the sensitivity of the proposed CDA to be higher for larger than for smaller craters, we expect that an improvement of the detection results will be achieved by defining a diameter-dependent detection threshold in future extensions of the CDA. Furthermore, it will be important to extend the CDA such that it is able to distinguish secondary from primary craters based on their shape and/or spatial distribution in order to suppress the influence of secondary craters on the AMA estimation.
Figure 3. Tsiolkovsky Crater image, extracted from the Lunar Reconaissance Orbiter Wide Angle Camera global mosaic (Speyerer et al., 2011).
Figure 4. Part of the calibration area. Manually counted craters are indicated by green circles, CDA detection results by red circles. Image data: Kaguya TC (Haruyama et al., 2014).
Figure 5. AMA map of the floor of the crater Tsiolkovsky. The mare-like floor region has been extracted manually. Black: no data.
N
N
N
Figure 6. Clementine UV/VIS color ratio image of the crater Tsiolkovsky (downloaded from http://www.mapaplanet.org/explorer/moon.html, definition of color channels according to Pieters et al., 1994).
N
Figure 7. Detailed view of the eastern and southeastern part of Tsiolkovsky. The regions A-D marked in Figures 5 and 6 are indicated. Contrast-enhanced excerpt from the global LROC WAC mosaic (Speyerer et al., 2011).
REFERENCES
Chung, C. P., Chung, C. O., Yam, C. H., 2014. Lunar Crater Identification from Machine Learning Perspective. Acta Futura 9, 41-47.
Di, K., Li, W., Yue, Z., Sun, Y., Liu, Y., 2014. A machine learning approach to crater detection from topographic data. Advances in Space Research 54, 2419–2429.
Grieve, R. A. F., Cintala, M. J., Tagle, R., 2007. Planetary Impacts. In: McFadden, L.-A., Weissmann, P. R., Johnson, T. V. (eds.), Encyclopedia of the Solar System, 2nd edition, Academic Press, pp. 813-828.
Grumpe, A. and Wöhler, C., 2013. Generative Template-based Approach to the Automated Detection of Small Craters. European Planetary Science Congress, vol. 8, abstract #EPSC2013-685-1.
Hapke, B., 1984. Bidirectional reflectance spectroscopy: 3. Correction for macroscopic roughness. Icarus 59(1), 41-59.
Hapke, B., 2002. Bidirectional reflectance spectroscopy: 5. The coherent backscatter opposition effect and anisotropic scattering. Icarus 157(2), 523-534.
Hart, P. E., 2009. How the Hough Transform Was Invented. IEEE Signal Processing Magazine 26(6), 18-22.
Hartmann, W. K., 1999. Martian cratering VI. Crater count isochrons and evidence for recent volcanism from Mars Global Surveyor. Meteoritics and Planetary Science34, 167-177.
Hartmann, W. K. and Neukum, G., 2001. Cratering chronology and the evolution of Mars. In Chronology and evolution of Mars (pp. 165-194). Springer Netherlands.
Haruyama, J., Ohtake, M., Matsunaga, T., Otake, H., Ishihara, Y., Masuda, K., Yokota, Y., Yamamoto, S., 2014. Data products of SELENE (Kaguya) Terrain Camera for Future Lunar Missions. LPSC XXXXV, abstract #1304.
Hiesinger, H., van der Bogert, C., Reiss, D., Robinson, M. S., 2011. Crater size-frequency distribution measurements of Mare Crisium. LPSC XXXXII, abstract #2179.
Hörz, F., Griese, R., Heiken, G., Spudis, P., Binder, A., 1991. Lunar Surface Processes. In: Heiken, G. H., Vaniman, D. T., French, B. M., Lunar Sourcebook, pp. 61-120.
McEwen, A. S., Bierhaus, E. B., 2006. The Importance of Secondary Cratering to Age Constraints on Planetary Surfaces. Annu. Rev. Earth Planet. Sci. 34, 535-567.
Michael, G. G., 2013. Planetary surface dating from crater size– frequency distribution measurements: Multiple resurfacing episodes and differential isochron fitting. Icarus 226(1), 885-890.
Michael, G. G., 2015. Personal communication.
Michael, G. G. and Neukum, G., 2010. Planetary surface dating from crater size–frequency distribution measurements: Partial resurfacing events and statistical age uncertainty. Earth and Planetary Science Letters 294(3), 223-229.
Michael, G. G., Platz, T., Kneissl, T., Schmedemann, N., 2012. Planetary surface dating from crater size–frequency distribution measurements: Spatial randomness and clustering. Icarus 218(1), 169-177.
Pasckert, J. H., Hiesinger, H., van der Bogert, C. H., 2015. Small-scale lunar farside volcanism. Icarus 257, 336-354.
Pieters, C. M., Staid, M. I., Fischer, E. M., Tompkins, S., He, G., 1994. A Sharper View of Impact Craters from Clementine Data. Science 266, 1844-1848.
Plesko, C., Brumby, S., Asphaug, E., Chamberlain, D., Engel, T., 2004. Automatic crater counts on Mars. LPSC XXXV, abstract #1935.
N
Robbins, S., 2009. Mars Crater Catalog. http://astrogeology. usgs.gov/search/map/Mars/Research/Craters/RobbinsCraterData base_20120821
Robbins, S., 2016. Developing a global lunar crater database, complete for craters for craters ≥1 km. LPSC XXXXVII, abstract #1525.
Salamunićcar, G. and Lončarić, S., 2008. GT-57633 catalogue of Martian impact craters developed for evaluation of crater detection algorithms. Planetary and Space Science 56(15), 1992-2008.
Salamunićcar, G. and Lončarić, S., 2010. Method for crater detection from Martian digital topography data using gradient value/orientation, morphometry, vote analysis, slip tuning, and calibration. IEEE Transactions on Geoscience and Remote Sensing 48(5), 2317-2329.
Smith, D. E., Zuber, M. T., Neumann, G. A., Lemoine, F. G., Mazarico, E., Torrence, M. H., McGarry, J. F., Rowlands, D. D., Head, J. W., Duxbury, T. H., Aharonson, O., Lucey, P. G., Robinson, M. S., Barnouin, O. S., Cavanaugh, J. F., Sun, X., Liiva, P., Mao, D., Smith, J. C., Bartels, A. E., 2010. Initial observations from the Lunar Orbiter Laser Altimeter (LOLA). Geophysical Research Letters 37(18), doi:10.1029/2010GL 043751.
Speyerer, E. J., Robinson, M. S., Denevi, B. W., 2011. Lunar Reconnaissance Orbiter camera global morphological map of the Moon. Lunar and Planetary Science Conference XXXXII, abstract #2387. Data download from http://wms.lroc.asu.edu/ lroc/view_rdr/WAC_GLOBAL
Stepinski, T. F., Ding, W., Vilalta, R., 2012. Detecting impact craters in planetary images using machine learning. Intelligent Data Analysis for Real-Life Applications: Theory and Practice. IGI Global, Hershey, PA, 146-159.
Tyrie, A., 1988a. A description of the crater Tsiolkovsky on the lunar far side. Earth, Moon, and Planets 42, 265-275.
Tyrie, A., 1988b. Age dating of mare in the lunar crater Tsiolkovsky by crater-counting method. Earth, Moon, and Planets 42, 245-264.
Van der Bogert, C. H., Michael, G., Kneissl, T., Hiesinger, H., Pasckert, J. H., 2015. Development of Guidelines for Recommended Lunar CSFD Count Area Sizes via Analysis of Random CSFDs. Proc. Workshop on Issues in Crater Studies and the Dating of Planetary Surfaces, LPI Contributions 1841, abstract #9023.
Walker, A. S., El-Baz, F., 1982. Analysis of Crater Distributions in Mare Units on the Lunar Far Side. The Moon and the Planets 27, 91-106.
Wetzler, P. G., Honda, R., Enke, B., Merline, W. J., Chapman, C. R., Burl, M. C., 2005. Learning to detect small impact craters. Proc. Seventh IEEE Workshops on Application of Computer Vision, vol. 1, pp. 178-184.