MODEL ACCURACY COMPARISON FOR HIGH RESOLUTION INSAR COHERENCE
STATISTICS OVER URBAN AREAS
Yue Zhang a b c *, Kun Fu b c, Xian Sun b c, Guangluan Xu b c, Hongqi Wang b c
a
University of Chinese Academy of Sciences, Beijing, China - [email protected]
b
Institute of Electronic, Chinese Academy of Sciences, Beijing, China – (sunxian,gluanxu)@mail.ie.ac.cn
c
Key Laboratory of Spatial Information Processing and Application System Technology, Chinese Academy of Sciences, Beijing, China - [email protected], [email protected]
Commission VII, WG VII/7
KEY WORDS: Interferometric Synthetic Aperture Radar (InSAR), Coherence Statistics, Model Accuracy, Urban Areas
ABSTRACT:
The interferometric coherence map derived from the cross-correlation of two complex registered synthetic aperture radar (SAR) images is the reflection of imaged targets. In many applications, it can act as an independent information source, or give additional information complementary to the intensity image. Specially, the statistical properties of the coherence are of great importance in land cover classification, segmentation and change detection. However, compared to the amount of work on the statistical characters of SAR intensity, there are quite fewer researches on interferometric SAR (InSAR) coherence statistics. And to our knowledge, all of the existing work that focuses on InSAR coherence statistics, models the coherence with Gaussian distribution with no discrimination on data resolutions or scene types. But the properties of coherence may be different for different data resolutions and scene types. In this paper, we investigate on the coherence statistics for high resolution data over urban areas, by making a comparison of the accuracy of several typical statistical models. Four typical land classes including buildings, trees, shadow and roads are selected as the representatives of urban areas. Firstly, several regions are selected from the coherence map manually and labelled with their corresponding classes respectively. Then we try to model the statistics of the pixel coherence for each type of region, with different models including Gaussian, Rayleigh, Weibull, Beta and Nakagami. Finally, we evaluate the model accuracy for each type of region. The experiments on TanDEM-X data show that the Beta model has a better performance than other distributions.
* Corresponding author
1. INTRODUCTION
Due to its independence on the solar illumination and all weather capability, synthetic aperture radar (SAR) has become a key remote sensing technique in the last decades. In the context of SAR data analysis, an important issue is the development of accurate models for the statistics of the data (Gabriele, 2006). There is a lot of work on the statistics of SAR intensity data and many different statistical models are proposed in the literature. For example, Beta distribution is adopted to model the probability density function (pdf) of SAR intensity in (A. Lopès, 1990), the accuracy of Weibull distribution for modelling the intensity pdf is explored in (Menon, 1963; C. Oliver, 1993) and it is found that the Weibull distribution is dedicated only to low heterogeneities. In (Tison, 2004), the Fisher distribution is proposed and it is proved to be a very good model to represent high resolution SAR intensity.
The interferometric coherence map derived from the cross-correlation of two complex registered synthetic aperture radar (SAR) images is the output of interferometric SAR (InSAR) processing, and it can reflect the characters of the targets within the image. And the coherence can act as an independent information source, or give additional information complementary to the intensity image in many applications. Specially, the statistical properties of the coherence are of great importance in land cover classification, segmentation and change detection. However, compared to the much work on the statistical characters of SAR intensity, less attention has been paid to InSAR coherence statistics. And to our knowledge, all of
the existing model-based work that focuses on the InSAR coherence statistics models the coherence with Gaussian distribution for data in all resolutions and of all types of scenes. For example, (Abdelfattah, 2010) proposes a segmentation procedure of the InSAR coherence map in 10m resolution based on a Gaussian mixture model of the coherence histogram. (Abdelfattah, 2006) presents an application of the InSAR coherence in 10m resolution for land use classification. The proposed method is based on the InSAR coherence analysis, and the pdf of the coherence is modelled with Gaussian distribution. The experiments in (Abdelfattah, 2006) show that the Gaussian model hypothesis is not satisfactory in the case of urban area. Recently, (Zhang, Y et al, 2015) utilizes the coherence statistical properties in the reconstruction of buildings from high resolution InSAR data. They estimate the pdf of coherence through a kernel based non-model technique. But the non-model technique is very time consuming and sensitive to noise.
Nowadays more and more SAR systems are able to work in InSAR mode (such as TanDEM-X) and provide us with high resolution InSAR data. Therefore, it is very important to make a further research on the statistical characterisation of InSAR coherence.
In this paper, we make an investigation on the coherence statistics for high resolution data over urban areas and evaluate the accuracy of several typical statistical models. Four typical land classes including buildings, trees, shadow and roads are selected as the representatives of urban areas. At the beginning, we select several regions from the coherence map manually and
The International Archives of the Photogrammetry, Remote Sensing and Spatial Information Sciences, Volume XLI-B7, 2016 XXIII ISPRS Congress, 12–19 July 2016, Prague, Czech Republic
This contribution has been peer-reviewed.
label them respectively. Then we try to model the statistics of the pixel coherence for each type of region, with several models including Gaussian, Rayleigh, Weibull, Beta and Nakagami. These models are often used in the literature when modelling the statistics of the SAR intensity. Finally, in the measurement of the model accuracy for each type of region, the Kullback-Leibler divergence (also known as Mutual Information) (Kullback and Leibler, 1951; Cover and Thomas, 1991) between the model-based pdf and the empirical pdf is calculated and analysed. The experiments on TanDEM-X data show that the Beta model has a better performance than other distributions.
2. METHODOLOGY
To illustrate our work clearly, in this section, firstly we present that how the coherence map is generated, then we introduce the statistical models that we make comparison with in this paper. After that, we explain how we measure the accuracy of each model.
2.1 Coherence Generation
The coherence map is generated according to (Abdelfattah, 2005). The estimation of coherence magnitude is made by spatially averaging the amplitude as well as the phase of the M pixel values from the complex map. The estimated coherence is calculated by: among the considered the M coherence samples. The magnitude of the estimated coherence is γc
2.2 Statistical Models
2.2.1 Gaussian Model:The Gaussian distribution is an
important continuous probability distribution. It is often used in the natural and social sciences when the distributions for the random variables are not known. The pdf of the Gaussian distribution is displayed in Equation 2. Here ,µis the mean of
the distribution, and the parameter σis the standard deviation (Abdelfattah, 2006; Muller, 2002).
(
)
22.2.2 Beta Model:The Beta distribution is the family of
distributions defined on the interval [0,1]. The pdf of it is displayed in Equation 3. The parameters αand βare shape parameters (A. Lopès, 1990).
1 1
2.2.3 Weibull Model:The Weibull distribution is a
continuous distribution. The pdf of it is displayed in Equation 4 (C. Oliver, 1993). Here, the parameter λis the scale parameter, and the parameter k is the shape parameter.
1
2.2.4 Rayleigh Model:The Rayleigh distribution is a
continuous distribution for positive-valued random variables. The pdf of it is displayed in Equation 5 (Oliver, C et al, 2004).
σis the scale parameter.
2
2.2.5 Nakagami Model:The pdf of Nakagami distribution
is displayed in Equation 6 (J.-M. Nicolas, 2002).µ is the shape parameter and L is the spread parameter.
2
2.3 Measurements of Model Accuracy
In this paper, we investigate on the coherence statistics of four different land classes in urban areas, including buildings, shadow, trees and roads. The model accuracy is measured by the similarity between the model-based pdf and the empirical pdf of each class. And the similarity between the model-based pdf and the empirical pdf of each class is represented by the Kullback-Leibler divergence (Kullback et al, 1951; Cover, T.M. and Thomas, J.A, 1991) between the pdfs of them. The Kullback-Leibler divergence is a measure of the difference of two probability distributions.
Here, the accuracy of each model is measured by the symmetrical form of Kullback-Leibler divergence, as demonstrated in Equation 7.
1 '
In our notations, P represents the model-based pdf of each class, while P represents the empirical pdf for the same class. '
3. EXPERIMENTS AND RESULTS
In this section, we select four different classes of land in the high resolution InSAR coherence map. And we utilize five different statistical distributions to model the statistical properties of each class. By comparing the fitness between the models and the statistical properties of each class, we evaluate the performance of each model over urban areas.
3.1 Data Description
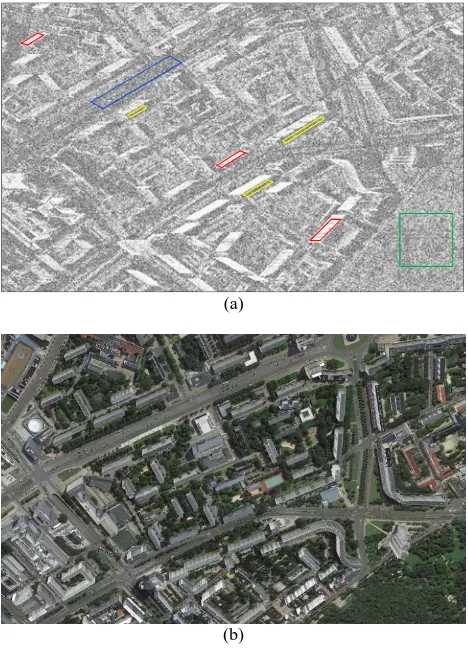
An interferometric image pair of TanDEM-X taken with X-band and covering a part of Berlin is used for the experiments. This HR SpotLight data, recorded from ascending orbit at begin of January 2012, show a pixel spacing of 0.45 m in slant range and 0.86 m in azimuth range. The effective baseline is approximately 107 m and the off-nadir look angle is approximately 42°. The data is visualized in Fig. 1.
We label out four different backscattering classes manually, and the sizes of the selected samples for each class are all in the range of 30,000 to 150,000. Some of labelled regions are
The International Archives of the Photogrammetry, Remote Sensing and Spatial Information Sciences, Volume XLI-B7, 2016 XXIII ISPRS Congress, 12–19 July 2016, Prague, Czech Republic
This contribution has been peer-reviewed.
(a)
(b)
Figure 1. The coverage of the data. (a) The coherence image of the data. (b) The corresponding area in Google Earth. For comparing convenience, symmetry along the vertical direction
is utilized.
illustrated in Fig.1(a). The regions in the red polygon are the buildings. The regions within the yellow polygon are the shadow. The roads are labelled with blues curves, and the trees are labelled with green polygons.
3.2 Model Accuracy Comparison
To evaluate the precisions of different models for coherence statistics, we calculate the empirical pdf of each type of region, based on the areas we label (as shown in Fig 1(a)). After that, we calculate the model-base pdf of each type of region based on the labelled data via maximum likelihood estimation. Then the Kullback-Leibler divergence between the empirical pdf and the model-based pdf is calculated for the same class.
Fig.2 demonstrates the performances of different statistical models for buildings. The black bins represent the empirical pdf for buildings. As we can see in this figure, the difference between the Beta distribution and the empirical pdf is the smallest. That means the Beta distribution has a better ability to model the coherence statistics for buildings than the others. And the often used Gaussian model performs much worse.
Fig.3 demonstrates the performances of different statistical models for roads. The black bins represent the empirical pdf for roads. As shown in this figure, the Beta distribution reveals the best performance among the five selected models. The performances of Gaussian model and Weibull model are quite similar; both are not as good as the Beta model.
0 0.1 0.2 0.3 0.4 0.5 0.6 0.7 0.8 0.9 1 0
5 10 15 20 25 30
Coherence
Pd
f
Building Histogram Beta Distribution Rayleigh Distribution Gaussian Distribution Weibull Distribution Nakagami Distribution
Figure 2. The performances of different statistical models for buildings.
0 0.1 0.2 0.3 0.4 0.5 0.6 0.7 0.8 0.9 1 0
0.2 0.4 0.6 0.8 1 1.2 1.4 1.6 1.8
Coherence
Pd
f
Road Histogram Beta Distribution Rayleigh Distribution Gaussian Distribution Weibull Distribution Nakagami Distribution
Figure 3. The performances of different statistical models for roads.
0 0.1 0.2 0.3 0.4 0.5 0.6 0.7 0.8 0.9 1 0
0.5 1 1.5 2
Coherence
Pd
f
Trees Histogram Beta Distribution Rayleigh Distribution Gaussian Distribution Weibull Distribution Nakagami Distribution
Figure 4. The performances of different statistical models for trees.
Fig.4 demonstrates the performances of different statistical models for trees. The black bins represent the empirical pdf for trees. As shown in this figure, the Beta distribution also reveals the best performance among the five selected models. The performance of Gaussian model is not as good as the Beta model.
The International Archives of the Photogrammetry, Remote Sensing and Spatial Information Sciences, Volume XLI-B7, 2016 XXIII ISPRS Congress, 12–19 July 2016, Prague, Czech Republic
This contribution has been peer-reviewed.
0 0.1 0.2 0.3 0.4 0.5 0.6 0.7 0.8 0.9 1 0
0.2 0.4 0.6 0.8 1 1.2 1.4 1.6 1.8 2
Coherence
Pd
f
Shadow Histogram Beta Distribution Rayleigh Distribution Gaussian Distribution Weibull Distribution Nakagami Distribution
Figure 5. The performances of different statistical models for shadow.
Fig.5 demonstrates the performances of different statistical models for shadow. The black bins represent the empirical pdf for shadow. As it is shown in this figure, the Beta distribution also reveals the best performance among the five selected models. The performance of Gaussian model is not as good as the Beta model.
Besides the visual comparisons in Fig.2-Fig.5, we also make a comparison on the accuracy of the five selected models quantitatively in Table 1. The table shows the Kullback-Leibler divergences for all models. As we can see that for all the four type of regions, the Kullback-Leibler divergences for Beta model are the smallest. That means the Beta model reveals the best performance. And clearly the Beta model is a better model for the urban areas than the Gaussian model.
Gaussian Beta Weibull Rayleigh Nakagami Building 178.11 18.62 161.82 310.56 205.72 Trees 30.45 6.97 33.98 76.04 45.34 Road 16.00 1.55 20.06 42.60 26.41 Shadow 28.67 0.18 33.13 62.33 41.37
Table 1. The Kullback-Leibler divergence for each model and each land class
4. CONCLUSION
In this paper, we make an investigation on the high resolution InSAR coherence statistics over the urban areas. For the evaluation of model accuracy on urban areas, we choose four typical land classes including buildings, trees, shadow and roads. At the beginning, several regions are labelled from the coherence map manually. Then we try to model the statistics of the pixel coherence for each type of region, with several models including Gaussian, Rayleigh, Weibull, Beta and Nakagami. After that, we evaluate on the model accuracy for each type of region with Kullback-Leibler divergence. The experiments on TanDEM-X data show that the Beta model has a better performance than other distributions.
In our future work, we will utilize the selected Beta model in the coherence segmentation and classification applications and check the improvements in performances. And more statistical models such as inverse Gaussian distribution and Fisher Distribution will be investigated for the high resolution InSAR coherence statistics over the urban areas.
ACKNOWLEDGEMENTS
This work was supported by the National Natural Science Foundation of China under Grant No.41501485.
REFERENCES
A. Lopès, H. Laur, and E. Nezry, 1990. Statistical distribution and texturein multilook and complex SAR images, in Proc. IGARSS, pp.20-24.
Abdelfattah, R., & Nicolas, J. M. ,2006. Interferometric Synthetic Aperture Radar Coherence Histogram Analysis for Land Cover Classification. Information and Communication Technologies, 2006. ICTTA '06. 2nd, pp.343 - 348.
Abdelfattah, R., & Nicolas, J. M. ,2005. Coherence estimation from complex coherence map using second kind statistics. Image Processing, 2005. ICIP 2005. IEEE International Conference on, pp. 29-32.
Abdelfattah, R., & Nicolas, J. M. ,2010. Mixture model for the segmentation of the insar coherence map. International Journal of Applied Earth Observation and Geoinformation, 12(1), pp.4479-4482.
C. Oliver, 1993, Optimum texture estimators for SAR clutter, J. Phys. D.:Appl. Phys., vol. 26, 1824–1835.
Cover, T.M., Thomas, J.A., 1991. Elements of Information Theory. John Wiley & Sons, Inc., ISBN 0.471-06259-6.
Gabriele, M., Josiane, Z., & Serpico, S. B,2006. SAR amplitude probability density function estimation based on a generalized gaussian model. IEEE Transactions on Image Processing, 15(6),pp. 1429-1442.
J.-M. Nicolas, 2002. Introduction Aux Statistiques de DeuxièmeEspèce: Application Aux Lois d’Images RSO. École Nat. Supérieure des Télécommunications, Paris, France. Tech. Rep. ENST2002D001.
Kullback, S., Leibler, R. A. ,1951. On information and sufficiency. The Annals of Mathematical Statistics, vol. 22,pp. 79-86.
Menon, M. V., 1963. Estimation of the shape and scale parameters of the Weibull distribution. Technometrics, 5(2), pp.175-182.
Muller, H. R., Horn, R., & Moreira, A., 2002. From Gaussian to inverse Gaussian statistics in SAR imagery. in Proc. IGARSS, Vol.4, pp.2486 - 2488).
Oliver, C. J., & Quegan, S., 1998. Understanding synthetic aperture radar images. Artech House
Tison, C., Nicolas, J.M., Tupin, F., Maitre, H., 2004. A new statistical model for Markovian classification of urban areas in high-resolution SAR images. IEEE Trans. Geosci. Remote Sens. 42 (10), pp. 2046–2057.
Zhang, Y., Sun, X., Thiele, A., & Hinz, S., 2015. Stochastic geometrical model and monte carlo optimization methods for building reconstruction from insar data. ISPRS Journal of Photogrammetry & Remote Sensing, 108, pp.49–61.
The International Archives of the Photogrammetry, Remote Sensing and Spatial Information Sciences, Volume XLI-B7, 2016 XXIII ISPRS Congress, 12–19 July 2016, Prague, Czech Republic
This contribution has been peer-reviewed.