Effect of a late season urea fertilization on methane
emission from a rice field in Italy
Jianguo Dan, Martin Krüger, Peter Frenzel, Ralf Conrad
∗ Max-Planck-Institut für Terrestrische Mikrobiologie, Karl-von-Frisch-Str., 35043 Marburg, GermanyReceived 7 March 2000; received in revised form 29 June 2000; accepted 25 August 2000
Abstract
The application of NH4+-based fertilizers is a common practice in rice production. The immediate effect of a late season
urea application on the processes involved in CH4emission from a rice field was investigated on sandy loam located in the
valley of River Po at Vercelli, northern Italy, and planted with rice (Oryza sativa, type japonica, variety Koral). Urea, applied at a rate of 50 kg N ha−1on the 75th day after flooding, significantly stimulated both CH
4production and CH4oxidation. During
the following 9 days, the rates of CH4production and CH4oxidation in the 0–3 cm soil layer increased by 24–52 and 18–41%,
respectively, of the fertilized plot compared to the unfertilized control plot. Methane oxidation on roots was also stimulated by urea, indicated by shorter lag times. Porewater concentrations of CH4in the 0–6 cm soil layer increased with time and soil
depth, but were not affected by fertilization with urea. Urea application also exhibited little impact on CH4emission. During
the 7 days following fertilization, urea only slightly reduced the CH4 flux. Ammonium originating from urea hydrolysis
was completely depleted from the porewater within 3 days, mainly due to plant uptake. Fertilizer application did also not affect the contribution of CH4oxidation to the net flux of CH4, determined by measuringd13CH4and by inhibition of CH4
oxidation. The absence of any effect of urea on net CH4emission in this study was presumably caused by the rapid depletion
of urea, the counterbalance between the increase of CH4production and the increase of CH4oxidation after fertilization, and
methanogenesis in deeper soil layers. © 2001 Elsevier Science B.V. All rights reserved.
Keywords: CH4production; CH4oxidation; Paddy field; Ammonium; Methane; Rice; Northern Italy
1. Introduction
Flooded rice fields are one of the major sources of CH4 to the atmosphere (Conrad, 1997; Minami and Neue, 1994; Neue, 1997; Wassmann et al., 1993). Application of nitrogen fertilizers, among which NH4+-based fertilizers are most common, is nec-essary for rice production. Consequently, effects of NH4+-based fertilizers on CH4 emission greatly
at-∗Corresponding author. Tel.:+49-6421-178801; fax:+49-6421-178809.
E-mail address: [email protected] (R. Conrad).
tract the attention of scientists. However, the results from numerous studies have so far been inconsis-tent, ranging from stimulation (Banik et al., 1996; Cicerone and Shetter, 1981; Lindau, 1994; Lindau and Bollich, 1993; Lindau et al., 1991; Singh et al., 1999) to inhibition (Bronson et al., 1997; Bodelier et al., 2000a,b; Schütz et al., 1989). The effects of NH4+-based fertilizers depend on type and amount of the fertilizer, as well as on mode and time of appli-cation (Cai et al., 1995; Neue and Sass, 1994; Schütz et al., 1989). These studies have also suggested that the effects of NH4+fertilizers on CH4emission can largely be attributed to effects on CH4production and 0167-8809/01/$ – see front matter © 2001 Elsevier Science B.V. All rights reserved.
CH4 oxidation. Whereas urea at normal application rates had little direct influence on CH4 production (Yang and Chang, 1998), CH4 production may in-directly be increased through improving the growth of rice plants, since CH4 produced during the late stage of rice mainly came from root exudates and root slay (Watanabe et al., 1999; Dannenberg and Conrad, 1999; Schütz et al., 1989). Indeed, a higher CH4 production potential was shown in rooted than in bulk soil (Bodelier et al., 2000b).
Besides CH4production nitrogen fertilization may also affect CH4oxidation. Methane oxidation requires O2and therefore occurs only in the oxic surface layer of the submerged rice soil (Conrad and Rothfuss, 1991) and in the vicinity of the rice roots which leak O2 into the surrounding soil (Frenzel et al., 1992; Gilbert and Frenzel, 1998). The effects of NH4+ on CH4oxidation are variable, from negative to positive. Generally, NH4+ has been reported as an inhibitor of CH4 oxidation (Conrad and Rothfuss, 1991; Dun-field and Knowles, 1995; van der Nat et al., 1997), due to two major mechanisms, i.e., competitive in-hibition and noncompetitive inin-hibition (Bedard and Knowles, 1989; Gulledge and Schimel, 1998; King and Schnell, 1994; Kravchenko, 1999; Schnell and King, 1994). In some cases, NH4+ reportedly acted as a stimulator of CH4oxidation in rice soil (Bender and Conrad, 1995; Bodelier et al., 2000a,b), as well in upland soils (Kruse and Iversen, 1995; Goldman et al., 1995; Prieme et al., 1997). When soil suffered from N limitation, addition of NH4+ stimulated the activities of CH4-oxidizing bacteria (Bodelier et al., 2000a).
Urea, a widely used NH4+-based fertilizer, sup-pressed CH4 emission over the rice growing season when it was deep-applied (Schütz et al., 1989), while it increased the CH4emission when it was broadcasted (Lindau et al., 1991; Schütz et al., 1989). Recently, however, an interesting phenomenon was observed: if planted pots were fertilized with urea, CH4 emission decreased immediately due to a stimulation of CH4 oxidation, and this effect was maintained for 1 week (Krüger and Frenzel, unpublished). The present study aimed to confirm, whether application of urea in the field had a similar effect on CH4emission. In particu-lar, it is of interest to see whether or not the fertilizer stimulated the CH4 oxidation process in the rice rhi-zosphere. Therefore, the effect of fertilization during
the late season was investigated when rice plants were fully grown.
2. Materials and methods
2.1. Field site
The studies were conducted in 1999 in a rice paddy of the Italian Rice Research Institute in Vercelli, lo-cated in the valley of River Po (45◦20′N; 8◦25′W). Methane emission from these fields has been studied since 1983 (Holzapfel-Pschorn and Seiler, 1986). The soil of the paddy fields is a Cambisol consisting of a sandy loam with 600 g kg−1 sand, 250 g kg−1 silt, 120 g kg−1 clay, 25 g kg−1organic matter, 1.5 g kg−1 total N with a pH around 6. The field was dry fallow during the winter, ploughed on the 18th April, flooded on the 12th May, seeded on the 14th May (variety Koral, type japonica), and drained for application of herbicide from 9 to 16th June. The field was divided into two parts: control plot (6 m×10 m) and fertiliza-tion plot (6 m×25 m). The two plots were separated with polyester frames pushed approximately 30 cm deep into the soil. Before flooding, the field was fer-tilized per hectare with 100 kg N as urea, 35 kg P as ThomasphosphateTM and 125 kg K as KCl. On the 26th July, urea was broadcasted by hand in the fertil-ization plot at a rate of 50 kg N ha−1. The field was drained on the 7th and harvested on the 30th Septem-ber. The grain yield was with 9.56 Mg ha−1 for the fertilized plots slightly higher than for the control plots with 9.19 Mg (S. Russo, personal communication). The weather and climate conditions during 1999 were not significantly different from the previous years.
2.2. CH4flux and N2O flux measurements
the sites of the chambers 1 and 3 were changed every day. The fixed chambers were used for methane flux measurements, while the movable ones were used to determine methane oxidation. Fluxes of CH4and N2O were measured by closing the chambers and follow-ing the temporal increase of the CH4and N2O mix-ing ratios inside the chambers by takmix-ing gas samples. Flux measurements were done twice each day. In the morning, gas samples were taken for measuring CH4, d13CH
4 and N2O. In the afternoon, difluoromethane (CH2F2) was added to the movable chambers 1 and 3 to inhibit CH4 oxidation, while chambers 2 and 4 were used for normal flux measurements. Production of CH4is not affected by CH2F2(Miller et al., 1998), which has been verified for the Italian rice soil in a pi-lot experiment (data not shown). The appropriate vol-ume of CH2F2 was filled into Tedlar-bags. The bags were connected to the sampling ports of the chambers and then injected to give a final mixing ratio of about 1%. Subsequently, gas samples were taken for mea-suring CH4emission.
The gas samples for CH4 measurements were taken with syringes (1 ml) at 5–30 min intervals for 30–120 min. The gas samples for N2O were taken with evacuated serum bottles (25 ml) at the same time intervals. The gas samples ford13CH4 measure-ments were taken with evacuated 100-ml bottles at the beginning and end of the sampling period.
The CH4 flux was determined from the linear in-crease of CH4mixing ratio with time. The fraction of methane that was oxidized in situ (Fox) was calculated from the difference between the fluxes measured with (afternoon) and without inhibitor (morning), corrected for diurnal effects
where f were the CH4fluxes in the chambers. The sub-script i denotes the chamber that received an inhibitor treatment during the afternoon flux measurement, while the subscript c stands for the control cham-ber. The subscript M denotes morning measurements while A stands for afternoon measurements.
2.3. Porewater profiles
Porewater samplers consisted of seven filtration tubes (diameter 2 mm, length 50 mm; pore size
0.2mm; X-Flow, The Netherlands) fixed in parallel on a PVC board (150 mm×300 mm) at 20–50 mm intervals. The porewater samplers were installed in the field before sowing. The samplers were placed into the flooded soil such that porewater could be sampled at 0, 20, 40, 60, 80, 130, 180 mm depth. Two samplers each were placed into the control and the fertilization plot, respectively. The porewater samples at each soil depth were taken in the morning with two 10-ml venoject tubes (Terumo, Belgium), which had been flushed with N2 and then evacuated. The first tube was used to flush the samplers (sample volume 2–4 ml) and was discarded. The second tube (sample volume >2 ml) was used for analysis of CH4, NH4+ and pH. After the tubes were heavily shaken by hand, a 0.2-ml gas sample was taken from the headspace of each tube with a 1-ml gas-tight syringe for CH4 analysis. Afterwards, the pH of the porewater sam-ples were measured. The steps for measuring NH4+ were as follows: 1 ml porewater or standard NH4+ solution was transferred into a 10-ml serum tube (inner diameter 12 mm), and 0.02 ml of a solution containing 0.5 M NaOH, 0.05 M disodium EDTA, and 10% methanol was added. The NH3 electrode (outer diameter 10 mm; WTW, Germany) was in-serted immediately avoiding air bubbles. A magnetic bar (2 mm×5 mm) was used to stir the sample during the measurement. The NH3 electrode was calibrated between 10−1and 5×10⁻⁶M.
2.4. Potential CH4production
from the increase of CH4 in the gas headspace and expressed inmmol CH4h−1g dw−1(dw: dry weight).
2.5. Potential CH4oxidation
The steps for preparing and transferring the soil slurries were the same as described above, but each flask contained only 10 ml slurry. For measurements of rice roots, the plants were taken from the field and the roots were separated from the plants and rinsed repeatedly in tap water until the runoff was clear. The roots were blotted with paper towels and put into 150-ml flasks. The flasks containing soil slurry or roots were stoppered with rubber septa. Pure CH4 (1.5 ml) was injected into each flask. Slurries were incubated in the dark at 25◦C on a shaker (120 rpm). Roots were incubated under the same conditions but without agitation. Before samples for CH4 analy-sis were taken, the flasks were shaken by hand to equilibrate aqueous and gas phase.
2.6. Root biomass
Soil cores were taken as described above and cut into 10-mm slices. The slices were washed with tap water in a sieve (mesh 0.5 mm) to remove the soil. The roots were weighted after drying at 65◦C overnight.
2.7. Gas analyses
Methane was analysed on an SRI gas chromato-graph equipped with a flame ionization detector (Bodelier et al., 2000b). The volumes of injected sam-ples were 1 ml for measuring CH4fluxes, and 0.2 ml for other measurements. N2O was analysed in a GC 8000 gas chromatograph (Fisons Instruments, Ger-many) equipped with a63Ni electron capture detector and a HayeSep N column (Bollmann and Conrad, 1997). The volume of injected gas was 1 ml.
Stable isotopic analysis of gas samples was per-formed using a gas chromatograph combustion iso-tope ratio mass spectrometry (GCC-IRMS; Finnigan, Bremen, Germany) system. The atmospheric samples were measured with a PreCon, while all other samples were directly injected. The principle operation has been described before (Brand, 1996; Sugimoto et al., 1991). The isotopes were detected in a Finnigan MAT
delta plus IRMS. Separation of CH4/CO2of the sam-ples (10–400ml) was performed in a Hewlett Packard 6890 gas chromatograph operating with a Pora PLOT Q column (27.5 m length, 0.32 mm i.d., 10mm film thickness; Chrompack, Frankfurt, Germany) at 25◦C and He (99.996% purity, 2.6 ml min−1) as carrier gas. The separated gases were then converted to CO2 in the Finnigan Standard GC Combustion Interface III and transferred into the IRMS. The working standard gas was CO2 (99.998% purity; Messer-Griessheim, Düsseldorf, Germany) calibrated against Pee Dee Belemnite carbonate. The isotopic ratios were ex-pressed in the delta notation:d13C=103(Rsa/Rst−1) withR = 13C/12C of sample (sa) and standard (st), respectively. The precision of repeated analysis was
±0.2‰when 1.3mmol CH4were injected.
2.8. Statistics
Means and regression coefficients (rates) are given with 95% confidence limits. Confidence limits of mean rates were calculated from the standard error of the mean, while confidence limits of individual rates were calculated from the standard error of the regression coefficient.
3. Results
3.1. CH4emission
Fig. 1. Variation of the average CH4fluxes in the chambers located
at the fixed field plots of two measurements each day; arrow indicates fertilization (mean±S.E.,n=2).
flux observed during the time (6 days) before fertiliza-tion. This observation suggests that CH4emission was only slightly, if at all, influenced by urea fertilization. The isotopic signatures of the emitted CH4 were measured only in the morning. From the 4th day be-fore fertilization to the 6th day after fertilization, the d13CH
4 were −69.3±1.2‰ and−64.2±1.3‰ for the fertilized and the control plot, respectively. This difference between the two fields may be explained by the general spatial inhomogeneity of the area un-specific for the fertilization treatment. The relatively stable d13CH4 values in the single fields during the measured period indicated that the application of urea had no apparent effect on the isotopic composition of the emitted CH4. The inhibition experiments with CH2F2 showed that the percentage fraction of the produced CH4that was oxidized was similar for the fertilized plot (11.3±16.8%) and the control plot (9.0±23.7%), indicating that urea did not affect CH4 oxidation.
Nitrous oxide fluxes were also measured during our experimental period, but not detected (i.e., <20mg N2O–N m−2h−1) in either the fertilized or the control plots. Apparently, the late-season application of urea did not cause N2O emission.
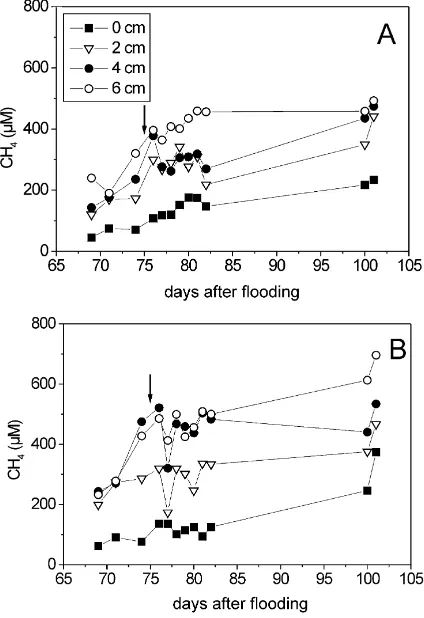
3.2. Porewater profiles of CH4and ammonium The CH4 concentrations in the soil porewater at 8–18 cm depth were extremely high, sometimes even
Fig. 2. Temporal change of CH4 concentrations in the soil
pore-water taken from different depths of (A) control and (B) fertilized plot, respectively. Arrow indicates fertilization.
supersaturated with CH4. Minute gas bubbles may have been withdrawn with the porewater causing an apparent supersaturation. The CH4 concentrations at 0–6 cm depth are shown in Fig. 2. Only a brief de-crease of CH4 concentration was noted at the 2nd day after fertilization at 0–6 cm depth. Otherwise, however, urea fertilization had no apparent effect on porewater CH4.
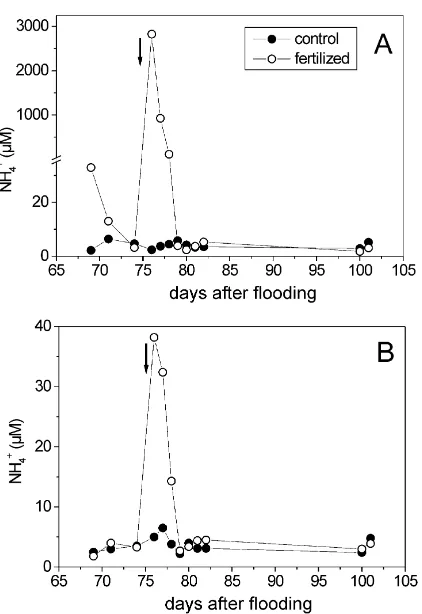
Fig. 3. Temporal change of the NH4+ concentration in the
pore-water of the control and fertilized plots at (A) 0 cm and (B) 2 cm depth. Arrow indicates fertilization.
In both, fertilized and control plots, porewater pH did not exhibit a trend with time or soil depth, and ranged between pH 6.5 and 7.3.
3.3. Potential CH4production
Methane was produced in soil from both, fertilized and control plots without lag, indicating that methano-genesis was highly active. Two days after fertiliza-tion with urea, CH4production was significantly (p < 0.01) stimulated (41% higher) in the 0–3 cm soil lay-ers (Fig. 4A). The CH4 production rates were 22.0 and 17.7mmol h−1g dw−1 for the fertilized and con-trol plot, respectively. Nine days after fertilization, CH4production still was higher in the fertilized plot, both in the 0–3 cm (53%) and the 3–10 cm (91%) soil layers (Fig. 4A).
Fig. 4. Temporal change of (A) CH4 production rates and (B)
CH4 oxidation rates in two different soil layers. Arrow indicates
fertilization (mean±S.E.,n=4).
3.4. Potential CH4oxidation in soil
Methane oxidation in both plots started quickly (lag time≤20 h), suggesting that CH4-oxidizing bacteria were active in situ. The CH4oxidation rates decreased with time. Two days after urea fertilization CH4 oxida-tion was significantly stimulated (41%) in the 0–3 cm soil layer (p <0.01), but not in the 3–10 cm soil layer (Fig. 4B). The stimulation decreased with time and by the 24th day after fertilization the CH4oxidation rates in both plots were nearly the same.
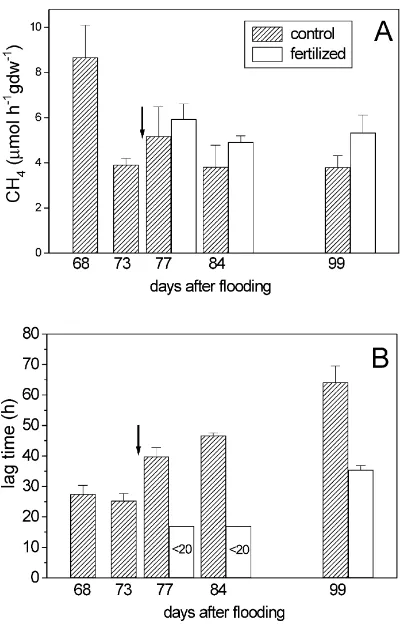
3.5. CH4oxidation on roots
Fig. 5. Temporal change of (A) CH4 oxidation rates and (B) lag
times of CH4oxidation on the roots of rice plants. Arrow indicates
fertilization (mean±S.E.,n=4).
after fertilization the CH4 oxidation rates ranged at 4.9–5.9 and 3.8–5.2mmol h−1g dw−1 for the fertil-ized and the control plot, respectively, being not sig-nificantly different (p > 0.05). Only on the 22nd day after fertilization, the rate in the fertilized plot (5.3mmol h−1g dw−1) was significantly (p < 0.05) higher than in the control plot.
However, the lag time of CH4oxidation was drasti-cally shortened upon fertilization (Fig. 5B). After fer-tilization with urea the lag time decreased to<20 h. In the control plot, however, the lag time increased with time from about 25 to >60 h (r=0.97).
The distribution of root biomass was determined on the 5th day after fertilization. The roots were mainly concentrated in the top soil. The roots at 0–4 cm soil depth accounted for 55–88 and 75–86% of the total root biomass for the fertilized and the control plot, respectively.
4. Discussion
4.1. Fertilizer effect on CH4emission
In this study, the application of urea showed little immediate effect on CH4 emission from a rice field, although increases of both CH4 production and CH4 oxidation were observed after fertilization. Urea stim-ulated CH4production in the top soil layers. However, urea also stimulated CH4consumption in the top soil as indicated by the increase of CH4 oxidation rate, and stimulated CH4 consumption on the roots as in-dicated by the shortening of the lag time. Since the NH4+ produced from urea was rapidly depleted, the stimulation was attributed at least in part to indirect effects of NH4+, such as changes in root exudation and O2loss from the roots.
However, the stimulation of CH4 production and CH4 oxidation by urea did not result in a change of the CH4concentration in soil porewater. Bodelier et al. (2000b) reported similar results. Therefore, it is likely that the increase of CH4production was coun-terbalanced by the increase of CH4 oxidation. An-other possible interpretation is that the porewater CH4 concentration in the top soil layer was stabilized by CH4 diffusing upwards from deeper soil. Roots were mainly concentrated in the top soil. Considering that CH4 emission depends to a great degree on the CH4 concentration around the roots (Conrad, 1993; Nouchi and Mariko, 1993), it is plausible that CH4emission after fertilization changed little due to the negligible changes of porewater CH4.
4.2. Fate of fertilizer nitrogen
CH2F2 further confirmed that urea, and NH4+ pro-duced from it, had little effect on CH4oxidation.
After application, urea quickly hydrolyses to NH4+. The depletion of exogenous NH4+follows three path-ways: plant uptake, consumption by CH4-oxidizing and NH4+-oxidizing bacteria, and volatilization of NH3. In the present study, it is believed for the follow-ing reasons that NH4+was mainly depleted by plant uptake. First, urea was broadcasted soon after panicle initiation stage. It is after panicle initiation that the capacity of rice plants to take up NH4+ reaches the maximum (Takenaga, 1995). Second, nitrification of urea-N to nitrate or nitrite is the precondition of deni-trification and of production of N2O (Arth et al., 1998; Henckel and Conrad, 1998). In this study, however, N2O emission was not detectable after the fertiliza-tion at 75 daf, indicating that nitrificafertiliza-tion of NH4was relatively unimportant in the late season. Third, con-sidering that conversion of NH4+to NH3depends on high pH and that the soil pH value was close to pH 7, the contribution of NH3volatilization to the depletion of NH4+should be rather small.
5. Conclusions
After a modest fertilizer application of 50 kg N ha−1 no immediate effect of urea on CH4 emission from the rice field was observed. Rice plants took up NH4+ so fast that a direct impact of NH4+ on CH4 oxida-tion was hardly possible. Even though urea apparently stimulated both CH4 production and CH4 oxidation in the top soil during the 9 days following fertiliza-tion, porewater CH4concentrations at 0–6 cm depths were not affected. Most probably, the counterbalance between stimulation of CH4production and stimula-tion of CH4oxidation and the strong methanogenesis in lower soil layers were responsible for the lack of major changes in CH4emission after urea application in the late season (75 daf). However, fertilization ef-fects cannot be excluded in general, in particular when higher amounts of nitrogen are added.
Acknowledgements
We thank Dr. S. Russo for providing and managing the field plots. We also thank P. Claus and U. Jäckel
for help and discussion during the experiments. This work was financially supported by the European Com-mission, project BIO4CT960419, and the Deutsche Forschungsgemeinschaft (DFG), project Fr1054/1. J. Dan was supported by a scholarship from the German Academic Exchange Service (DAAD).
References
Arth, I., Frenzel, P., Conrad, R., 1998. Denitrification coupled to nitrification in the rhizosphere of rice. Soil Biol. Biochem. 30, 509–515.
Banik, A., Sen, M., Sen, S.P., 1996. Effects of inorganic fertilizers and micronutrients on methane production from wetland rice (Oryza sativa L.). Biol. Fertil. Soils 21, 319–322.
Bedard, C., Knowles, R., 1989. Physiology, biochemistry, and specific inhibitors of CH4, NH4+, and CO oxidation by
methanotrophs and nitrifiers. Microbiol. Rev. 53, 68–84. Bender, M., Conrad, R., 1995. Effect of CH4 concentrations and
soil conditions on the induction of CH4oxidation activity. Soil
Biol. Biochem. 27, 1517–1527.
Bodelier, P.L.E., Roslev, P., Henckel, T., Frenzel, P., 2000a. Ammonium stimulates methane oxidation in rice soil. Nature (London) 403, 421–424.
Bodelier, P.L.E., Hahn, A.P., Arth, I.R., Frenzel, P., 2000b. Effects of ammonium-based fertilisation on microbial processes involved in methane emission from soils planted with rice. Biogeochemistry 51, 225–257.
Bollmann, A., Conrad, R., 1997. Acetylene blockage technique leads to underestimation of denitrification rates in oxic soils due to scavenging of intermediate nitric oxide. Soil Biol. Biochem. 29, 1067–1077.
Brand, W.A., 1996. High precision isotope ratio monitoring techniques in mass spectrometry. J. Mass Spectr. 31, 225–235. Bronson, K.F., Neue, H.U., Singh, U., Abao, E.B., 1997. Automated chamber measurements of methane and nitrous oxide flux in a flooded rice soil. 1. Residue, nitrogen, and water management. Soil Sci. Soc. Am. J. 61, 981–987.
Cai, Z., Yan, X., Xu, H., Tsuruta, H., Yagi, K., Minami, K., 1995. Effect of nitrogen form on CH4emission from rice paddy field.
Acta Pedologica Sinica 32 (Suppl.), 136–143.
Cicerone, R.J., Shetter, J.D., 1981. Sources of atmospheric methane: measurements in rice paddies and a discussion. J. Geophys. Res. 86, 7203–7209.
Conrad, R., 1993. Mechanisms controlling methane emission from wetland rice fields. In: Oremland, R.S. (Ed.), The Biogeochemistry of Global Change: Radiative Trace Gases. Chapman & Hall, New York, pp. 317–335.
Dannenberg, S., Conrad, R., 1999. Effect of rice plants on methane production and rhizospheric metabolism in paddy soil. Biogeochemistry 45, 53–71.
Dunfield, P., Knowles, R., 1995. Kinetics of inhibition of methane oxidation by nitrate, nitrite, and ammonium in a humisol. Appl. Environ. Microbiol. 61, 3129–3135.
Frenzel, P., Rothfuss, F., Conrad, R., 1992. Oxygen profiles and methane turnover in a flooded rice microcosm. Biol. Fertil. Soils 14, 84–89.
Gilbert, B., Frenzel, P., 1998. Rice roots and CH4oxidation — the
activity of bacteria, their distribution and the microenvironment. Soil Biol. Biochem. 30, 1903–1916.
Goldman, M.B., Groffman, P.M., Pouyat, R.V., McDonnell, M.J., Pickett, S.T.A., 1995. CH4 uptake and N availability in forest
soils along an urban to rural gradient. Soil Biol. Biochem. 27, 281–286.
Gulledge, J., Schimel, J.P., 1998. Low-concentration kinetics of atmospheric CH4 oxidation in soil and mechanism of NH4+
inhibition. Appl. Environ. Microbiol. 64, 4291–4298. Henckel, T., Conrad, R., 1998. Characterization of microbial NO
production, N2O production and CH4 oxidation initiated by
aeration of anoxic rice field soil. Biogeochemistry 40, 17–36. Holzapfel-Pschorn, A., Seiler, W., 1986. Methane emission during
a cultivation period from an Italian rice paddy. J. Geophys. Res. 91, 11803–11814.
King, G.M., Schnell, S., 1994. Effect of increasing atmospheric methane concentration on ammonium inhibition of soil methane consumption. Nature 370, 282–284.
Kravchenko, I.K., 1999. The inhibiting effect of ammonium on the activity of the methanotrophic microbial community of a raised sphagnum bog in West Siberia. Mikrobiologiya 68, 241–246. Kruse, C.W., Iversen, N., 1995. Effect of plant succession,
ploughing, and fertilization on the microbiological oxidation of atmospheric methane in a heathland soil. FEMS Microbiol. Ecol. 18, 121–128.
Lindau, C.W., 1994. Methane emissions from Louisiana rice fields amended with nitrogen fertilizers. Soil Biol. Biochem. 26, 353– 359.
Lindau, C.W., Bollich, P.K., 1993. Methane emissions from Louisiana first and ratoon crop rice. Soil Sci. 156, 42–48. Lindau, C.W., Bollich, P.K., DeLaune, R.D., Patrick, W.H., Law,
V.J., 1991. Effect of urea fertilizer and environmental factors on CH4emissions from a Louisiana, USA rice field. Plant Soil
136, 195–203.
Miller, L.G., Sasson, C., Oremland, R.S., 1998. Difluoromethane, a new and improved inhibitor of methanotrophy. Appl. Environ. Microbiol. 64, 4357–4362.
Minami, K., Neue, H.U., 1994. Rice paddies as a methane source. Clim. Change 27, 13–26.
Neue, H.U., 1997. Fluxes of methane from rice fields and potential for mitigation. Soil Use Mgmt. 13, 258–267.
Neue, H.-U., Sass, R.L., 1994. Trace gas emissions from rice fields. In: Prinn, R.G. (Ed.), Global Atmospheric–Biospheric Chemistry. Plenum Press, New York, pp. 119–147.
Nouchi, I., Mariko, S., 1993. Mechanism of methane transport by rice plants. In: Oremland, R.S. (Ed.), Biogeochemistry of Global Change. Chapman & Hall, New York, pp. 336– 352.
Prieme, A., Christensen, S., Dobbie, K.E., Smith, K.A., 1997. Slow increase in rate of methane oxidation in soils with time following land use change from arable agriculture to woodland. Soil Biol. Biochem. 29, 1269–1273.
Schnell, S., King, G.M., 1994. Mechanistic analysis of ammonium inhibition of atmospheric methane consumption in forest soils. Appl. Environ. Microbiol. 60, 3514–3521.
Schütz, H., Holzapfel-Pschorn, A., Conrad, R., Rennenberg, H., Seiler, W., 1989. A 3-year continuous record on the influence of daytime, season, and fertilizer treatment on methane emission rates from an Italian rice paddy. J. Geophys. Res. 94, 16405– 16416.
Singh, S., Singh, J.S., Kashyap, A.K., 1999. Methane flux from irrigated rice fields in relation to crop growth and N-fertilization. Soil Biol. Biochem. 31, 1219–1228.
Sugimoto, A., Hong, X., Wada, E., 1991. Rapid and simple measurement of carbon isotope ratio of bubble methane using GC/C/IRMS. Mass Spectros. 39, 261–266.
Takenaga, H., 1995. Internal factors in relation to nutrient absorption. In: Matsue, T., Kumazawa, K., Ishii, R., Ishihara, K., Hirata, H. (Eds.), Science of the Rice Plant, Vol. II: Physiology. Food and Agriculture Policy Research Center, Tokyo, 139 pp.
van der Nat, F.J.W.A., De Brouwer, J.F.C., Middelburg, J.J., Laanbroek, H.J., 1997. Spatial distribution and inhibition by ammonium of methane oxidation in intertidal freshwater marshes. Appl. Environ. Microbiol. 63, 4734–4740.
Wassmann, R., Papen, H., Rennenberg, H., 1993. Methane emission from rice paddies and possible mitigation strategies. Chemosphere 26, 201–217.
Watanabe, A., Takeda, T., Kimura, M., 1999. Evaluation of origins of CH4 carbon emitted from rice paddies. J. Geophys. Res.
104, 23623–23629.