CORRECTION OF OVERLAPPING MULTISPECTRAL LIDAR INTENSITY DATA:
POLYNOMIAL APPROXIMATION OF RANGE AND ANGLE EFFECTS
Wai Yeung Yan∗, Ahmed Shaker
Department of Civil Engineering, Ryerson University, Toronto, Ontario, Canada (waiyeung.yan,ahmed.shaker)@ryerson.ca
KEY WORDS:Multispectral LiDAR, Radiometric Correction, LiDAR Intensity, Intensity Banding, Striping Noise
ABSTRACT:
Recent development of radiometric calibration, correction and normalization approaches have facilitated the use of monochromatic LiDAR intensity and waveform data for land surface analysis and classification. Despite the recent successful attempts, the majority of existing approaches are mainly tailor made for monochromatic LiDAR toward specific land surface scenario. In view of the latest development of multispectral LiDAR sensor, such as the Optech Titan manufactured by Teledyne Optech, a more generic approach should be developed so that the radiometric correction model is able to handle and compensate the laser energy loss with respect to different wavelengths. In this study, we propose a semi-physical approach that aims to utilize high order polynomial functions to model the distortion effects due to the range and the angle. To estimate the parameters of the respect polynomial functions for the range and angle, our approach first locates a pair of closest points within the overlapping LiDAR data strips and subsequently uses a non-linear least squares adjustment to retrieve the polynomial parameters based on the Levenberg-Marquardt algorithm. The approach was tested on a multispectral airborne LiDAR dataset collected by the Optech Titan for the Petawawa Research Forest located in Ontario, Canada. The experimental results demonstrated that the coefficient of variation of the intensity of channel 1 (1550 nm), channel 2 (1064 nm) and channel 3 (532 nm) were reduced by 0.1% to 39%, 10% to 45% and 12% to 54%, respectively. The striping noises, no matter found within single strip and overlapping strips, were significantly reduced after implementing the proposed radiometric correction.
1. INTRODUCTION
Remote sensing community has evidenced a boom of sensor de-velopment, particularly the Light Detection And Ranging (Li-DAR) sensor, for Earth observation and planetary exploration. Among which the ICESat (Schutz et al., 2005), Mars Orbiter Laser Altimeter (Smith et al., 2001), and Lunar Orbiter Laser Al-timeter (Smith et al., 2010) were launched for the exploration of the Earth, Mars and Lunar, respectively, during the last decade. Due to the operation of monochromatic laser, the LiDAR data being collected are mainly used for topographic mapping or ge-ometric measurement, instead of studying the Earth and plane-tary surface properties. In view of the forthcoming space borne LiDAR mission, it is foreseeable that future space mission will adopt the use of multi-wavelength lasers in order to study the Earth and planetary surface properties, through analyzing the backscattered laser signal strength.
Teledyne Optech has officially manufactured the world’s first commercial multispectral airborne LiDAR sensor, Optech Titan, where the sensor is capable of collecting laser point clouds at three different wavelengths (532 nm, 1064 nm and 1550 nm) si-multaneously. Such a break-through in LiDAR technology com-pensates the drawback of high resolution satellite remote sensing imagery in various ways and opens many doors in topographic and environmental applications. Recent attempts can be found in different applications using multispectral LiDAR data, includ-ing land cover classification (Wang et al., 2014; Matikainen et al., 2017; Morsy et al., 2017), tree species classification (Yu et al., 2017), road extraction (Karila et al., 2017), water mapping (Morsy et al., 2016). One can foresee the multispectral LiDAR sensors will be deployed in different platforms in near future.
∗Corresponding author
With various radiometric pre-processing techniques being pro-posed and developed (Kashani et al., 2015), LiDAR data users reap the benefits of using the monochromatic laser intensity data for surface classification and object recognition (Yan et al., 2015). Most of the existing radiometric calibration and correction mod-els are built upon the radar (range) equation that considers the system- and environment induced distortions, including the range (Kaasalainen et al., 2011), incidence angle (You et al., 2017), atmospheric attenuation (Errington and Daku, 2017) and other system parameters (Vain et al., 2010). To minimize the dis-crepancy in overlapping strips, certain radiometric normalization approaches have been proposed (Yan and Shaker, 2014, 2016) which have proven to reduce the striping noise found within the overlapping region. Indeed, all these radiometric pre-processing techniques not only improve the intensity data quality, but also maximize the benefits of using the intensity data in different ap-plication domains.
2. PROPOSED RADIOMETRIC CORRECTION
The majority of existing radiometric correction model for LiDAR intensity data is built upon the radar (range) equation (Jelalian, 1992) that describes the relationship of the backscattered laser energy with respect to various system and environmental param-eters as shown in the following equation:
Pr=
PtDr2
4πR4βtηsysηatmσ (1)
wherePrrefers to the received laser energy,Ptrefers to the
trans-mitted laser energy,Dris the diameter aperture,Ris the range,
ηsys andηatm are the system and atmospheric attenuation,
re-spectively, and finallyσdescribes the characteristics of the laser pulse being backscattered from the ground objects:
σ= 4πρscosθ (2)
whereρs refers to the spectral reflectance of the surface andθ
refers to the incidence angle. Since most of the existing studies assume Lambertian reflectance occurred in the ground surface; therefore cosine of incidence angle is being used to describe the diffuse reflectance. With several parameters assumed as constant and unchanged during the flight survey, the radiometric correc-tion model is commonly simplified as follows:
Ic∝I· R 2
cosθ (3)
whereIcrefers to the corrected intensity data andIrefers to the
original intensity data. Although the above Eq. 3 is commonly used for radiometric calibration and radiometric correction by normalizing the data with either 1/R2minimum or 1/R2median,
the use of cosine correction for incidence angle seems to be in-efficient for laser pulses collected by different wavelengths and different land cover scenarios. Our previous study also pointed out the use of cosine incidence angle may induce overcorrection in certain scenarios (Yan and Shaker, 2014). Therefore, we pro-pose to use polynomial approximation to model the laser attenu-ation effects due to the range and angle loss. In this case, Eq. 3 becomes
Ic∝I·
a0+a1R+a2R2+a3R3+· · ·+anRn
b0+b1θ+b2θ2+b3θ3+· · ·+bnθn
(4)
To estimate the polynomial coefficientsaiandbithat are used to
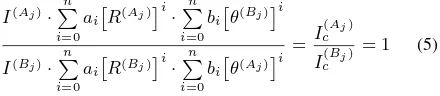
correct the effects of range and incidence angle, we reply on the use of overlapping data strips to estimate these coefficients. Sim-ilar to our previous work (Yan and Shaker, 2016), assume there exist a set of multispectral LiDAR data having two overlapping strips, i.e.,X(Aj)and
X(Bj), wherejrefers to the data channel,
the process begins by looking for a set of closest points between the two overlapping data strips in each of the data channels within a specific threshold. Once a set of data point is being paired up from the two data strips, i.e.,x(Aj)andx(Bj), we assume their
corrected intensity (spectral reflectance) would be identical, i.e.
I(Aj)
c =I
(Bj)
c . Therefore, Eq. 4 can be expressed as:
I(Aj)·
Since the above Eq. 5 is a non-linear equation, non-linear least squares adjustment should be conducted in order to estimate the
parameter ofaiandbiwith respect to the original intensity data,
range and incidence angle provided by the matched data points from the two strips, i.e. I(Aj)andI(Bj),R(Aj)andR(Bj), and
θ(Aj)andθ(Bj), respectively. To yield a robust estimation of the
non-linear least squares adjustment, the Levenberg-Marquardt al-gorithm is implemented to estimate the polynomial coefficients. Once the coefficients are solved, they are applied back to the Eq. 4 in order to perform the radiometric correction for the corre-sponding channeljof the two LiDAR data strips, and the above-mentioned process is implemented for all the available channels independently.
3. EXPERIMENTAL WORK 3.1 Multispectral LiDAR Dataset
The multispectral LiDAR datasets were collected for the Lauren-tian Hills (approximately 350 m above mean sea level), situated at the northwest of the town of Petawawa (45◦53’ N, 77◦16’ W), Ontario, Canada (see Fig. 1). A subset of the data was clipped, in which it covers south of the Petawawa Research Forest. The mul-tispectral LiDAR dataset contains three overlapping strips with more than 50% overlap, in which they have an approximate ex-tent of 1.5 km (across track) by 21.5 km (along track). The flight mission was accomplished on July 20th, 2016. The Optech Titan
sensor was operated with scan angle±24◦, pulse repetition fre-quency 300 kHz per channel and flying attitude 1,100 m above sea level. With these settings, the mean point density yields ap-proximately 4.36 points/m2, 4.66 points/m2, and 1.61 points/m2 for the channel 1, channel 2 and channel 3, respectively. Table 1 summarizes the LiDAR system settings and data specification.
Table 1. LiDAR system settings and data specification.
Dataset
Sensor Optech Titan
Date of Acquisition July 20th, 2016 Wavelength 532 nm / 1064 nm / 1550 nm Flying Height ∼1,100 m above sea level
Scan Angle ±24◦
Pulse Repetition Frequency 300 kHz per channel Percentage of Overlap >50%
Mean Point Density ∼1.56 to 4.87 points/m2 Mean Point Spacing ∼0.45 m to 0.80 m
3.2 Data Processing
The LiDAR data files were provided in bothlasformat and ASCII format, where the following data fields were extracted for compu-tation:x-coordinate,y-coordinate,z-coordinate, intensity, range, scan angle, return number, total number of returns, and scan di-rection flag. Prior to the radiometric cordi-rection, we observed a mild intensity striping noise occurred in each of the individual LiDAR data strip in channel 1 and channel 2. The reason is due to the effect of “intensity banding”, where a portion of the laser beam may wander off the detector edge in a specific scan direc-tion. Therefore, a pre-processing was first conducted to split each of the individual data strip into positive scan direction and neg-ative scan direction based on the “scan direction flag” in thelas
Ontario
Figure 1. Study area and multispectral LiDAR data strips.
dataset of negative scan direction based on a second order poly-nomial model. After the normalization, the LiDAR dataset with both positive and negative scans were combined and the observed “intensity banding” effects were significantly reduced. Subse-quently, the proposed radiometric correction was implemented.
As mentioned in section 2, the process began by pairing up the closest points within the overlapping region of the three strips. Therefore, kd-tree was built on the LiDAR data strips, regardless of the data channels, in order to speed up the searching of closest points in each pair of the overlapping LiDAR data strips. Half of the meaning point spacing was used as a threshold to pair up the closest points within the overlapping region. The range and angle polynomial models, as noted in Eq. 4, were set to be in the third order based on the experimental trials. To initialize the non-linear least squares solution, onlya2andb1 were set as 1 and the rest
of the parameters were assigned as zero. Such an initialization settings deemed to be similar as the traditional radiometric cor-rection being commonly used (Yan et al., 2012). Since the study area covers mainly the forest canopies, the use of incidence an-gle for radiometric correction may induce certain overcorrection effects as reported in our previous study (Yan and Shaker, 2014). Therefore, we only used the scan angle instead of incidence angle for the radiometric correction.
3.3 Experimental Evaluation
Similar to our previous work (Yan and Shaker, 2014, 2016), sev-eral land cover samples were collected in order to compute the mean and standard deviation of the intensity data before and after radiometric correction. Four types of land cover samples, includ-ing bare soil, tree canopies, grass cover and road, were selected within the overlapping LiDAR data strips as well as the individ-ual strips in order to assess the coefficient of variation (cv), which can be used to assess the homogeneity of the selected land cover feature (ω).
cv(ω) = σ(ω)
µ(ω) (6)
Such an evaluation can help to quantitatively assess the level of noise within the intensity data for all the three data channels be-fore and after radiometric correction. If the value ofcvis reduced after radiometric correction, one can conclude that the radiomet-ric correction process can help to reduce the intensity noise.
4. RESULTS AND ANALYSIS
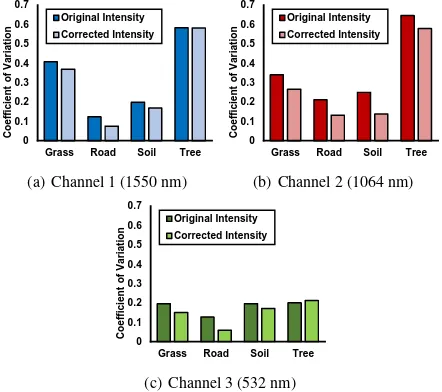
Fig. 2 shows thecvof the four land cover samples computed for channel 1, channel 2 and channel 3 before and after radiometric correction. One can easily observe a reduction ofcvin the ma-jority of the land cover samples after performing the radiometric normalization for “intensity banding” and the proposed radiomet-ric correction. In channel 1 (Fig. 2(a)), the road data samples recorded a reduction ofcvby 39% (from 0.407 to 0.369 after ra-diometric correction). The soil and grass samples had acv0.198 and 0.407 before radiometric correction, and their corresponding
cvrecorded a reduction by 15% and 9% after implementing the proposed correction. Among all the data samples, tree canopies had the least reduction ofcv(only 0.1%).
0
(a) Channel 1 (1550 nm)
0
(b) Channel 2 (1064 nm)
0
Figure 2. Coefficient of variation (cv) of four selected land cover samples before and after radiometric correction.
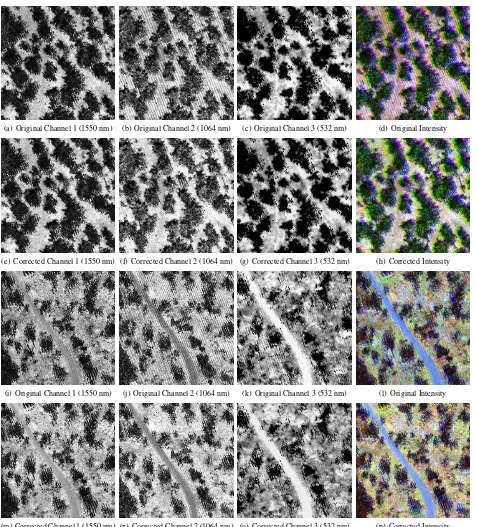
(a) Original Channel 1 (1550 nm) (b) Original Channel 2 (1064 nm) (c) Original Channel 3 (532 nm) (d) Original Intensity
(e) Corrected Channel 1 (1550 nm) (f) Corrected Channel 2 (1064 nm) (g) Corrected Channel 3 (532 nm) (h) Corrected Intensity
(i) Original Channel 1 (1550 nm) (j) Original Channel 2 (1064 nm) (k) Original Channel 3 (532 nm) (l) Original Intensity
(m) Corrected Channel 1 (1550 nm) (n) Corrected Channel 2 (1064 nm) (o) Corrected Channel 3 (532 nm) (p) Corrected Intensity
Figure 3. Multispectral LiDAR intensity image before and after radiometric correction.
ofcvby 10% (from 0.646 to 0.579) after implemented the pro-posed normalization and correction. The grass and soil samples both had a reduction ofcvby 22% (from 0.340 to 0.266) and 45% (from 0.249 to 0.138). Similar to channel 1, thecvof LiDAR data road sample points decreased 38%.
The proposed radiometric correction performed least well among the three data channels. One of the reasons can be explained by the relative low reflectance of land covers in the green wavelength (532 nm), and thus the striping noise may not appear obvious. In addition, the LiDAR sensor of channel 3 did not suffer from the problem of “intensity banding”. Both soil and grass samples
had a similarcvvalue at around 0.196. After radiometric correc-tion, bothcvvalues decreased to 0.172 (soil) and 0.150 (grass) by 12% and 23%, respectively. The road samples performed the best among the four samples with a reduction ofcvby 54%. However, the absolute value ofcvin channel 3 was comparatively low than the other two channels. Surprisingly, the tree samples recorded an increase ofcvfrom 0.2 to 0.212 after radiometric correction. Despite these, the impact of radiometric correction on channel 3 was not significant at all.
chan-nel 1, green band = chanchan-nel 2 and blue band = chanchan-nel 3 in Figs. 3(d) and 3(h) and band combination: red band = channel 2, green band = channel 1 and blue band = channel 3 in Figs. 3(i) and 3(p). As shown in both Figs. 3(d) and 3(i), both multispectral LiDAR intensity images suffered from systematic line striping noise that are obvious on the ground level (both bare soil, road and grass cover). Such striping noises were not found visually obvious on the tree canopies, but they were still noticeable. After running the proposed data correction scheme, the line striping noises were significantly reduced. Among the three LiDAR channels, channel 2 had the highest level of striping noise (see Figs. 3(b) and 3(j)) in the original intensity data. Therefore, the the corrected inten-sity of channel 2 had an obvious reduction of noise (see Figs. 3(f) and 3(n)). Channels 1 and 3 did not suffer from the high level of striping noise as channel 2, and thus the visual impact of ra-diometric correction was not as noticeable as that of channel 2. Regardless of the LiDAR data channels, there still existed a low level of intensity noise due to the the occurrence of shadows and occlusions on tree crowns. In addition, significant energy loss was found along the edge of the scan, and this thus caused a high intensity discrepancy comparing to those at the nadir.
5. CONCLUSIONS
Recent development of multispectral airborne LiDAR has deemed to be a break-through in the remote sensing community, and such a cutting edge technology can improve the analytical capability and accuracy in different remote sensing applications. In order to maximize the benefits of using the multispectral Li-DAR intensity data for thematic analysis, radiometric correction should be first conducted to remove or reduce the system- and environmental- induced distortions. In spite of the existing radio-metric calibration and correction techniques for monochromatic LiDAR, there is a need for further refinement of the radiometric correction model with respect to the various wavelengths. We thus propose a semi-physical correction model that is built upon the radar (range) equation, where the effects of range and angle are modelled by a respective polynomial equation. Such a setting provides a flexible and approximate description of different types of reflection through modelling the intensity discrepancy within the overlapping data strips. Our experimental work demonstrated an improvement of radiometric quality after implementing the proposed radiometric correction model by up to 39% to 54% in the respective three LiDAR data channels collected by Optech Titan for the Petawawa Research Forest, Ontario, Canada. The line striping noises were obviously reduced after implementing the proposed correction model. Further effort should be placed toward incorporating such polynomial based approximation of range and angle with the considerations of both specular and dif-fuse components, and fusing with different BRDFs.
ACKNOWLEDGEMENTS
The research was supported by the Natural Sciences and Engi-neering Research Council of Canada (NSERC). The multispec-tral LiDAR dataset was obtained through the AWARE project (NSERC File: CRDPJ 462973 - 14, Grantee: N.C. Coops, FRM, UBC), in collaboration with Canadian Wood Fiber Cen-tre (CWFC), FP-Innovations and Tembec. The authors would like to express appreciation to Prof. Benoˆıt St-Onge and Jean-Franc¸ois Prieur from the Universit´e du Qu´ebec `a Montr´eal, Prof. Paul Treitz from Queen’s University and Dr. Paul E. LaRocque from Teledyne Optech for providing the dataset, technical sup-port and illuminating discussions on the research problem.
References
Carrea, D., Abellan, A., Humair, F., Matasci, B., Derron, M.-H. and Jaboyedoff, M., 2016. Correction of terrestrial LiDAR intensity channel using Oren–Nayar reflectance model: an ap-plication to lithological differentiation.ISPRS Journal of Pho-togrammetry and Remote Sensing113, pp. 17–29.
Ding, Q., Chen, W., King, B., Liu, Y. and Liu, G., 2013. Combi-nation of overlap-driven adjustment and Phong model for Li-DAR intensity correction. ISPRS Journal of Photogrammetry and Remote Sensing75, pp. 40–47.
Errington, A. F. and Daku, B. L., 2017. Temperature compen-sation for radiometric correction of terrestrial LiDAR intensity data.Remote Sensing9(4), pp. 356.
Jelalian, A. V., 1992.Laser Radar Systems. Artech House.
Jutzi, B. and Gross, H., 2010. Investigations on surface reflection models for intensity normalization in airborne laser scanning (ALS) data.Photogrammetric Engineering & Remote Sensing
76(9), pp. 1051–1060.
Kaasalainen, S., Jaakkola, A., Kaasalainen, M., Krooks, A. and Kukko, A., 2011. Analysis of incidence angle and distance ef-fects on terrestrial laser scanner intensity: search for correction methods.Remote Sensing3(10), pp. 2207–2221.
Karila, K., Matikainen, L., Puttonen, E. and Hyypp¨a, J., 2017. Feasibility of multispectral airborne laser scanning data for road mapping. IEEE Geoscience and Remote Sensing Letters
14(3), pp. 294–298.
Kashani, A. G., Olsen, M. J., Parrish, C. E. and Wilson, N., 2015. A review of LiDAR radiometric processing: from ad hoc in-tensity correction to rigorous radiometric calibration. Sensors
15(11), pp. 28099–28128.
Matikainen, L., Karila, K., Hyypp¨a, J., Litkey, P., Puttonen, E. and Ahokas, E., 2017. Object-based analysis of multispec-tral airborne laser scanner data for land cover classification and map updating.ISPRS Journal of Photogrammetry and Remote Sensing128, pp. 298–313.
Morsy, S., Shaker, A. and El-Rabbany, A., 2017. Multispectral LiDAR data for land cover classification of urban areas. Sen-sors17(5), pp. 958.
Morsy, S., Shaker, A., El-Rabbany, A. and LaRocque, P., 2016. Airborne multispectral lidar data for land-cover classification and land/water mapping using different spectral indexes. IS-PRS Annals of Photogrammetry, Remote Sensing & Spatial In-formation Sciences3(3), pp. 214–224.
Schutz, B., Zwally, H., Shuman, C., Hancock, D. and DiMarzio, J., 2005. Overview of the ICESat mission. Geophysical Re-search Letters.
Smith, D. E., Zuber, M. T., Frey, H. V., Garvin, J. B., Head, J. W., Muhleman, D. O., Pettengill, G. H., Phillips, R. J., Solomon, S. C., Zwally, H. J. et al., 2001. Mars Orbiter Laser Altimeter: wxperiment summary after the first year of global mapping of Mars. Journal of Geophysical Research: Planets106(E10), pp. 23689–23722.
Smith, D. E., Zuber, M. T., Jackson, G. B., Cavanaugh, J. F., Neumann, G. A., Riris, H., Sun, X., Zellar, R. S., Coltharp, C., Connelly, J. et al., 2010. The lunar orbiter laser altimeter in-vestigation on the lunar reconnaissance orbiter mission.Space Science Reviews150(1), pp. 209–241.
Tan, K., Cheng, X. and Cheng, X., 2016. Modeling hemispher-ical reflectance for natural surfaces based on terrestrial laser scanning backscattered intensity data. Optics Express24(20), pp. 22971–22988.
Vain, A., Yu, X., Kaasalainen, S. and Hyyppa, J., 2010. Correct-ing airborne laser scannCorrect-ing intensity data for automatic gain control effect. IEEE Geoscience and Remote Sensing Letters
Wang, C.-K., Tseng, Y.-H. and Chu, H.-J., 2014. Airborne dual-wavelength LiDAR data for classifying land cover. Remote Sensing6(1), pp. 700–715.
Yan, W. Y. and Shaker, A., 2014. Radiometric correction and normalization of airborne LiDAR intensity data for improving land-cover classification. IEEE Transactions on Geoscience and Remote Sensing52(12), pp. 7658–7673.
Yan, W. Y. and Shaker, A., 2016. Radiometric normalization of overlapping LiDAR intensity data for reduction of striping noise. International Journal of Digital Earth9(7), pp. 649– 661.
Yan, W. Y., Shaker, A. and El-Ashmawy, N., 2015. Urban land cover classification using airborne LiDAR data: a review. Re-mote Sensing of Environment158, pp. 295–310.
Yan, W. Y., Shaker, A., Habib, A. and Kersting, A. P., 2012. Im-proving classification accuracy of airborne lidar intensity data by geometric calibration and radiometric correction. ISPRS Journal of Photogrammetry and Remote Sensing67, pp. 35– 44.
You, H., Wang, T., Skidmore, A. K. and Xing, Y., 2017. Quanti-fying the effects of normalisation of airborne LiDAR intensity on coniferous forest leaf area index estimations.Remote Sens-ing9(2), pp. 163.