OPTICAL AND SAR DATA INTEGRATION FOR AUTOMATIC CHANGE PATTERN
DETECTION
B. Mishra∗, J. Susaki
Department of Civil and Earth Resources Engineering, Kyoto University; Email address: [email protected]; [email protected]
Commission VII, WG VII/5, VII/6
KEY WORDS:Change type detection; data fusion; optical images; SAR images; NDVI; NDR;
ABSTRACT:
Automatic change pattern mapping in urban and sub-urban area is important but challenging due to the diversity of urban land use pattern. With multi-sensor imagery, it is possible to generate multidimensional unique information of Earth surface features that allow developing a relationship between a response of each feature to synthetic aperture radar (SAR) and optical sensors to track the change automatically. Thus, a SAR and optical data integration framework for change detection and a relationship for automatic change pattern detection were developed. It was carried out in three steps: (i) Computation of indicators from SAR and optical images, namely: normalized difference ratio (NDR) from multi-temporal SAR images and the normalized difference vegetation index difference (∆NDVI) from multi-temporal optical images, (ii) computing the change magnitude image from NDR and∆NDVI and delineating the change area and (iii) the development of an empirical relationship, for automatic change pattern detection. The experiment was carried out in an outskirts part of Ho Chi Minh City, one of the fastest growing cities in the world. The empirical relationship between the response of surface feature to optical and SAR imagery has successfully delineated six changed classes in a very complex urban sprawl area that was otherwise impossible with multi-spectral imagery. The improvement of the change detection results by making use of the unique information on both sensors, optical and SAR, is also noticeable with a visual inspection and the kappa index was increased by 0.13 (0.75 to 0.88) in comparison to only optical images.
1. INTRODUCTION
As hundreds of thousands of people are migrating from rural to urban area every year, land cover/use classes in urban and subur-ban areas are changing rapidly and this trend is likely to increase in future. In addition to that, several human interventions such as agricultural practice, deforestation, reforestation, dam construc-tion etc. make a big changes in the Earth‘s surface. Thus, con-tinuous monitoring is very important in several aspects including infrastructure planning and development to environmental moni-toring, etc. Change information detected from the multi-temporal remote sensing images is seemed to be extremely useful (Dierk-ing and Skriver 2002; Hayes and Sader 2001; Liao et al. 2008; Mishra and Susaki 2013; Du et al. 2013). Mainly, optical and radar images have used for change detection independently as well as in a combination with each other or with ancillary dataset. In case of optical image, the normalized difference vegetation in-dex (NDVI) is the major inin-dex while the change in vegetation is a major concern (Lyon et al. 1998; Forkel et al. 2013). However, while considering all kinds of changes the change vector analysis (CVA) with Tesselled cap transformation is one of the most com-mon approaches (Malila 1980) for multi-spectral images. The multi-sensor images, especially optical and SAR images, capture unique signature for each ground feature. Such informa-tion creates new research scope to enhance the change detecinforma-tion and labeling automatically. Accordingly, to use the complemen-tary information from multi-sensor images, several data fusion techniques have already been in practice. Data fusion of multi-sensor optical imagery has been exploited widely. Majority of such fusion techniques is motivated to pan sharpening (Dong et al. 2013; Gangkofner et al. 2008; Amolins et al. 2007; Du et al. 2013; Koutsias et al. 2000).
Even though, SAR and optical image fusion is not widely
ex-∗Corresponding author.
ploited in comparison to the multi-sensor optical images, some good approaches are already in practice. The motivation behind these fusion approaches is also to enhance the spatial resolution by preserving spectral information (Du et al. 2013; Hong et al. 2009). In addition to that, SAR and optical image fusion is driven from better land cover classification or some specific structure detection. Tupin and Roux (2003) have used the SAR and opti-cal data for building outline detection using feature based fusion approach in one of their studies. Their study showed that SAR images are capable to show the building presence and optical im-ages are good for the shape delineation complementary informa-tion about building presence and proper shape extracinforma-tion. They carried out it in two steps: first, extraction of partial potential building footprints on the SAR image and then shape detection in the optical one.
the number of discriminated classes are limited , the CVA is good approach for making using of MS information. Consequently, it could be a very good approach for information fusion that is ob-tained from optical and SAR imagery. It is known that the unique signature of SAR and optical images for each land use/cover fea-ture is stable and site independent, in the similar weather and light condition for optical imagery and same configuration in case of SAR images, it is possible to develop a relationship between them and can deploy for an automatic change pattern detection. In this study, an empirical relationship is developed by using the unique response from major features in the Earth’s surface in SAR and optical imagery and deployed for automatic change pat-tern detection. Before that, a change area is segmented through CVA based SAR and optical information fusion. The fusion is motivated to use the complementary information without losing the inherent information that comes either from SAR or from op-tical images for better change detection. Specifically, it is ex-pected to improve the sharpness of the detected feature, or be able to detect the changed features that were otherwise not possi-ble from a single data source.
The data used in this study are described in Section 2. Section 3 explains about statistical analysis. Section 4 reveals the method-ology followed. The results and discussion is reported in Section 5. Finally the conclusions are presented in Section 6.
2. STUDY AREA AND DATA USED
2.1 Study area
For an experimental purpose, a section of approximately 19×20 km in an outskirts part of the Ho Chi Min City was selected. Fig-ure 1 shows the study area. The major events occurred in the area was constructions, deforestation and smoothing of agricul-tural land that causes the changes on agriculagricul-tural land to bare land (preparation for construction), forest to bare land, bare land or agricultural land to built-up area or under-construction area. These are believed to be the major changes while expanding the urban area all over the world; therefore, study poses a sufficient generality.
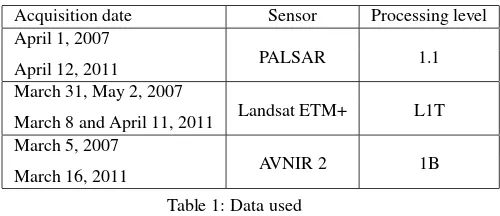
2.2 Data used
HH component of two fully Polarimetric Synthetic Aperture Radar (PolSAR) images acquired by the Advanced Land Observing Satel-lite (ALOS) Phased Array type L-band Synthetic Aperture Radar (PALSAR) in April 2007 and April 2011 were used. Similarly, the Landsat-7 band 3 (Visible Red) and band 4 (Near InfraRed) acquired by the Enhanced Thematic Mapper Plus (ETM+) im-ages nearly the same date as PALSAR imim-ages were considered. Table 1 shows the detail of all images used in this study. Since all images used in this study were acquired on nearly the same time of year (April), all the changes due to agricultural prac-tices were ignored. Additionally, the different intensity of precip-itation may cause the various levels of vegetation growth even in the same season of the year, thus the years (2007 and 2011) with normal precipitation records were selected for the study. Hence, all the phenological changes were also ignored and fo-cused solely on the change due to the human intervention. The results were evaluated based on Advanced Visible and Near In-frared Radiometer type-2 (AVNIR-2) optical data acquired nearly the same time with PALSAR images and a very high-resolution (less than 1 m) QuickBird images in Google Earth.
3. STATISTICAL ANALYSIS
The backscattering coefficients and NDVI value of five major fea-tures (water body, bare land, grassland, forest and building) in the
Figure 1: Study area, false color combination of Landsat image.
Acquisition date Sensor Processing level
April 1, 2007
April 12, 2011 PALSAR 1.1
March 31, May 2, 2007
March 8 and April 11, 2011 Landsat ETM+ L1T March 5, 2007
March 16, 2011 AVNIR 2 1B
Table 1: Data used
Earth’s surface were obtained by taking the average value of the sample obtained manually from the known area. In each fea-ture type, the sample pixels were more than 1000, and assumed that this signature is site independent. Figure 2 (a) represents the NDVI for major five features, and Figure 2(b) represents the backscattering coefficients of HH polarimetric component for the same features.
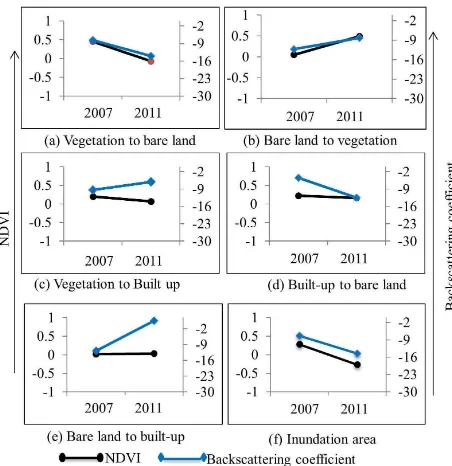
While generalizing these five features, we considered grassland, forest and agricultural land (with crop plantation) as a vegetation area and identified the following possible change types. Inunda-tion (vegetaInunda-tion, built-up or bare land to water bodies) and vice versa (water body to vegetation, built-up or bare land), bare land to vegetation and vice versa, bare-land to built-up and vice versa, vegetation to built-up and vice versa. Statistical analysis has been done for NDVI and SAR backscattering responses in earlier and later imagery for the above-mentioned possible change types and presented in Figure 3. Some change types are equally sensitive to the SAR and optical sensors e.g. vegetation to bare-land and vice versa, some have reverse effect such as: vegetation to built-up and vice versa and some are sensitive to one sensor whereas not in another, such as building construction in a bare land or building to bare land change. Similarly, some greenery appears in grassland or pastureland is not sensitive in some SAR sensor with relatively longer wavelength. Therefore, the complemen-tary information available in multi-sensor images paves the way for further analysis.
4. METHOD
Figure 2: NDVI and SAR backscattering coefficient for major land use classes, (a) NDVI, (b) backscattering coefficient.
Figure 3: The backscattering coefficient and NDVI in pre and post image with several land cover change classes.
in Figure 4. Details of the methodology are presented in the fol-lowing sections.
4.1 Preprocessing
4.1.1 Calibration and gap filling for Landsat data: The Land-sat L1T image has been used in this study. Atmospheric correc-tion was done using ENVI 5.0 in which the raw digital number (DN) values were converted into surface reflectance. The cali-brated images were then subjected for filling gaps (Scaramuzza et al. 2004). The image acquired in March 31, 2007 and April 11, 2011 were the main considered image and dated on May 2, 2007 was used for filling gaps in March 31, 2007 and image acquired on March 8, 2011 was used to fill the gap in the image acquired in April 11, 2011.
4.1.2 PALSAR images - geometric correction and coregis-tration: All images were geometrically corrected using 30 m ASTER Global Digital Elevation Model (GDEM) using ASF Map-Ready 3.2. The images were geo-coded with Universal Trans-verse Mercator (UTM) system and co-registered with Landsat imageries with 19 ground control points selected manually in ENVI 5.0, where the overall error was less than a single pixel. The nearest neighbors re-sampling was used at this stage.
Figure 4: Process flow diagrams.
4.2 Derivation of change from different sensor images
4.2.1 Normalized difference ratio from SAR images: A nor-malized form of ratio, nornor-malized difference ratio (NDR), oper-ator is used to generate the change image from multi-temporal SAR images. The NDR operator generates pixel value from -1 to +1. All no-change pixels are clustered around 0, while all the change pixels are deviated far from 0. The NDR operator (Mishra and Susaki 2013) is defined as Equation (1).
N DR(t1, t2) =
At2−At1
At2+At1
(1)
where,At1 andAt2 are amplitudes of co-registered images
ac-quired on two datest1andt2, respectively.
4.2.2 NDVI difference (∆N DV I) image: The NDVI gives the vegetation greenness, and thus it is very useful to study the surface dynamics. NDVI at datetfor Landsat TM/ETM+ is de-fined as Equation (2)
N DV I(t) =ρ4,t−ρ3,t
ρ4,t+ρ3,t
(2)
whereρ3andρ4are reflectance of TM/ETM+ band 3 and 4, re-spectively. The difference of NDVI,∆NDVI, is derived by Equa-tion (3):
4.3 Fusion of NDR and∆NDVI for change detection As discussed in Section 3 some changes are sensitive to both sen-sors however, others are sensitive in only one. Therefore, they have some complementary information, which are important for full dimensional change detection. We devise two different data fusion techniques in order to make use of complementary infor-mation that can capture all changes.
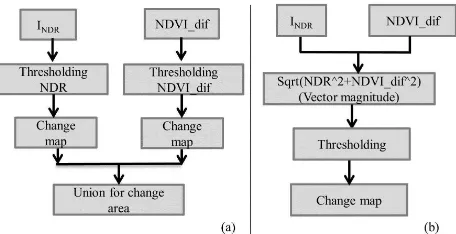
4.3.1 Decision level fusion: Decision level fusion is common for multi-sensor image fusion, specifically in SAR and optical imagery and motivated from classification. In this study, we have developed a change map through thresholding of both change im-ages independently, namely NDR image, that was derived from two multi-temporal SAR amplitude images from Equation (1), and∆NDVI image, derived from two multi-temporal NDVI im-age generated from the Equation (3). Union of the detected changed area was carried out to get the final change map. The Figure 5. (a) represents the procedure for the change detection process using decision level fusion.
4.3.2 Change vector analysis (CVA): Change vector analy-sis is a well-established change detection method for multi-spectral images (Malila, 1980; Johnson and Kasischke, 1998). Even though the CVA is well-accepted methodology for multi-spectral images, it is new for optical and SAR integration.
For all land cover/use status, we assume that the quantity of land cover/use status in optical and SAR response, (f), can be ex-pressed as follows:
f=f(N, B) (4)
whereNdenotesN DV Iobtained from optical sensor andB de-notes backscatter from SAR, respectively. When we take a par-tial derivative of Equation (4) with respect tot, Equation (5) is derived:
AssumingN andBare independent to each other, amplitude of the change,A, can be written as:
A=
Now, we assumefas a simple linear function in Equation (7)
f=a1N+a2B+a3 (7)
Equation (6) can be rewritten as Equation (8):
A≈ Then, Equation (9) can be rewritten in the form of∆N DV Iand NDR as follows:
A=p∆N DV I2+ N DR2
(10)
Equation (10) represents a change magnitude from both optical and SAR images. A threshold value in this image was identified with manual trial and error procedure that can segment change and no-change area. The overall procedure is presented in 5 (b).
Figure 5: SAR and optical information fusion procedure, (a) De-cision level fusion and (b) CVA based fusion.
4.4 Automatic change labelling
In order to detect the change area in NDR image or in∆NDVI image, two threshold values are necessary. These threshold val-ues segmented the change image into three classes, namely: in-crease backscattering area, dein-crease backscattering area and no-change in case of SAR images, and increase, decrease and no change in NDVI for∆NDVI. While combining these two change images with associated threshold values; we get 9 zones as shown in Figure 6. All of these nine zones represent a unique change type, thus, a relationship between∆NDVI and NDR is possible to develop that allows to detect the change pattern automatically. Based on the responses of different change features in SAR and optical sensor presented in Figure 3 and the scatter diagram in Figure 6, a relationship between NDR and∆NDVI was devel-oped. The developed relationship, their associated position in the ∆NDVI vs. NDR plane along with the possible change types are presented in Table 2. As the NDVI and the backscattering inten-sity for all major land cover features are known and assumed to be stable and independent to the locations, the developed rela-tionship is believed to be valid all over the World.
4.5 Accuracy assessment
The effectiveness of the proposed fusion method was evaluated with visual analysis, and quantitative capability. A visual com-parison of the change image generated from different sensors and proposed fusion techniques and corresponding change map was done for the selected change sites, this gave the overall idea of the effectiveness of the generated change images. In addition to
Observation
NDR NDVI Zone Change type Example
Increase Increase I Bare land to vegetation Bare land to forest, or pasture land or agriculture etc. Increase No change II Bare land to build-up Bare land to building
Increase Decrease III Vegetation to built-up Pastureland, agriculture or forest to built-up No change Increase VIII Increased greenness Pastureland getting seasonal greenery No change No change Center No - change No-Change
No change Decrease IV Decreased greenness Pastureland getting dry
Decrease Decrease V Vegetation to bare land Deforestation, crop harvesting, inundation Decrease No change VI Built-up to bare land Building collapse
Decrease Increase VII Built-up to vegetation Building to forest, or other vegetation, agriculture land etc.
Table 2: Relationship between NDR and∆NDVI with land use/cover change type, and associated zones in∆NDVI vs. NDR plane. that, the change detection map obtained from proposed
method-ology was evaluated with the change map obtained from the high-resolution AVNIR images and very high-high-resolution images from Google Earth interactively in selected areas.
In order to evaluate the results quantitatively, confusion matrix was used. This allocates the change and no change class and its expected value is derived using those in a corresponding ground reference data set. The confusion matrix allows deriving numer-ous summary measures of the accuracy of the allocated classes and amount of change that has occurred. The considered accu-racy measures are user‘s accuaccu-racy, producer‘s accuaccu-racy, error of omission, error of commission, overall accuracy and kappa index (Foody 2010).
5. RESULTS AND DISCUSSION
5.1 Change detection
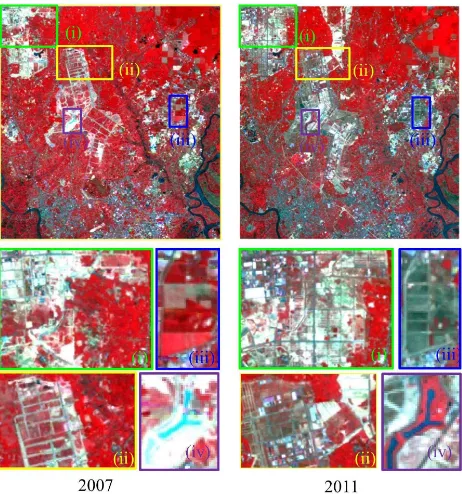
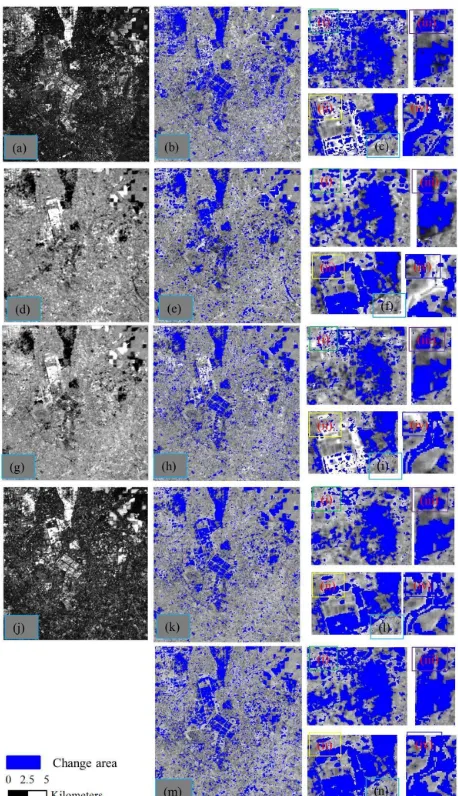
The change map was generated through the proposed fusion tech-niques. The obtained results were compared with the results ob-tained from∆NDVI, NDR and widely used multi-spectral change vector analysis (CVA) for Landsat imagery (Malila 1980; Jhn-son and Kasischke 1998). Threshold values for each of the input change images was obtained with MTEP and implemented in an ENVI 5.0 that segmented the changed area from no-change area. For the visual analysis, a false color composite of Landsat im-agery was used. Figure 7 represents the false color composite of Landsat imageries in (a) 2007 and (b) 2011 and (c) and (d) are the interested zoom-in sites corresponding to the images acquired on 2007 and 2011 respectively. These figures and interested zoom-in sites were considered as a ground truth and the results obtained from each input change image were compared with a simple vi-sual inspection.
Figure 8 illustrates the change image, corresponding change map and zoom-in change map in interested sites corresponding to the interested sites in Figure 7 for all input datasets. Figure 8 (a) (c) represents the change vector magnitude (CVM) from tasseled cap transformation of Landsat-7 ETM+, corresponding change map and zoom-in map of the interested areas, similarly Figure 8 (d) (f) are for the NDVI, Figure 8 (g) (i) are for the NDR, Figure 8 (j) (l) for proposed CVM generated from∆NDVI and NDR and Figure 8 (m) (n) are for the union of change map obtained from
Input data set Over all accuracy Kappa coefficient
∆NDVI 88.23 0.73
NDR 89.13 0.74
CVA - MS image 90.36 0.75
NDVI∪NDR 85.69 0.69
CVA - NDVI, NDR 94.7 0.88
Table 3: Change detection accuracy assessments for several ap-proaches.
Figure 7: Study area false color combination 2007 and 2011, (i) site 1, (ii) site-2, (iii) site 3 and (iv) site 4.
∆NDVI and NDR.
While comparing the grayscale change image in Figure 8 (a), (d), (g) and (j), some images are better than others even though all of them are in the same spatial resolution. ∆NDVI (Figure 8 (d)) and NDR (Figure 8 (g)) appear to be smoother than other two, however, NDR images are not as smooth to ∆NDVI. In these images, bright and dark colors represent the change areas whereas the moderately gray area is for no-change. Regarding the change images obtained from the CVM using Tessalled cap transformation (Figure 8 (a)) and CVM using∆NDVI and NDR (Figure 8 (j)), both appear to be more contrast between change and no-change area. In these images, the bright color represents the change area and dark color represents no-change area.
consider-Figure 8: Change map obtained from different input datasets and corresponding zoom-in map for selected sites, (a) - (c) CVA with Tasseled cap transformation, (d) - (f) NDR, (g) - (i)∆NDVI, (j) (l) CVA –∆NDVI and NDR, and (m) (n) union of NDR and ∆NDVI.
ation of all commission error from both sensors. In contrast to that, the NDR and NDVI integration using CVA approach is bet-ter. See in site (iv) the overestimation seen in water body while using optical imagery was reduced and the site (ii) is also rea-sonably better in comparison to NDR and optical imagery. The commission error in SAR is reduced in site (ii) and omission er-ror in site (iv).
Table 3 summarizes the accuracy assessment done in this study. The Kappa index is improved by 0.16 and 0.17 while using the proposed CVA based fusion approach in comparison to the NDR image, and∆NDVI respectively. It is improved by 0.13 while comparing the CVA in Landsat imageries with significant decre-ments in false and missing alarm.
In general, the SAR image can detect almost all kinds of changes except the small changes that do not make much differences in the surface roughness, e.g. small vegetation; however, the per-formance improvement is significant. This is because the results obtained from the SAR image have lack of clear boundary line in most of the detected sites. This limitation can easily be overcome
by using SAR and optical image fusion operation. In addition to that, several changes related to urban extensions are not sensitive to greenness and brightness for example bare land to built-up area and some vegetation changes such as forest to bush or grassland could not be detected properly in optical images. Similarly, some water body with different level of turbidity is also appearing as changed in the tasseled cap transformation. As a result, the false change is appeared in the generated change map. Additionally, building structure in bare land that does not alter the greenness, wetness and brightness significantly is not possible to detect. All of these errors of commissions and omissions can be reduced con-siderably while implementing the CVA technique with NDR and ∆NDVI.
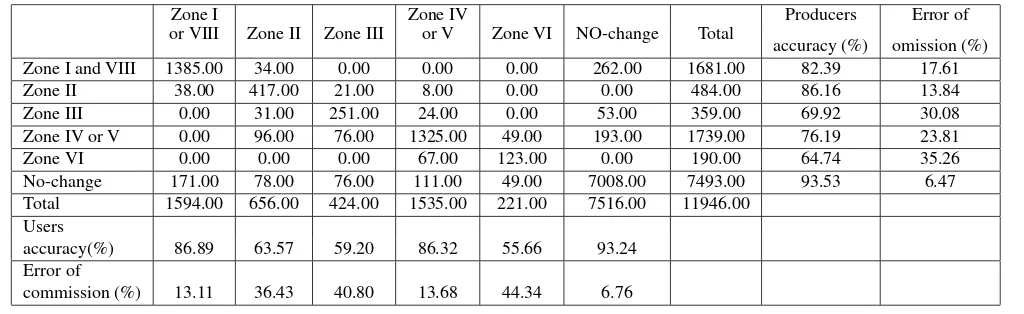
5.2 Automatic multi-class change labelling
The change map developed through the CVA based SAR and optical information fusion approach was subjected to automatic change labeling. The results obtained from the relationship pre-sented in Table 2 suggested that the increase or decrease in NDVI without altering NDR is very rare. Those changes, which do not alter the surface roughness significantly, such as bare land to pas-ture land or grassland and vice versa, which are characterized as increased or decreased vegetation are shown in Figure 9; this in-cludes the boundary line of the change areas, mainly due to the changes in vegetation. Here, two examples are presented, (i) site 1, that is decrease in NDVI smoothing of some agricultural area that is associated with decrease in vegetation area (Zone VIII in Figure 2) and (ii) increase NDVI area, growth of small vegeta-tion/greenness, that is associated with increase vegetation area (Zone IV as in Figure 6). Thus, these zones were merged with as-sociated zones i.e. (Zone VIII to Zone I and Zone IV to Zone V as in Figure 6).Now we have six change classes and one no-change class as with the generalized relationship presented in Table 4.
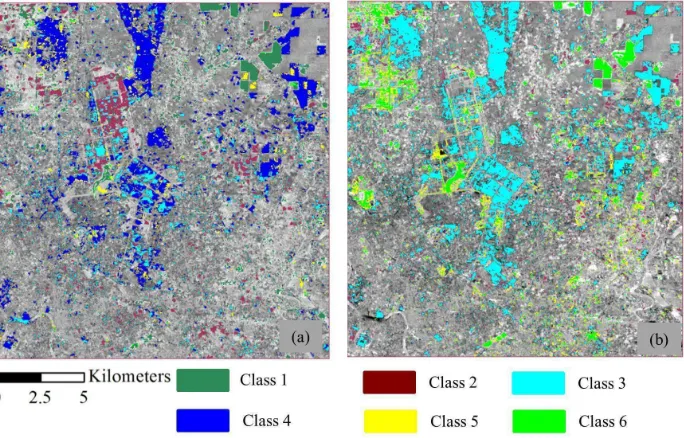
In order to compare the results of the proposed change label-ing approach with optical and SAR information, an automatic labeling with optical imageries using tasseled cap transformation brightness and greenness index (Malila 1980; Johnson and Ka-sischke 1998) was implemented. The Figure 10 (a) is the change labeling map using the proposed optical and SAR information fusion and Figure 10 (b) is the change labeling map obtained us-ing the optical imagery only. While interpretus-ing the resulted map visually, all the area classified as class 2, class 3 and class 4 (veg-etation or bare land to built-up and decrease veg(veg-etation area ac-cording to the relationship in Table 4) were classified in a single class 3 (decrease NDVI and increase brightness) in the optical im-agery based on the brightness and greenness index obtained from the Tasseled cap transformation in Landsat 7 images. These are the major change classes in the urban extension; therefore, the change labeling using the optical information in an urban infor-mation is suffering from a poor performance. Such misclassifica-tion obtained while implementing the brightness and greenness
Response Class
NDR NDVI Change type
Increase Decrease Class 1
No change Increase Increase vegetation Class 2 Increase No change Bare land to built-up Class 3 Increase Decrease Vegetation to built-up
No change Decrease Class 4
Decrease Decrease Vegetation to bare land Class 5 Decrease No change Built-up to bare land Class 6 Decrease Increase Built-up to vegetation
Figure 9: Change area with no-change in NDR, (a) reference image in 2007, (b) reference image in 2011 and (c) change map with the change that is not sensitive to SAR backscattering (NDR) and interested zoom-in sites.
Zone I Zone IV Producers Error of
or VIII Zone II Zone III or V Zone VI NO-change Total
accuracy (%) omission (%)
Zone I and VIII 1385.00 34.00 0.00 0.00 0.00 262.00 1681.00 82.39 17.61
Zone II 38.00 417.00 21.00 8.00 0.00 0.00 484.00 86.16 13.84
Zone III 0.00 31.00 251.00 24.00 0.00 53.00 359.00 69.92 30.08
Zone IV or V 0.00 96.00 76.00 1325.00 49.00 193.00 1739.00 76.19 23.81
Zone VI 0.00 0.00 0.00 67.00 123.00 0.00 190.00 64.74 35.26
No-change 171.00 78.00 76.00 111.00 49.00 7008.00 7493.00 93.53 6.47
Total 1594.00 656.00 424.00 1535.00 221.00 7516.00 11946.00
Users
accuracy(%) 86.89 63.57 59.20 86.32 55.66 93.24
Error of
commission (%) 13.11 36.43 40.80 13.68 44.34 6.76
Table 5: Confusion matrix for automatic change labeling in CVA - NDR and∆NDVI. index is due to the lack of enough information in considered
in-dex. These indexes are highly correlated negatively (-0.8). i.e. decrease in the greenness increases the brightness. On the other hand, the NDR and∆NDVI are linearly independent (0.33), thus, they can have more combinations of classes and poses to discrim-inate several classes successfully.
Regarding the other combinations of optical imagery derived in-dices such as brightness vs. wetness or greenness vs. wetness, all are linearly dependent to each other and they have a very good positive or negative correlation coefficient. Add to all, only the optical imagery does not provide enough information for discrim-inating several classes automatically. Thus, a quantitative accu-racy assessment is not done for the automatic change type la-beling using optical imageries. Table 5 illustrates the accuracy assessment of the change labeling using NDR and∆NDVI. The obtained overall accuracy is 87.97% and the Kappa index is 0.78. The results obtained from optical imagerys are better in several aspects, like shape delineation or tracking vegetation dynamics and many others, but, several changes, including bare land to ur-ban extension or forest to agricultural or bushes or pastureland changes are not detected properly. In contrast to that SAR image derived index, NDR, is very good to locate such changes. Yes, SAR images are not good at delineating the proper shape of the changed objects and do not detect these objects, which do not alter the surface roughness significantly, such as bare land to pas-tureland or grassland. The combined use of the SAR and optical images would be very effective to detect the change area .
6. CONCLUSIONS
With the availability of multi-sensor data, a multi-sources data processing and analysis technique is required to capture all changes.
The CVA technique for information fusion proved its capability of fulfilling their requirement for change detection. Given a huge potential of multi-source data, continue expansion of the quantity of diverse sensor types of remote sensing data, CVA might pro-vide a capability of fusion of increasing demand of multi-source information for full-fledged change detection and a relationship among the responses of the Earth surface feature’s to these sen-sors would provide a broader-dimension of change type detec-tion. In addition to the change detection in a very complex urban sprawl area, an automatic multi-class change detection with an empirical relationship between the response of surface feature to optical and SAR imagery has shown to be effective. By further analyzing the response of each change feature to optical and SAR imagery or using ancillary dataset, this method can be further ex-tended for disaster monitoring, crop monitoring, etc. In addition to that, an automatic adaptive thresholding would enhance the re-sults by protecting from the human biases and error and make the system fully automatic.
ACKNOWLEDGEMENTS
This research was supported in part by a program of the 4th ALSO-2 research announcement of the Japan Aerospace Explo-ration Agency (JAXA).
REFERENCES
Amolins, K., Zhang, Y. and Dare, P., 2007. Wavelet based im-age fusion techniques An introduction, review and comparison.
Figure 10: Change map with change type labeling, (a) CVA with NDR and∆NDVI, (b) CVA with brightness and greenness obtained from tasseled cap transformation in Landsat images.
Dierking, W. and Skriver, H., 2002. Change detection for the-matic mapping by means of airborne multitemporal polarimetric SAR imagery. IEEE Transactions on Geoscience and Remote Sensing, 40(3), pp.618 - 636.
Dong, Z. et al., 2013. SPOT5 multi-spectral (MS) and panchro-matic (PAN) image fusion using an improved wavelet method based on local algorithm.Computers and Geosciences, 60, pp.134 - 141.
Du, P. et al., 2012. Fusion of Difference Images for Change De-tection Over Urban Areas. IEEE Journal of Selected Topics in Applied Earth Observations and Remote Sensing, 5(4), pp.1076-1086.
Du, P. et al., 2013. Information fusion techniques for change de-tection from multi-temporal remote sensing images.Information Fusion, 14(1), pp.19-27.
Foody, G.M., 2010. Assessing the accuracy of land cover change with imperfect ground reference data. Remote Sensing of Envi-ronment, 114(10), pp.2271-2285.
Forkel, M. et al.,2013. Trend Change Detection in NDVI Time Series: Effects of Inter-Annual Variability and Methodology.Remote Sensing, 5(5), 2113-2144.
Gangkofner, U.G., Pradhan, P.S. and Holcomb, D.W., 2008. Op-timizing the High-Pass Filter Addition Technique for Image Fu-sion.Photogrammetric Engineering and Remote Sensing, 74(9), pp.1107-1118.
Hayes, D.J. and Sader, S.A., 2001. Comparison of ChangeDe-tection Techniques for Monitoring Tropical Forest Clearing and Vegetation Regrowth in a Time Series. Photogrammetric Engi-neering and Remote Sensing, 67(9), pp.1067-1075.
Hong, G. et al., 2014. Integration of optical and synthetic aper-ture radar (SAR) images to differentiate grassland and alfalfa in Prairie area.International Journal of Applied Earth Observation and Geoinformation, 28, pp.12-19.
Hong, G., Zhang, Y. and Mercer, B., 2009. A Wavelet and IHS Integration Method to Fuse High Resolution SAR with Moderate Resolution Multispectral Images.Photogrammetric Engineering and Remote Sensing, 75(10), pp.1213-1223.
Johnson, R.D. and Kasischke, E.S., 1998. Change vector analy-sis: A technique for the multispectral monitoring of land cover and condition. International Journal of Remote Sensing, 19(3), pp.411-426.
Koutsias, N., Karteris, M. and Chuvieco, E., 2000. The Use of Intensity-Hue-Saturation Transformation of Landsat-5 Thematic Mapper Data for Burned Land Mapping.Photogrammetric Engi-neering and Remote Sensing, 66(7), pp.829-839.
Liao, M. et al., 2008. Urban Change Detection Based on Coher-ence and Intensity Characteristics of SAR Imagery. Photogram-metric Engineering and Remote Sensing, 74(8), pp.999-1006.
Lyon, J. G.et al., 1998. A Change Detection Experiment Using Vegetation Indices. Photogrammetric Engineering and Remote Sensing, 64(2),pp.143-150.
Malila, W.A., 1980. Change Vector Analysis: An Approach for Detecting Forest Changes with Landsat. LARS Symposia, 326-335.
Mishra, B. and Susaki, J., 2013. Coupling of thresholding and region growing algorithm for change detection in SAR images.
Progress In Electromagnetics Research, 143, pp.519-544.
Scaramuzza, P., Micijevic, E. and Chander, G., 2004. SLC Gap-Filled Products Phase One Methodology.Available from http://land sat.usgs.gov/documents/SLC Gap Fill Methodology.pdf, pp.1- 5.