UNIVERSITI TEKNIKAL MALAYSIA MELAKA
DOE Based Modeling In Machining
Application
Thesis submitted in accordance with the requirements of the Technical University of Malaysia Melaka for the Bachelor Degree of Manufacturing
Engineering in Manufacturing Process
By
Mohd Ridzuan Bin Mustapha
DOE BASED MODELING IN MACHINING APPLICATION
MOHD RIDZUAN BIN MUSTAPHA
APPROVAL
This thesis submitted to the senate of UTeM and has been accepted as partial fulfillment of the requirements for the degree of Bachelor of Manufacturing Engineering
(Manufacturing Process). The members of the supervisory committee are as follow:
Signature : ……… Supervisor : MR. SIVARAO
Date : 9TH MAY 2007
ABSTRACT
ABSTRAK
ACKNOWLEDGEMENT
TABLE OF CONTENTS
LIST OF ABBREVIATIONS, SYMBOLS AND NOMENCLATURES ... xi
CHAPTER 1 ... 1
3.1 Key Terminology in Experimental Design ... 20
3.1.1 Set Good Objectives ... 20
3.1.2 Measure Responses Quantitatively ... 21
3.1.3 Replicate to Dampen Uncontrollable Variation (Noise) ... 21
3.1.4 Randomize the Run Order ... 21
3.1.5 Block out Known Sources of Variation ... 22
3.1.6 Know Which Effects will be Discard ... 22
3.1.7 Do a Sequential Series of Experiments ... 22
3.1.8 Confirm Critical Findings ... 22
3.2 Experimental Design Setup ... 23
3.2.2 Machining Parameter and Specification ... 25
3.3 Planning and Experimentation ... 26
3.3.1 Regression Statistical Techniques ... 26
3.3.2 Experimentation Consideration ... 28
3.3.3 Introduction to Experimentation ... 28
3.3.4 Determination of Significant Parameters ... 32
3.3.5 Analyzing the DOE ... 34
3.4 Experimental Design Procedure ... 36
CHAPTER 4 ... 39
EXPERIMENTAL WORK AND PROCEDURE ... 39
4.1 Experimental Setup ... 39
4.2 Process Planning ... 41
4.3 Create Design of Experiment ... 42
4.4 Machine Selection ... 44
4.5 Laser Cutting Programming ... 45
4.6 Material Selection ... 47
4.7 Material Preparation ... 49
4.8 Machine Setup and Experimental Procedure ... 50
4.9 Laser Cutting Process ... 52
4.10 Surface Roughness Measurement ... 53
4.10.1 Surface Roughness Measuring Equipment ... 54
4.10.2 Measurement Procedures ... 55
CHAPTER 5 ... 57
RESULT AND ANALYSIS ... 57
5.1 Surface Roughness ... 57
5.2 Design of Experiment Model ... 61
5.2.1 5 mm Thickness ... 62
5.2.2 2.5 mm Thickness ... 73
CHAPTER 6 ... 86
DISCUSSION ... 86
6.2 Design of Experiment Model ... 88
CHAPTER 7 ... 95
CONCLUSION & RECOMMENDATIONS ... 95
REFERENCES ... 98
APPENDIXES ... 104
APPENDIXES A: 5mm Thickness Programming ... 104
APPENDIXES B: Helius Laser Cutting Machine Standard ... 107
LIST OF TABLES
Table 1: Process parameters employed during pulsed Nd:YAG laser cutting
experiments………..19
Table 2: Number of Runs for 2-Level Factorial as a Function of Signal to Noise….21 Table 3: List of Machining Parameters……….26
Table 4: Designs of Interactions……….33
Table 5: Design Matrix Method………..34
Table 6: 2kExperiments ………...………...36
Table 7: Laser cutting parameters and their levels for factorial analysis………….40
Table 8: Full Factorial Design for Mild Steel 5mm with Response Data…….….….58
Table 9: Full Factorial Design for Mild Steel 2. 5mm with Response Data………..59
Table 10: 2-level Factorial Design for 5mm Material Thickness………….………...62
Table 11: Balanced ANOVA Result for 5mm Material Thickness……..…….……....71
Table 12: R-Squared- Relative Significant for 5mm Material Thickness………71
Table 13: DOE Analysis Result……….…...73
Table 14: 2-level Factorial Design for 2.5mm Material Thickness……….74
Table 15: Balanced ANOVA for Result for 2.5mm Material Thickness……..………83
Table 16: R-Squared – Relative Significance for 2.5mm Material Thickness……...84
Table 17: DOE Analysis Result………..………86
Table 18: Analysis of Variance for Ra(5mm)….……….91
Table 19: Factorial Fit To Develop Mathematical Equation (5mm)………...92
Table 20: Analysis of Variance for Ra(2.5mm)………..……93
Table 21: Factorial Fit To Develop Mathematical Equation (2.5mm)………..94
LIST OF FIGURES
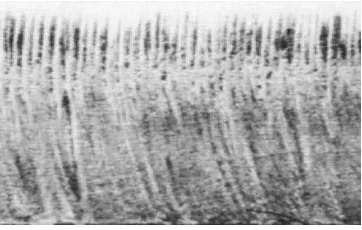
Figure 1: A typical cut edge mild steel showing the periodical striatio…….…………8
Figure 2: Single element showing absorption model...……….13
Figure 3. Schematic representation of laser cut specimen profile. (1) Kerf; (2) work-piece; (3) laser-cut edge……….18
Figure 4: Pattern of Residual Evaluation – Straight Band……..………...26
Figure 5: Pattern of Residual Evaluation – Funnel………..27
Figure 6: Pattern of Residual Evaluation – Quadratic………..…….….27
Figure 7: Pattern of Residual Evaluation – Double Bow………...….……27
Figure 8: Model of X Variable……….….…28
Figure 9: Experimental Map Level………..….29
Figure 10: Order Value Effect………32
Figure 11: Experimenting Using Minitab Software………...33
Figure 12: ANOVA Method Analysis From Minitab Worksheet..………...35
Figure 13: R-Squared Source……….36
Figure 14: Sequential Approach for Design Optimization………..37
Figure 15: Schematic view of experimental set-up………40
Figure 16: Process Planning For Experimentation………..41
Figure 17: Helius 2513, Hybrid Laser Cutting Machine………....44
Figure 18: Flat Plate Mild Steel………...48
Figure 19: Process Flow of Material Preparation before Experimentation…………49
Figure 20: Testing Process………50
Figure 21: Process Flow for Machine Setup and Experimental Procedure………....50
Figure 22: Machine Setup……….51
Figure 23: Drawing For Laser Cutting Experimental Work………..51
Figure 24: Start Cutting……….…………52
Figure 25: Spark exist during cutting……….……….52
Figure 27: End of cutting process………52
Figure 28: Marking process during cutting………52
Figure 29: Portable Surface Roughness Tester, SJ-301………..54
Figure 30: Portable Surface Roughness with it Principles……….55
Figure 31: Calibration process……….………55
Figure 32: Print out of the surface roughness value………56
Figure 33: Surface Roughness Measuring Process……….……….56
Figure 34:The stylus touch the surface of work piece after machined with laser Cutting………57
Figure 35: Graph of Surface Roughness, Ra versus Run Order for Mild Steel 5mm Design Experiment………...…58
Figure 36: Graph of Surface Roughness, Ra versus Run Order for Mild Steel 2.5mm Design Experiment………..60
Figure 37: Pareto Chart of the Effect for 5mm thickness……….……...63
Figure 38: Normal Probability Plot of the Effects for 5mm Thickness………….…....64
Figure 39: Normal Probability Plot of the Standardized Effects for the 5mm Thickness………...65
Figure 40: Pareto Chart of the Standardized Effects for 5mm Thickness……….…..66
Figure 41: Main Effects Plot for Ra of 5mm Material Thickness……….…….67
Figure 42 Main Effects Plot for Ra of 5mm Material Thickness After Reduced Model……….….…..67
Figure 43: Interaction Plot (data means) for Ra of 5mm Material Thickness…...68
Figure 44: Interaction Plot (data means) for Ra of 5mm Material Thickness After Reduced Model……….…69
Figure 45: Cube Plot (data means) for Ra of 5mm Material Thickness………….…70
Figure 46: Cube Plot (data means) for Ra of 5mm Material Thickness After Reduced Model……….………….….70
Figure 47: Residual Plot for Ra of 5mm Material Thickness………...….…...72
Figure 48: Pareto Chart of the Effect for 2.5mm thickness………...…...75
Figure 49: Normal Probability Plot of the Effects for 2.5mm Thickness…………..76
Figure 51: Pareto Chart of the Standardized Effects for 2.5mm Thickness….……...78
Figure 52: Main Effects Plot for Ra of 2.5mm Material Thickness……….……...…..79
Figure 53: Main Effects Plot for Ra of 2.5mm Material Thickness After
Reduced Model……….…………...…79
Figure 54: Interaction Plot (data means) for Ra of 2.5mm Material
Thickness……….….80
Figure 55: Interaction Plot (data means) for Ra of 2.5mm Material
Thickness After Reduced Model……….………….….81
Figure 56: Cube Plot (data means) for Ra of 2.5mm Material Thickness………...82
Figure 57: Cube Plot (data means) for Ra of 2.5mm Material Thickness
After Reduced Model……….………….…...82
LIST OF ABBREVIATIONS, SYMBOLS AND
DPSSL - Diode pumped solid-state laser
F.D. - Focal Distance
HAZ - Heat Affected Zone
Hz - Pulse frequency
J - Pulse energy
J/cm2 - Laser energy over area
KPIV’s - Key Performance Input Variables KPOV’s - Key Performance Output Variables mm/s - Cutting speed
R-Squared - Relative Significance
CHAPTER 1
INTRODUCTION
1.1 Background of the Project
Nowadays, experimental design has been so familiar where it had been practically being applied in the big company and factory worldwide. It had been successfully brought rapid improvement to the process that goes through this implementation. There are some method of experimentation which it were consist of two kinds where how most people do experiment and how the expertise one doing. If the experimental was well-designed, it can eliminate all possible causes except the one’s that been tested. To relate the operating variables and characteristics of the laser to the parameters affecting the cut quality, many models have been developed over the years for the laser cutting process. Modeling provides considerable insight into the interaction mechanisms.
1.2 Problem Statement
Every industry inserted in the production chain aims a continuum enhancement on their processes control and also on their products development. The factors such as quality, reliability and costs reduction are important motivations for the operational excellence achievement serving also to generate competitive items in the global scenario. Consequently, these factors may be the basis of choosing the laser processing replacing the conventional methods. This procedure includes several segments in different areas where the laser is focused by the main industrial applications such as cutting, drilling, welding, thermal treatment and marking.
The applications for the laser material processing involves mechanisms on which it becomes necessary to adequate the type of material and its geometrical shape to the laser type (which is determined by the wavelength and the continuous or pulsed operation mode). From this selection it is also necessary to choose and set the various process parameters that influence on the final result quality, cost and speed, among others factors. This technology stimulates major interest due to the fact that it joins various advantages such as: non contact process and no tool wear, possibility of using a controlled atmosphere, high energy density, flexibility on the beam delivering, simplicity in fixation, easy automation, small heat affected zone, high speed, excellent edge quality.
Laser cutting is probably the most widely used laser processing technology. There are still many problems that are not well-understood in laser cutting. Besides, laser cutting machine cost is highly in the market now because of its components and part that difficult to built. Although by using laser cutting machine, it can produce good quality product with faster machining process and this advantages make the requirement of it in manufacturing field increase. But, there still some weakness of using this machine where because of it’s high cost, the maintenance of this machine also too high.
In this machine there are some common components or parameters that are always being used during the part producing. All of these machine parameters are contribute and will influence the quality of the product that being produced. But, the levels of influence for each parameter are different which there are some parameters that greatly influence the output or quality of product which significant to the process. There is also some machining parameters that only have small influence to the machining process and quality of the product where if these parameters are neglect the quality of the product is not much influence by it. In this condition, if there is no contribution of parameters it can be state as some machining waste because the using of this parameters cost much in the machining process. So, the parameters can be cut away from the machining process to avoid this waste.
1.3 Project Objective
The specific objectives for Design of Experiment Based Modeling in Machining Application for this project are:
i.) To investigate the capabilities of laser cutting machine parameter to obtain a good quality cutting.
ii.) To study about the experimental method and it function for machine application.
iii.)To study the significant factors of machining parameter in developing improvement for machining process.
1.4 Project Scope
We are concerned with the analysis of data generated from an experiment. It is wise to take time and effort to organize the experiment properly to ensure that the right type of data, and enough of it, is available to answer the questions of interest as clearly and efficiently as possible. This process is one type of experimentation which called experimental design. There are many types of experimental design that are commonly used and in these study it focused on the Design of Experiment type which are highly prove that produce accurate determination of the process analysis improvement.
Nowadays, many company and factory that involve in manufacturing field have applied this experimentation method in their process improvement methodology which is expand by Toyota company that got above 30% profit per year by reduction cost of their process improvement. This method is applied in all field and part. Mostly many improvements that have been implemented are in manufacturing field and process which involve the improvement for machine, workers, systems and others. In this study, the experimental design was focused on machining application and the machine that involve is laser cutting machine.
distinguish by flavor alone whether the milk or the tea was first placed in the cup. While this sounds like a frivolous application, it allowed him to illustrate the most important means of experimental design:
• Randomization - The process of making something random
• Replication - repeating the creation of a phenomenon, so that the variability associated with the phenomenon can be estimated
• Blocking - the arranging of experimental units in groups (blocks) which are similar to one another
• Orthogonally - Means perpendicular, at right angles or statistically normal.
• use of factorial experiments instead of the one-factor-at-a-time method
Analysis of the design of experiments was built on the foundation of the analysis of variance, a collection of models in which the observed variance is partitioned into components due to different factors which are estimated and/or tested. In 1950, Gertrude Mary Cox and William Cochran published the book Experimental Design which became the major reference work on the design of experiments for statisticians for years afterwards. Developments of the theory of linear models have encompassed and surpassed the cases that concerned early writers. As with all other branches of statistics, there is both classical and Bayesian experimental design that are provided.
CHAPTER 2
LITERATURE REVIEW
The objective of experimental design is to provide the researcher or a practitioner with a statistical method that determined which input variables are most influential on the output and where to set the influential input variables so that the output is either maximized, minimized or nearest to a desired target value. The design of experiment approach can be applied to the objectives that are as follows; smallest-is-the-best, larger-is-the-best or nominal-is-the-best. One of the essential ideas underlying a designed experiment is that some methods of collecting input and output data are more powerful that others. The method of analyzing one input variable at a time, while holding the others fixed, turns out to be the least effective design. In a statistically designed experiment, the practitioner is able to change the much needed and often desired multiple variables to determine the impact of the response.
Though the design of experiment concepts has long been used in the sciences, industry has not caught on with these methods since their introduction in 1940s. In recent years, however design of experiments has gain great popularity, primarily because of its great success in Japan when it was introduced by W.E.Deming [57]. While Sir Ronald A. Fisher [2-4] was clearly the pioneer in the use of statistical methods in experimental design, there have been many other significant contributors to the literature of experimental design, including F. Yates [58-60], R.C. Bose [61], to name a few.
operation mode). From this selection it is also necessary to choose and set the various process parameters that influence on the final result quality, cost and speed, among others factors [11] and [27]. This technology stimulates major interest due to the fact that it joins various advantages such as: non contact process and no tool wear, possibility of using a controlled atmosphere, high energy density, flexibility on the beam delivering, simplicity in fixation, easy automation, small heat affected zone, high speed, excellent edge quality.
An attempt to improve such properties surface engineering may cause some difficulties to the conventional machined methods such as: high tool wear, processing time and operational costs. Both metallic and nonmetallic materials are cut, welded, and surface treated by different types of lasers at different operating powers. Coherent [17] reported that a 500 W CO2-laser was used to cut nylon seat belts. The laser operated at a cutting speed of 20 mm/s. It was also reported that a 275 W CO2-laser was used with a 254 mm focal length lens and a coaxial gas jet to cut 114 mm thick rubber foam at a speed of 16.6 mm/s. Peters [15] investigated the application of lasers in cutting wood. A 1 kW CO2-laser was used with an assisted N2 gas jet. Furthermore, Todd [28] reported that a 560 W CO2-laser beam can remove ceramic materials at a rate of 5.3 mm3/s. Numerous theoretical models for laser machining have been development by researchers.
There are still many problems that are not well-understood in laser cutting. Mathematical modeling of laser cutting is essential for improved understanding of the process. A variety of overviews have appeared over the last decade, with guidelines and data for laser cutting of various types of materials [10 and 44]. Laser cutting models are generally based on energy balance and the solution of a set of heat transfer equations to obtain a detailed temperature field evolution [36,45,46,48 and 50]. Additional modeling endeavors have extended the level of analysis to incorporate other factors such as reactions between the assist gas and cutting front [16,38 and 47], and dynamic effects of striation formation [30]. The modeling of laser cutting generally attempts to evaluate the cutting quality for given conditions [13 and 26] or to estimate the cutting capability for a given laser and material [8].
was less than the speed of the moving molten layer, caused by the oxidation. Jae et al. [29] developed a 1-D with transient mathematical model for the prediction of striation
formation in a reactive gas assisted laser cutting process. Reactive heat for oxygen cutting and the evaporation mechanism have been considered by Schuőcker [21] to calculate the dynamic phenomena responsible for the striation on the cut surface. The model deals with both the physical and chemical states at the cut front describing the characteristics of striation..
However, the existing models are not sufficient to fully demonstrate the dynamic behavior of laser cutting and the formation of periodic striations as shown in Fig. 1. Most of the models only relate the molten metal layer with constant cutting speed or constant laser power; no interactions are given for the time-dependent factors. In this paper, an analytical is developed to enable the analysis of the formation of molten layer, considering a number of process parameters. The enclosed area between melting front and cutting front is defined as the control volume (cv). Balance of mass, momentum and energy are integrated over the system boundaries in order to predict the melt film thickness, its displacement and velocity, laser absorption and cutting front temperature. The proprieties of the interfaces between the gas and liquid and liquid and solid are considered within the model.
Fig. 1: A typical cut edge mild steel showing the periodical striation