USING DECISION TREES FOR ESTIMATING MODE CHOICE OF TRIPS IN
BUCA-IZMIR
L. O. Orala,*, V. Tecimb
a Dept. of Econometrics, Graduate School of Social Sciences, Dokuz Eylul University, 35160 Buca, Izmir, Turkey – [email protected]
b Dep. of Econometrics, Faculty of Economics and Administrative Sciences, Dokuz Eylul University, 35160 Buca, Izmir, Turkey – [email protected]
KEY WORDS: Transportation, Mode Choice, Data Mining, Classification, Data Structure
ABSTRACT:
Decision makers develop transportation plans and models for providing sustainable transport systems in urban areas. Mode Choice is one of the stages in transportation modelling. Data mining techniques can discover factors affecting the mode choice. These techniques can be applied with knowledge process approach. In this study a data mining process model is applied to determine the factors affecting the mode choice with decision trees techniques by considering individual trip behaviours from household survey data collected within Izmir Transportation Master Plan. From this perspective transport mode choice problem is solved on a case in district of Buca-Izmir, Turkey with CRISP-DM knowledge process model.
1. INTRODUCTION
Modern transport systems should provide sustainability for ever-increasing urban population and should correspond to the people’s need to move. Planners take into account transportation demand and habits of people living in cities for effective investments in transportation. For these reasons decision makers develop transportation plans and models.
Transportation modelling provides local transportation solutions for urban planning. Stages in transportation modelling are listed as trip generation, trip distribution, mode choice, and assignments. In mode choice stage, transportation modes could be revealed in urban areas. Several mode choice models exist in practice and estimate optimum transportation mode or optimum number of travels for each individual mode (Murty&Ashtakala, 1987; Bonnel, 2003; Chaudhury, 2005; Ortuzar&Willumsen, 2006; Liang&Ling-xiang, 2012). Like transportation plans, cities should develop their own mode choice models based on local data. Data can be complex and can contain huge fields and cases depending on size of the study area and level of detail. Data mining techniques must be chose for managing huge local data. Data mining techniques like classification, clustering, association rules, and sequential pattern discovery can be used to determine the factors affecting the mode choice. In literature, decision trees which is one of the classification techniques in data mining, is used to determine transportation mode considering only one type of trip like work-home trip, home-work trip, etc. (Lu&Kawamura 2010, Yao, X. 2007, Xie et al. 2003). In this study the factors influencing the mode choice by considering all types of trips and transport modes are determined with decision trees.
Data mining techniques should be applied with knowledge process models in systematic approach. Because Knowledge Discovery and Data Mining (KDDM) process models can decrease the complexity of applying data mining techniques. It also provide roadmap for data mining procedure. One of the knowledge process models is Cross Industry Standard Process for Data mining (CRISP-DM) standard. Although several studies used mode choice in modelling, but none of them used any
process model. (Xie, C. et al, 2003; Lu & Kawamura, 2010)This paper describes how the process model can be used for identifying of factors affecting the mode choice.
Mode choice stage has been neglected in transportation plans of Turkey’s cities. So this study considered mode choice stage with help of CRISP-DM process model for solving travel mode choice problem on Buca case in Izmir, which is the third biggest city in Turkey with approximately 4 million inhabitants. This research used household survey data collected within Izmir Transportation Master Plan (Izmir Metropolitan Municipality, 2009).
2. BACKGROUND
2.1 Mode Choice
Transportation modelling has four stages, trip generation, trip distribution, mode choice, and assignment (Ortuzar & Williumsen, 2006). Mode choice as third stage includes decision of which modes (cars, bus, train etc.) must be used in transportation planning. Mode choice is affected from personnel (trip maker) characteristics, trip characteristics and trip mode characteristics. As shown in Ortuzar & Williumsen (2006) personnel characteristics include car availability and/or ownership, ownership of driving license, household structure, household income, decisions made elsewhere, and residential density. Trip characteristics include trip purpose and time of the day when the trip is undertaken. And also transport facility characteristics include quantitative factors (relative travel time, relative costs, availability, and cost of parking, availability, and cost of parking) and qualitative factors (comfort and convenience, reliability and regularity, protection, and security). In addition, capacity and speed can be considered in characteristics of transport facility. Factors affecting the mode choice have different priority in various study areas. As stated in Tye et al. (1982) there are common orders of these factors by significance level.
transportation. Determining the factors affecting mode choice can be estimated from household survey data. In this way individual trip behaviours can be explained by affecting factors. 2.2 Data Mining
Data mining can be defined simply as the extracting or mining knowledge from large amounts of data. It is synonym with another popularly used term, Knowledge Discovery from data (KDD) (Han &Kamber, 2006). Data mining consists of more than collection and managing data, it also includes analysis and prediction (Phyu, 2009). Data mining is utilized for determining the factors of mode choice. Several studies used data mining tools in mode choice analysis so far ( Xie et al, 2003; Haluzova, 2008; Lu & Kawamura, 2010).
Data mining methods are grouped into classification, clustering, association rules, and sequential pattern discovery. Classification problems are used to analyse existing a database to determine categorical divisions or patterns in the data. Classification problems are focused on identifying the characteristics indicating the group or class to which each record in the database belongs (Nassar, 2007). Classification is the process of finding a model (or function) that describes and distinguishes data classes or concepts for using the model to predict class of objects whose class label is unknown. The derived model is based on the analysis of a set of training data (Han & Kamber, 2006). A new observation can be easily classified with splitting rules from training sets. In this study undiscovered records from household survey data will be categorized and then they will be classified into the correct group.
Decision tree is one of the classification method and can be large volume data sets. Decision trees are divided into entropy based algorithms (ID.3 and C4.5 algorithms), classification and regression trees (twoing and gini algorithms) Bayesian classification, rule-based classification, lazy learners, and others. Entropy based algorithms can be chosen for determining splitting criteria in decision trees. Firstly for measuring of uncertainty in system, entropy must be calculated:
� � = − ∑= log (1)
where =| , |
| | is calculated with the following parameters;
pi : the probability that an arbitrary tuple in D belongs to class Ci.
D: training set of class-labeled tuples.
Ci: the class label attribute has m distinct values for i=1,…,m
Ci,D : the set of tuples of class Ci in D.
| | ,| , |: denote the number of tuples in D and Ci,D
Entropy is discovered from dataset for training purposes. After determining the target value in entropy based algorithms, information gain for parameters (elements of training set) is calculated from data set. The gain of an interested element A is calculated by,
��� � = � � − � � � (2)
InfoA(D) denotes the entropy of A and is given by the formula;
� � � = ∑�= | || |× � � (3)
where A: the element of D training set.
| |
| | : the weight of the jth partition.
v: number of distinct values for element A for j=1….v are calculated. The parameter which has the biggest value of information gain become root node of decision trees as starting point. This process is iterated by excluding the newly assign root node at each step until last and bottom leaf parameter becomes target value. The decision tree can be generated in this way. Gain ratio is used for partitioning in practical application. The attribute with the maximum gain ratio is selected as the splitting attribute. (Han & Kamber, 2006). Gain ratio is then
��� ��� � =� �� � ��� � (4)
���� � � = − ∑�= | || |× log | || | (5)
ID.3 and C4.5 algorithms are used in entropy based algorithm. ID.3 algorithm is used for classifying categorical values with splitting rules. Unlike ID.3 algorithm, C4.5 algorithm can also be carried out in numerical values. In this algorithm, first of all numerical values must be transformed to categorical values. The first step of creating decision tree is to determine root value which is the highest point of a tree. Complex decision trees can be simplified by pruning sub-trees at a selected leaf node. In this way the quality of classification model can be increased. Data pruning methods include pre-pruning, post pruning, and pessimistic pruning where the latter is applied in C4.5 algorithm. In pessimistic pruning, if expected error in sub-tree is more than expected error in leaf, sub tree must be pruned within confidence limits and changed with leaf.
2.3 CRISP-DM
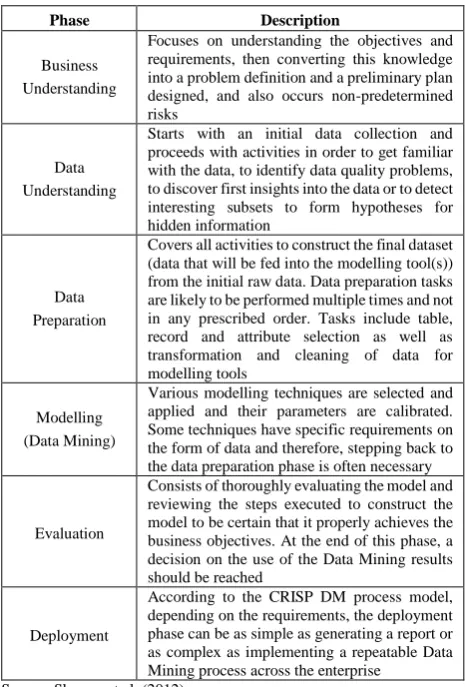
Data mining techniques can be applied with several knowledge process models (Kurgan & Musilek, 2006; Cios and et al., 2007) Cross Industry Standard Process for Data Mining (CRISP-DM) which is a knowledge discovery and data mining process, is one of these models. This process model is jointly developed by cooperations DaimlerChrysler AG, SPSS, NCR, and OHRA (DM, 2000). As shown in Figure 1, the phases of CRISP-DM method can be listed as business understanding, data understanding, data preparation, modelling (step of using data mining methods), evaluation, and deployment. Sharma et al. (2012) described these phases as showed in Table 1.
Figure 1. CRISP-DM Process Life Cycle.
Process model with systematic approach presents roadmap for data mining methods in several studies. So that CRISP-DM standard in mode choice for urban transport will contribute to the decision-makers in different planning areas.
Phase Description
Business Understanding
Focuses on understanding the objectives and requirements, then converting this knowledge into a problem definition and a preliminary plan designed, and also occurs non-predetermined risks
Data Understanding
Starts with an initial data collection and proceeds with activities in order to get familiar with the data, to identify data quality problems, to discover first insights into the data or to detect interesting subsets to form hypotheses for hidden information
Data Preparation
Covers all activities to construct the final dataset (data that will be fed into the modelling tool(s)) from the initial raw data. Data preparation tasks are likely to be performed multiple times and not in any prescribed order. Tasks include table,
Various modelling techniques are selected and applied and their parameters are calibrated. Some techniques have specific requirements on the form of data and therefore, stepping back to the data preparation phase is often necessary
Evaluation
Consists of thoroughly evaluating the model and reviewing the steps executed to construct the model to be certain that it properly achieves the business objectives. At the end of this phase, a decision on the use of the Data Mining results should be reached
Deployment
According to the CRISP DM process model, depending on the requirements, the deployment phase can be as simple as generating a report or as complex as implementing a repeatable Data Mining process across the enterprise
Source: Sharma et.al. (2012)
Table 1. Phases of the (KDDM) Process for CRISP-DM
3. METHODOLOGY
Factors influencing the mode choice of transport are discovered by decision tree method with systematic approach using CRISP-DM Process model. CRISP-CRISP-DM phases were completed sequentially. Household survey data is used for determining factors affecting mode choice in process life cycle as Figure 1. 3.1 Business Understanding
This phase includes several aspects such as determining the objective, assigning capable analysts, choosing the appropriate data and software, and regarding possible risks during the process cycle. The objective of the process model is to discover the factors affecting all transport mode choice from urban data set in Izmir. Competent experts like statistical data analysts, transportation specialists should be assigned in order to carry out the analysis. We chose household survey data collected within Izmir Transportation Master Plan in 2007. SPSS, Microsoft Excel, and Rapidminer software is selected for different phases of the process life cycle.
We identified the risks as follows;
- Number of the fields and the cases may not be enough to construct an efficient decision tree. Because the obtained data were collected within a different project with different objectives.
- Data may indicate complexity which may hamper reliable analysis of the data.
It any risk occurs during the process, analyst should return back to the corresponding phase in order to resolve risk generating factors.
3.2 Data Understanding
Household survey data were polled from 25000 houses in Izmir Metropolitan Area in 2007. The survey was completed by meeting face to face with each household in their house. Totally 55 survey questions are grouped as id, address information (per house), house information (per house), vehicle ownership (own or someone else), vehicle information (per vehicle), person
This is the most difficult and most time consuming element of all knowledge discoveries in database processes (Haluzova, 2008). In this phase data are prepared for analytical methods. Steps in data preparation phase consist of selecting, filtering, constructing and formatting data.
3.3.1 Data Selection
Including all existing data from household survey increased the complexity of the analysis. In addition, using the entire data set did not fit to the purpose of this study. Therefore some of the variable were removed from the data set. Twenty-five variables were selected based on the literature given in Section 2.1 and these are shown in Table 2.
Variable Group Name Variables
House Information (per house)
House type, House ownership, Second house ownership, Num-ber of people, NumNum-ber of vehicle, Number of private car
Person Characteristics (per person in house)
Degree to head of household, Age Groups, Gender, Student-ship, Education, Working Status, Sustainability, Driver License, Public transport card ownership Information of vehicle in
trip (per person)
Number of trip
Trip Information (per trip)
Purpose of trip, District and Land use of Starting point, Starting Time, Transportation Mode, Dis-trict and land use of ending point , Ending time, Trip time Table 2. Variable Type in Survey Data
3.3.2 Data Filtering
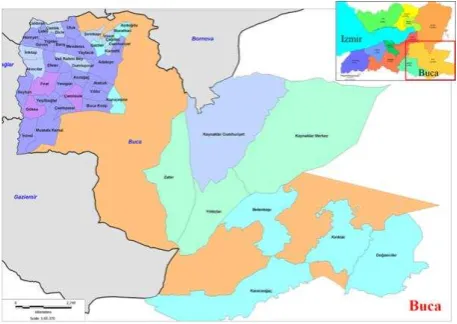
Household survey data contains trip data from 25.000 houses in Izmir city. Nearly 101.000 trip data were obtained for each individual living in a house. Although the entire data set can be used to determine the mode choice for the entire city of Izmir, we concentrated in a small part of the data set, that is Buca district. Of total 25000 household survey data 2579 were sampled in Buca district with 14135 individual trips. We treated Buca as a training set for a potential mode choice determination study in the entire Izmir city.
Figure 2. Study Area based on Neighbourhoods of Buca district in Izmir
3.3.3 Data Construction
Household survey data were obtained in .sav format from SPSS software. After neighbourhood, districts, and street names were organized to allow for spatial analysis, it was transformed to .xls format. The reason for transformation to .xls format is to fill empty spaces encountered in the row data by the corresponding survey value. Same information for same households is enlarged for all trips to carry out an error-free analysis. As shown in Table 3, the empty space in data view was filled up and TrNo which is the mean of trip number was put into first column of dataset that shown in grey background. This column showed the number of row data in dataset. In other words, number of trips that included in survey data.
Tr No
House Information
Person Characteristics
Trip Information Survey
ID X1,…,n
Person ID Y1,…,m
Trip ID Z1,…,k
1 1 --- 1 ... 1 ...
2 2 --- 1 ... 1 ...
3 2 --- 2 ... 1 ...
4 3 --- 1 ... 1 ...
5 3 --- 2 ... 1 ...
6 3 --- 2 ... 2 ...
7 3 --- 2 ... 3 ...
8 3 --- 3 ... 1 ...
9 3 --- 3 … 2 …
TrCrNo: Trip creating number
Person ID: Number of person in per house Trip ID: Number of trip per person
Xi,…,n : Variables of House Information group Y1,…,m: Variables of Person Characteristics Zi,…,k: Variables of Trip Information
Table 3. Data Structure
After all trip data were prepared as Table 3, information about distribution of transport mode per one day trip in Buca was obtained. As shown in Figure 3, most of trip makers in Buca preferred public transport if none-trip mode is not take into account. Factors affecting all transport mode choice will be determined in modelling phase of the process.
Figure 3. All transport modes for one day trip in Buca. 3.3.4 Data Formatting
For applying data mining techniques, the type of each variable must be defined. Rapidminer, open source data mining software, is used for applying data mining techniques. Firstly, data must transfer to the software with right type definition for using methods and significant results. Data structure of the data set was defined as available for software is shown in Table 4. The transport mode was adopted as target value because we attempted to construct the decision tree by factors affecting the transport mode choice.
Variable Name Data Type Value
House Type polynominal apartment, detached house, 2-storey house,… House Ownership polynominal own, rent.etc.
Second House Owner-ship
binominal yes, no Number of people integer 1,2...,n Number of vehicle integer 1,2...,n Number of private car integer 1,2...,n Degree to head of
household(DHH) polynominal
wife/husband, child, mom/dad... etc.
Age Groups polynominal 0-6, 7-12, 13-18, 19-22, ..., 47-54, 55 to up Gender binominal male, female Studentship binominal yes, no
Education polynominal secondary sch., under-graduate, graduate etc.
Working Status polynominal with salary, own job, ... etc.
Sustainability in job polynominal employee, temporary, unemployed Driver Licence binominal yes, no Public Transport Card
Ownership
binominal yes, no
Purpose of trip polynominal work, home, education, shopping, ... etc. Number of trip polynominal 1,2,....n District of starting
point polynominal districts of Izmir Land use of Starting
point polynominal
house, school, office, hospital, airport, etc. Starting Time time 24 hours
Transportation Mode* polynominal walking, bicycle, car, service, bus, train.. etc. District of ending
point polynominal districts of Izmir Land use of ending
point polynominal
house, school, office, hospital, airport, …etc. Ending time time 24 hours
Trip time integer minutes
Table 4. Variable names, data types and values 3.4 Modelling
Data mining techniques was selected and applied in this section of CRISP-DM process model. C4.5 algorithm was applied on 14134 trip data from Buca district. For generating a decision tree and using C4.5 algorithm, equations given in were utilized as shown in Section 2.2 and the calculations were carried out by Rapidminer software. Process was constructed with Retrieve and Decision Tree operators provided by the software.
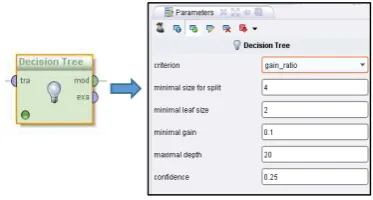
Figure 4. Retrieve Operator and its Parameter Formatted data in form of Table 4 were included in process by using Retrieve operator. Data Set had to be identified in Repository Entry which is the part of Retrieve operator (Figure 4). After data set was identified in Retrieve operator, it was connected with Decision Tree operator. Before starting the process, criterion, minimal size for splitting, minimal leaf size, minimal gain, and maximal depth of decision tree were set as shown in Figure 5.
Figure 5. Decision Tree Operator and its parameter Process of Rapidminer software for creating decision tree is shown in Figure 6. As a result of this process, decision tree is created as output.
Figure 6. Screenshot of decision tree process from Rapidminer Pruning was carried out in the process when the expected error in case of the exclusion of sub-trees exceeded the 25% confidence limit. By this way, simplified decision tree for 14134 trip data from household survey in Buca was created as shown in Appendix 1. Factors affecting the mode choice were differentiated by households’ characteristics and trip choices with created decision tree. As seen in decision tree, “Number of trips” variable is root value of the tree.
3.5 Evaluation
As mentioned earlier, “Number of trips” variable is root value of decision tree. By different value of this variable, branches appeared and increased depending on splitting rules. Causing the most varying factors in mode choice that obtained from this tree are listed in Table 5. These variables are trip time, purpose of trip, number of people, driver license, and number of vehicle, house type, house ownership, age groups, working status and public transport card ownership.
Trip time Public Transport Card Ownership
Purpose of trip House Type
Number of people House Ownership
Driver license Age Groups
Number of vehicle Working Status Table 5. The most varying factors in mode choice Splitting rules were created from household survey data of Buca as training set with decision tree. So that when a new observation (a trip information of household person) is included in tree, mode choice of the new observation can be easily estimated with splitting rules from tree. From decision tree results for one district can be applied to other districts in city or all cities.
Starting and ending points of the trips were initially adapted as variable in the decision tree. However, our study revealed that International Archives of the Photogrammetry, Remote Sensing and Spatial Information Sciences,
these variables do not have significant effect on transport mode choice. The results show clearly that their minor effects on differentiation of branches in decision tree. This analysis concluded that location of individual trip makers did not contribute to mode choice for Buca.
3.6 Deployment
Final report of the study must be prepared in deployment phase of CRISP-DM process. Achievement of the goal and success of the method in this study must be included in this report. This report must be share with decision makers about urban transportation. Identifying the factors affecting mode choice with household level was achieved in this research.
4. DISCUSSION AND CONCLUSION
This study focuses on factors affecting the mode choice that is one of the steps of transportation modelling by the perspective of individual trip behaviours. For this purpose, household survey data of Izmir were used as data set. For analysing this data set, decision tree method by C4.5 algorithm was utilized. When using this data mining technique, phase of the CRISP-DM standard process model was followed step by step. In this way, different from prior studies, CRISP-DM process model was used in transportation studies.
By using solely household survey data from 2007, factors affecting the mode choice were identified on Buca which is one of 21 districts in Izmir. House information, information of vehicle in trip, person characteristics and trip information for individual trip records were extracted from the survey data. After building decision tree with C4.5 algorithm, most varying factors variables in mode choice were obtained such as trip time, purpose of trip, number of people, driver license, number of vehicle, house type, house ownership, age groups, working status and public transport card ownership in this study area. This means that if one of these variables values changes, transportation mode choice of household person will also change. Besides our analysis concluded that the location of starting and ending points of trips did not have did not have any significant effect on mode choice for individual trip makers living in Buca.
Identifying the factors affecting mode choice with only one district cannot be applied to remain districts and to other cities as well. For this reason, this analysis should be extended not only one district but also all districts in Izmir within further studies. Integrating other data such as network infrastructure, pricing politics, etc. may improve the significance of factors affecting mode choice.
Acknowledgements
The authors would like to thank Izmir Transportation Master Plan group for sharing household survey data and also would like to thank Dr. M. Güven KOÇAK for his advices on the organization of the paper.
References
Bonnel, P. 2003. The Estimation of Aggregate Modal Split Models. European Transport Conference. Strasbourg,France. Chaudhury, P.D. 2005. Modal split between rail and road modes of transport in India. Vikalpa:The Journal of Decision Makers 30(1):17-33.
Cios, K.J. et al. 2007. Data Mining-A knowledge Discovery Approach Springer.
CRISP-DM. 2000. Cross Industry standard process for data mining1.0: Step by step data mining user guide. http://www.the-modeling-agency.com/crisp-dm.pdf (17.09.2012)
Haluzova, P. 2008. Effective Data Mining for a transportation information systems. Acta:Polytechnica 48(1): 24-29.
Han, J. & Kamber, M. 2006. Data Mining Concepts and Techniques. San Francisco: Morgan Kaufmann
Hensher, D.A et al. 2004. Handbooks in Transport Volume 5: Handbook of Transport Geography and Spatial Systems. Oxford: Elsevier.
Izmir Metropolitan Municipality. 2009. Izmir Transportation Master Plan. Department of Transportation, Coordination Headquarters of Transportation. Izmir.
Kurgan, L.A & Musilek, P. 2006. A Survey of Knowledge Discovery And Data Mining Process Models. Knowledge Engineering Review. 21(1):1-24.
Liang, Z. & Ling-xiang, Z. 2012. Public Transportation Dynamic Guidance Model and Algorithm. Advances In Civil Engineering And Architecture Innovation, Pts 1-6 Book Series: 368-373:3113-3116.
Lu, Y. & Kawamura, K. 2010. Data-mining approach to work trip mode choice analysis in Chicago, Illinois, Area, Transportation Research Record 2156: 73-80.
Murty, A. & Ashtakala, B. 1987. Modal split analysis using logit-models. Journal of Transportation Engineering-ASCE. 113(5): 502-519.
Nassar, K. 2007. Application of data-mining to state transportation agencies’ projects databases, ITcon. 12:139-149. Ortuzar, J. D. & Willumsen, L.G. 2006. Modelling Transport. Chichester: John & Wiley.
Ozkan, Y. 2008. Veri Madenciligi Yontemleri, İstanbul:Papatya. Phyu, T. N. 2009. Survey of Classification Techniques in Data Mining. International Multi-Conference of Engineers And Computer Scientists, Vols I And II Book Series: Lecture Notes in Engineering and Computer Science:727-731.
Sharma, S. et al. 2012. Evaluation of an integrated knowledge discovery and data mining process model. Expert systems with applications. 39(13): 11335-11348.
Tye, W.B. et al. 1982. Application of Disaggregate Travel Demand Models. Transportation Research Board. Washington D.C: Transportation Research Board.
Xie, C. et al. 2003. Work travel mode choice modeling using data mining: decision trees and neural networks. Traveler Behavior and Values 2003: Planning and Administration, Transportation Research Record. 1854: 50-61
Yao, X. 2007. Where are public transit needed-examining potential demand for public transit for commuting trips. Computers, Environment and Urban Systems. 31: 535-550.