CROWDSOURCED MAPPING – LETTING AMATEURS INTO THE TEMPLE?
Michael McCullagh a,* and Mike Jackson a
a University of Nottingham, Nottingham, NG7 2RD, UK – [email protected]
KEY WORDS: Crowdsource, Surveying, Mapping, Spatial Infrastructures, Cartography, Internet, Accuracy, Quality
ABSTRACT:
The rise of crowdsourced mapping data is well documented and attempts to integrate such information within existing or potential NSDIs [National Spatial Data Infrastructures] are increasingly being examined. The results of these experiments, however, have been mixed and have left many researchers uncertain and unclear of the benefits of integration and of solutions to problems of use for such combined and potentially synergistic mapping tools. This paper reviews the development of the crowdsource mapping movement and discusses the applications that have been developed and some of the successes achieved thus far. It also describes the problems of integration and ways of estimating success, based partly on a number of on-going studies at the University of Nottingham that look at different aspects of the integration problem: iterative improvement of crowdsource data quality, comparison between crowdsourced data and prior knowledge and models, development of trust in such data, and the alignment of variant ontologies. Questions of quality arise, particularly when crowdsource data are combined with pre-existing NSDI data. The latter is usually stable, meets international standards and often provides national coverage for use at a variety of scales. The former is often partial, without defined quality standards, patchy in coverage, but frequently addresses themes very important to some grass roots group and often to society as a whole. This group might be of regional, national, or international importance that needs a mapping facility to express its views, and therefore should combine with local NSDI initiatives to provide valid mapping. Will both groups use ISO (International Organisation for Standardisation) and OGC (Open Geospatial Consortium) standards? Or might some extension or relaxation be required to accommodate the mostly less rigorous crowdsourced data? So, can crowdsourced data ever be safely and successfully merged into an NSDI? Should it be simply a separate mapping layer? Is full integration possible providing quality standards are fully met, and methods of defining levels of quality agreed? Frequently crowdsourced data sets are anarchic in composition, and based on new and sometimes unproved technologies. Can an NSDI exhibit the necessary flexibility and speed to deal with such rapid technological and societal change?
1. THE RISE OF CROWDSOURCING AND VGI
It was probably Howe who in 2006 first coined the term “crowdsourcing” (Howe, 2008), and assigned it to the discovery and use of data by citizens for themselves and by themselves. From the start this included both locational, spatial and thematic information. The expansion of the geospatial database was largely made possible by the rapid growth of the use of personal GPS systems. As a geoscientist I tend to think of crowdsourcing as being inherently concerned with locational data, but it is worth noting that Howe said crowdsourcing could be categorised as:
the act of a company or institution taking a function once performed by employees and outsourcing to an undefined (and generally large) network of people in the form of an open call . . . (Howe, wired.com)
which contains no spatial concept as a main theme.
The crowdsource idea has spread since 2006 and multiplied to involve people everywhere, but has raised some disquiet amongst established agencies that previously were considered by themselves, and frequently everyone, not only to “own” the field of activity – such as topographic survey – but also to have developed excellent standards and practices. Many organisations considered that crowdsourcing newbies would be acting haphazardly at best, and erroneously at worst.
An important distinction has arisen since Howe’s statement: that between volunteered and contributed information – VGI or CGI (Harvey, 2013). Many people volunteer information to groups or institutions in the hope and expectation of getting it back, possibly enhanced by other voluntary additions or edits, to use
as they wish – probably for thematic purposes of their own. Contributed information may be provided voluntarily, but what happens to it is up to the organisation to which it was given. The contributor has either no or very minimal rights to it thereafter. The OpenStreetMap (OSM) ethos, as will be considered later, is that of entirely VGI, whereas other activities, such as donation of information to the Google mapping suites, tend to be CGI. Everybody can use the final products of both, but CGI donations are not necessarily reciprocal.
power of com by Anderson.
1.1 Are the B
Of course we w legal situation explain why G agreement (htt Content in our or data much h successfully b different conte into gratis and or no restrictio “The ambig where the d with laws co (http://en.wi Richard Stall summarised th speech, not fre spatial data an beer!
VGI and CGI US there has b advancing tech then to collec Crump, 2012) accessed com provided 35,83 in a seven mon
mputer analysis r
Best Things in
weave a tangled n on crowd sour Google have suc
tp://www.googl r Services). Ind hair splitting is etween the diff exts. Wikipaedi d libre: for zero on, libre. guity of the Eng distinction is imp
oncerning the u ikipedia.org/wi lman, quoted he difference in ee beer." This p nd open source
data are also su been a recent S hnology, such ct, store, and a ). In Germany mpany records
31 individual lo nth period.
Figu
results in the sy
Life Free?
d web once we rced data of any ch a thoroughly le.com/intl/en/p eed when it com
necessary to di ferent meanings ia puts it nicely price say grati
glish word free c portant, as it of use of informati iki/Gratis_versu
in the wikip n a slogan: "Th principle appear
software as mu
ubject to the la Supreme Court
as private cell analyse the re y in 2010 a G and found th ocational and in
ure 2: The situat
ynergism envis
plunge into the y kind. This help y stated CGI
policies/terms/, mes to free softw istinguish s of “free” in
by dividing fre is, but for with l
can cause issue ften is in dealing
on” us_libre) pedia entry a
hink free, as in rs to apply equa uch as to speec
w of the land. I ruling against phone tracking sults (Liptak, Green Party me
hat his phone nformational re
tion in 2011 sho sioned
e ps
Your tware
ee little
es ng
above, n free ally to ch and
In the using g, and 2011, ember e had ecords
Colle volun
1.2
F
Crow to so and t betw deve mean anoth linki LOD and detai
owing great inc
ection of inform ntary or contrib
Open Source
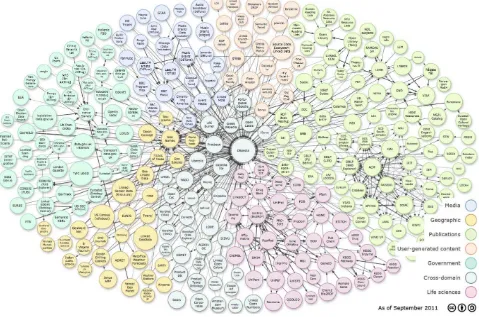
Figure 1: Early
wdsourcing reli oftware service thematic ideas. ween different
elopment of a ningfully betwe her’s terminolo ng process and D (linking-Open 2. See http:// ils and the curre
crease in both li
mation may not butory.
Data Linkage
starting situatio between da
es on the intern es, general com
As the internet data provid a semantic w een its parts: o ogy. Hahmann d have widely p n-Data) cloud d
/richard.cygania ent state.
nks and comple
t necessarily be
es
on in 2007. Few ata sets.
net for its organ mmunications, et has grown, so ders. This ha web that can one repository c n et al (2010) publicised Rich diagrams, show
ak.de/2007/10/
exity.
e either overtly
w links exist
nisation, access search ability, o have linkages as forced the communicate can understand ) describe this ard Cyganiak’s wn in Figures 1 /lod/ for more y
s , s e e d s s
Circle size fo <10K, and ve varies from th indicating >10
The technolog Uniform Res Resource Loc protocols for r (Resource De based data mo (Bizer et al, 20 be a representa Tim Berners-L with coining b frequently des right".
1.3 Growth o
It is quite instr Programming years. Figure www.program “mashups” – thematic data The pink sha August 2012.
Figure
Figure
or each data sit ery large >1B i hin at <1K links
00K links.
gies used to p source Identifi cator), URNs ( retrieving resou escription Fram
odel for describ 009). Linked D
ation of what m Lee, inventor o both the term S scribed Linked
of VGI Web M
ructive to look Interfaces) fo 3 is taken fro mmableweb.com using data from generated by V aded area show
e 3: Growth in A
e 4: New mappi
te indicates co items. Width o s between a pai
provide the lin fier, containing
(Uniform Reso urces, and mor mework), provid
bing things and Data, as in Figur many would cal of the Web and Semantic Web a Data as "the S
Mapping and M
at the growth o ound on the W om the “Progr m/apis) and sh m institutional VGI, or from oth ws growth in t
APIs over the la
ing API growth
ntent: very sm of link between r of datasets to
nks are URIs – g URLs (Un ource Name), H
re recently, the de a generic g d their relation re 2, might be s ll the Semantic d the person cre
and Linked Dat Semantic Web
Mashups
of APIs (Applic Web in the last rammable Web ows the grow
sources mixed her data reposit the 3 months u
ast four years
h 2005-2012. 2012 are given
Nov 2012 ther ed to at least so of 292 APIs ov
acceleration of ast few years, a ed to realise the y et al (2010) h backcloth m mplified by Go ications built ng on the platfo ndary software Maker, and fin g basic software
2. CROWD
009 there were data. Figure 5, e global sprea cerns the motiva
ure 5: Countries their da
development o rce Software) ons. He sugge uism, profession ection or enha anced personal
e in local comm well: mischief, ce or criminal e, not as well or
ome of the mos M. But the prob
nt require serio before acceptan
nth’s data for 2 . This is each y re were 7,920 ome element of
er the previous
f all forms of AP and particularly e potential bene have suggested mapping using oogle Maps an
using the dat orm; the ability
e, such as wi ally portals that e, such as OSM
DSOURCING
many countrie taken from Co ad. The quest ation of these vo
s using Google ta in 2009. From
of Wikipaedia a communities m ests in line wi nal/personal int ancement of an
reputation, cre munity. There ar agenda driven
intent. These rganised and pe st successful altr
blems resulting ous checking of nce into any pe
2005, and the f year’s added s APIs, of whi f mapping; this
month.
API has been con y mapping sites
efits to themsel d a categorisati g a basic po
nd MyMaps; ta facilities an to add data to ith GMapCrea at allow users to M crowdsourced
GEOSPATIA
es collecting an oleman et al (20 tion addressed volunteer produc
MapMaker to c m Coleman, 20
and the FOSS may act as a ith Wikipaedia terest, intellectu n investment, eative outlet, a re, of course, n n individuals, a latter individu erhaps consider truistic VGI exa g from malicio f all data dona ermanent archiv
first 11 months ites, not totals. ch 2,635 were was an overall
nsiderable over s, as users have lves and others. on of mashups ortal such as more complex nd applications mapping using tor or Google o create content d mapping.
AL DATA
nd editing their 009), shows the d by Coleman
cers.
collect and edit 009.
2.1 Why make VGI Maps?
According to Starbird (2012), “Crowdsourcing, in its broadest sense, involves leveraging the capabilities of a connected crowd to complete work.” OSM is probably the best mapping example, though there are many to choose from, particularly if the process of gathering the data and filtering it is considered a prime function in the process, such as the use of Twitter to gather data, followed by collaborative filtering to identify local Twitterers who are providing raw data during active catastrophes (Starbird et al, 2012).
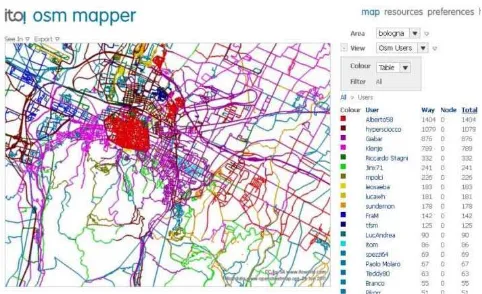
OSM (see on-going project in Figures 6 and 7) is venerable by web standards. Formed in 2004 by Steve Coast it now has over 200,000 members and was created to be free as in “beer” and relies on crowdsourced data and editing, much like Wikipedia. How well has it performed in the last 8 years? This will be a consideration of a later section of this paper.
The map making process is in essence simple and straightforward. Volunteers take a GPS on their journey, record their tracks and any extra information with notebooks, cameras etc (see http://wiki.openstreetmap.org/wiki/Main_Page), return home to download all the information, upload it to the data base and edit the result. Since 2006 Yahoo, and more recently some national mapping providers, have allowed OSM to use their imagery to help create the OSM map. A good example is the Baghdad City plan in Figure 8 generated in OSM, using imagery, online drafting, and ground truth checks by local volunteers.
Figure 8: Baghdad City, using OSM, mapped remotely by volunteers, from imagery, with ground checks.
Figure 6: The OSM “no-name” project.
The no-name project was active on the OSM web site in November 2012, where users were invited to help with known problems – in this case unlabelled route names in Europe. The apparent density of no-name routes rather over-emphasises the scale of the problem.
Apart from OSM most of the impetus for mapping has come from individuals or groups desiring thematic content, rather than desiring to be ground surveyors. This explains why basic mashup sites have been so popular, where base mapping is provided, and the group generates the thematic coverage. Academic researchers have also been busy using mashups to display group activity such as Twitter messages, and other internet measurable phenomena.
Twitter messages have been mapped successfully by some VGI enthusiasts. Figure 9 shows one of these maps for central London. Volunteers can get up to almost anything. A recent example is the London Twitter Language Map in Figure 9, generated by UCL CASA from an analysis of tweets for about six months between March and August 2012 (see at
http://mappinglondon.co.uk/2012/11/02/londons-twitter-tongues/). English accounted for 92.5 per cent of the tweets, with Spanish the second most common language, followed by French, Turkish, Arabic and Portuguese.
Figure 9: Tw Road and poc French langua high density Kensington - School and th speed with wh finished maps question of wh considered leg the legal cases
Figure 10:
Another aim o time maps of One of the mo map showing underground http://traintime shows the pre Underground took only a fe June 2010, he Tube API, wh
witter Language colours for the p
et analysed, wit layed). Data an
icates that in th c tweets (green) ckets of Russian
age tweets (red pockets around an area with th he French Emb hich analysis of
put online. Th hether access to gitimate, or inde s referred to ear
Excerpt of the r Somervil
of the VGI mov various pheno ost urbane of th g Tube trains railway n es.org.uk/map/t esent location o symbol for ev ew hours to dev eld at Kings Pl
ich releases dat
e Map of Londo period from Ma th over 3 millio nd map from UC
he north, more T ) are found mos n tweets (pink) d) are surprisin d the centre ra he Institut Fran bassy. The ma f the data can b here remains the
o this type of so eed should be r rlier in the USA
real-time Tube lle (Nov 2012).
vement is the c omena to show hese must be M s moving thr network (se tube/). A yello of every sched very station. Th velop during S lace, using Tran ta about train m
on. Languages u arch to August 2 on in English (n
CL CASA.
Turkish tweets ( stly around Edg ) in central Lon ng as they occ ather than in S ncais, a French
ap demonstrate be performed an e extremely rel ocial network d regulated, in vie A.
map by Matthe
creation of near changes over Matthew Somerv rough the Lo e it live ow pin in Figu duled train and he entire applic cience Hack D nsport for Lon movements.
Figure 11: Bro politi nternet survey – self-selecting. O as a result a ma osed to the
rding to ISPs. he UK – hence
were obviousl lly intended s mination date, i rest and concern
Mapping Disa
haps the most p e been found i asters happen an cient or adequ ir to be undert the VGI mash erated (Liu et al e been formed
f, for instance dreds: Patrick M ers many glob
//www.tomnod nly concerned vity; and of co gle, or anothe vities are very d
damage from ruary 2011 wa m images on th //www.christch ure 12 shows s age was visible d be made of w ned on the web e put to work ve
oadband access ically active SIG
an online que
also an exampl own motivation would be a grou sibility in a par ww.surveymapp – only to those Over one mont ap of East Angl theoretically a Oddly, some re the patchy det ly unhappy ab survey started indicating perh n in the broadba
asters
ublicised and h in the area of nywhere, quick uate mapping to
aken. There ha hups and full m
, 2010; Barring specifically to choosing rath Meier’s Ushahi
al projects; th d.com/geocan/,
with relief fr ourse many, m er of the map detailed.
m the City of s mapped by he GEOCAN s hurchquakemap some of the w e on the photo where help was site where nec ery quickly to a
speeds. An exa G at work using estionnaire.
le of a special ns for VGI map up with an actio rticular part of pper.com was u who wanted to th 13,000 entr lia emerged sho achieved conn esponders lived tail in other par bout their inter d to go glob haps a public and speed issue
helpful results o f disaster resp kly, and often in
o enable effici as been conside mapping sites t gton et al, 2011) o attempt to h her blindly ou idi at www.ush he GEOCAN conceived b from the effec many groups u pping sites. S
Christchurch volunteers aro site. See the ex p.co.nz/ for eart work performed os so that a rap
needed. An arm cessary - air ph aid in recovery.
ample of a g
interest group pping. Another on agenda such the UK. In this used to conduct o respond, so a ies were made owing actual as nection speeds d in other parts rts of the UK -rnet access! A al before the expression of e.
of VGI activity onse mapping. n areas without ent rescue and erable research that have been ). Many groups handle disaster ut of a cast of hahidi.com that Consortium at by ImageCat, cts of seismic using OSM, or Some of these
Figure 12: Christchurch earthquake survey. From at http://www.tomnod.com/geocan/. The training image on the left indicates how damage appears on photos. The yellow lines, drawn by the VGI community worldwide, outline serious earthquake damage to
buildings in the image on the right.
Even YouTube has been getting into disaster mode recently in the USA, though less for relief than display of Twitter messages, to a mapping and disaster music background. See the Hurricane Sandy (October 2012) Tweets video at www.youtube.com/watch?v=g3AqdIDYG0c&feature=player_e mbedded.
A question that needs to be asked is: “How do the VGI instigated sites compare with those organised reactively or proactively by the authorities?” The answer is difficult to assess as often the aim of the sites is different. The VGI contributors tended to be very single theme focussed and do not always take, or have responsibility for, an overview to any given disaster. The authorities, have to respond, inform, and deal with all aspects of the situation, and so may appear, and quite possibly be, more lethargic in their reactions to events.
Patrick Meier, at http://irevolution.net/2012/08/01/ crisis-map-beijing-floods/ blogged about the terrible flooding in Beijing in July 2012 in which over 70 people died 8,000 homes were destroyed, and $1.6B of damage sustained; the result of the heaviest rainfall in 60 years. VGI contributors, within a few hours and using the Guokr.com social network had launched a live crisis map that was reportedly more accurate than the government version, but also a day earlier. Figure 13 shows part of the crowdsourced map as at 1st August. Mr Meier commented that additions in the future might be to turn the excellent crisis map into a crowdsource response map by online matching calls for help with corresponding offers of help, and to create a Standby Volunteer Task Force for potential future disaster situations.
Figure 13: Part of the crisis map made by VGI from the July 2012 Beijing floods.
Some days later the Beijing Water Authority map in Figure 14 was published. It has all the benefits of production by authority: it is precise, accurate, exhibits good cartography, while at the
Figure 14: Beijing Water Authority Map generated for the flood of July 2012.
The Beijing Meteorological Bureau sent 11.7 million people an SMS warning on the evening of the rainstorm, including safety tips, but it proved impossible to warn all Beijing’s 20 million residents because the mass texting system was far too slow to disseminate the warning.
The third example to be considered in this paper is the tragedy of the January 12th 2010 Haiti earthquake and the crowdsourcing response to it, as outlined in Heinzelman et al (2010). The magnitude 7 earthquake killed about 230,000 people, left 1.6M homeless and destroyed most of Haiti’s populated urban areas.
Figure 15: Organised VGI at work - Patrick Meier’s living room – the Ushahidi-Haiti nerve centre at the start of the crisis.
The response of the Ushahidi organisation was immediate and the Ushahidi-Haiti map was launched. A large collaborative effort was instituted, governmental, industrial, academic, and from the grass roots to create a map of the present post calamity Haiti, and place upon it texted messages concerning needs and requirements. 85% of households had mobile phones, and of the 70% of cell phone masts destroyed most were repaired rapidly
and back in service within a few days. The texts contained reports about trapped persons, medical emergencies, and specific needs, such as food, water, and shelter. The most significant challenges arose in verifying and triaging the large volume of reports. These texts, at a rate of 1,000-2,000 per day, were handled by more than 1,000 volunteers in North America, plotted on maps updated in real time by an international group of volunteers, and decisions and resources allocated back in Haiti.
Figure 16: Part of the final OSM-Haiti earthquake damage map. 1.4M edits were performed during the first month.
If a piece of information were considered useful and specified a location, volunteers would find the coordinates through Google Earth and OpenStreetMap and place it on haiti.ushahidi.com for anyone to view and use. The results can be viewed at http://wiki.openstreetmap.org/wiki/WikiProject_Haiti/Earthqua
ke_map_resources. Through the aggregation of individual
Figure 17: Fr damage grad volunteers, by
weeks after t
The damage t both the map of building in process using different secto Figure 18.
Figure 18: Fr from the earth
The blue line i day. This total plus the red li Pre-existing ed completed dur
So, what did story in dram health clinics,
rom Barrington des 4 (very heav y day, followin the event (23rd
been mapped
to buildings w extract in Figu Figure 17. Cha
OSM and cre ors of the OS
rom Chapman hquake occurren
in Figure 18 rep l consists of the ine – editors w ditors, unsurpri ring the month f
they achieve i matic fashion; fr refugee sites an
n et al (2011). B vy) and 5 (destr ng the earthquak d January) most d by the commu
was extremely h ure 16 and the
apman (2010) d eated a graph
M community
(2010). Numb nce on 12th Janu
presents the sum e yellow line – who signed up a isingly account following the e
in this month? from nothing to nd other amenit
Building number royed) identified ke. By less than
of the damage unity.
heavy, as show graph of destru describes the ed of edits per da y. This is show
ber of edits per uary 2010.
m of edits on a pre-existing ed after the earthq for 85% of the arthquake.
Figure 19 tell o full mapping
ties fully mappe rs in BY-SA. State tom) the Haiti e
Dougal (2012) c ber of recent hquake, and th which crowd m total number o 00; Christchur 00. Lifecycle hquake to more rded the observ fied to 99% ve
n not true. H wdsourced map rts, particularly
ge et al (2011) erent group from
mon goal. Co viduals can be b n achieved in m m the event. Th
nisations and th governmental g
inuous major ex quality and ac ations at least, m r all, freely pro ulation. Someti
nisation, data c
From Per eetmap.org/, O of OSM map earthquake – par
considered the disasters: Que e Japanese Tsu map sites were e of volunteers rch earthquake of a site was e than six mon ved quality of erified; but unv He concluded
s filled a gap in the early cha
consider that a m the crowd an
ordination of by no means ea most cases with is fact alone in he strength of group can form
xpenditure from curacy of VGI malicious activi ovided by a ge mes things go collection, or co
erkins (201 OpenStreetMap pping before ( art of Port-au-Pr
contribution of eensland floods unami. He pra established, and involved: Que e, 100,000; Ja s typically a m nths for the tsu f reports varyin nverified does n
that in all th p in the emerg aotic stages of t
a key issue is th and moulding it independent V asy. And yet th hin hours or da ndicates the nee them. No form m or act as qu m the public pu I are needed b ity has not been enerally benign wrong with V ommunications
11), source p contributors, (top) and after
rince.
f VGI during a s, Christchurch aises the speed d approximated eensland flood, apan Tsunami, month for the unami. He also ng between 6% not necessarily hree cases the gency response
the crisis.
the map suffe point when th work and this are the times w the map. In its available versi and on-going e this as instabi truth.
2.3 Mapping
The VGI com much of it pro the Google o national map available. The for making ma foster econom facilitate mapp countries in E 2010 the UK much of its ba of charge, wh (Bray, 2010).
The availabil crowdsourced the detail of th one of the m http://www.os Commits (SVN approximately OSM, but by a
Figure 20: SV 1998 and Apri supplying cod
In Figure 20 G development, the open sour shows, becau other projects commits in all a younger proj
Figure 21 show on a number benefits of op ideas rapidly contribute to m projects.
ers as a result. hings go wrong point is often o where all OSM s default positio ion of the datab editing never lo ility, others as
g Software for
mmunity relies ovided by fully or Yahoo map pping agency e USGS has be
ap data availabl mic growth, res ping amongst th Europe have lag
Ordnance Surv asic map data a here previously
lity of softwa mapping initia he development ainstays of the sgeo.org/home, N) to indicate y the equivalen a software autho
VN Commits for il 2011. Inset is de to each projec
GRASS is by mostly because rce software p use it has more s. Altogether th
l OSGeo softwa ject, is catching
ws the number of different p pen source soft reach a wider more than one p
As Dodge et often highligh overlooked in e M focuses its att on OSM display
base, which, as ooks the same a rapid update
VGI
heavily on op y commercial o pping suites. M
output, wher een in the foref le on an open a search, and, mo
he growing VG gged behind con vey, for instanc at a number of
it was both li
are is vital t atives. Shao et t work that is u e open source using Sub levels of activ nt of a heavy or rather than a
r OSGeo softwa s a display of th
ct. From Shao e
far in the lead e it is one of th programmes, bu e authors worki
here have been are in less than g up rapidly!
of authors wor projects. This ftware, as share
r audience. Ab project, and a fe
al (2009) say hts how things r everyday life.” T
ention on impr ys the most curr s a result of con as before. Some towards a chan
pen source soft organisations su Many also rel re appropriate front for many and free basis to ore recently to GI community. nsiderably, but ce, has at last scales available icenced and ch
to the buildin al (2012) delve underway in OS software move Version Nu vity. Every SV y editing sessio a data editor.
are between Oc he number of au et al (2012), Tab
in terms of ve he longest runni
ut also as the ing on it than n over 0.25M
15 years. GeoT
rking simultane is one of the ed developmen out 15% of au ew to more than
“The
gure 21: Percen project.
o et al (2012) ors create essen ce projects an essful open sou l (2012), must ht be, create an
t before, work ined, and most umentation and
Figure 22: Usha borders
gle is probabl ices to the VGI est user base, form it has serv ster manageme
essful. Figure merous earlier ex
n in this pape ully to crises, a lable or donated
nStreetMap is cipation, requir dd to and edit t development of le where 90% o
ntage of authors From Shao et a
consider that ntial internal an nd possibly h urce authors an
ensure they kn effective user k well in the
t importantly h help from a net
ahidi sites in 20 , from http://ww
ly the best k I community, a owing to its l ved many VGI ent the Ushahid
22 shows ext xamples of Ush er. Ushahidi c and to use what
d.
a much mor ring more advan
he mapping ba f OSM in Germ f registered con
s working on m al (2012), Table
t these “bound nd external netw help harmonise
nd projects, acc now who their interface, be b community fo have back up i twork of partici
012 – some omi ww.ushahidi.co
known provide and MyMaps pr low entry skill I communities di sites are w tant Ushahidi hahidi site map continues to ac
tever software m
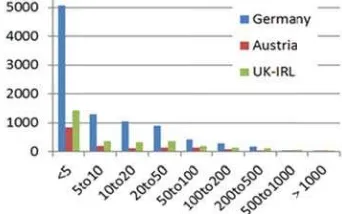
re complex p anced computer ase. Neis et al ( many. They prop ntributors do no
more than one e 1.
dary spanning” works for open e activity. All cording to Butt r intended user etter than what or which it is in the form of ipants.
itted at map om/
er of mapping robably has the l barrier. As a very well. For ell known and sites in 2012. ping have been ct quickly and might be freely
so sometimes, situation in all
Figure 23: Con
Figure 2
Dodge et al (2 what in OSM author – in a colour on the contributed 74 Quality can be 2008 onwards
Using a GPS t mapping sche longer necessa their interests but others wi either in full c map making. OSM site doe amateurs, who they see and Survey learnt to do with the cartographical perhaps not as
, and 1% do m l of life?
ntribution rates
24: OSM author
2011) provide a . Figure 24 sho all 124 of them map. Note that 4% of the map e checked as the can be display
to record spatia emes, but it do
arily qualified outside their fo ll at best be k control of their This is what n es provide a sig o probably lear edit their dat in the 1970s, g e ubiquitous br lly versatile pr s aware of this p
ost of the work
for OSM. From
rship defined by
a spatial dimen ows Bologna O m – being reco t as for German p data, and on e complete auth ed for comparis
al data enables es mean that th
land surveyor ormal job may keen amateurs instruments or national survey gnificant amoun rn rather quickl ta results. Also generating spag
readcrumb trail roduct. Many V problem as they
k; not an uncom
m Neis et al (20
y colour for Bol
nsion as to who OSM mapping, orded in a diff ny the top ten ed ne 18% of the horship history,
son with other d
a wide VGI inp he surveyors a s. Some will b
also include su and not neces of the theory b s come to fear nt of help onlin ly, on the job, o, as the Ordn hetti – as GPS l – does not m VGI enthusiast y should be.
mmon
012).
Neis OSM 2009 perce activ In th comp from The but f
logna, using IT
o does , each fferent ditors total. , from data.
put to are no be, as urvey, ssarily behind r! The ne for when nance tends make a ts are
Figu orig ins plu
’s rule roughly M is very active
9 nearly 50% o entage reduced vity in the disas he case of OSM
paring OSM w m TomTom and results indicate falls off conside
TO!’s OSM Map
ure 25: Standard ginal system in solation time in us LIDAR. See
applies for OS e in Germany a of all edits were d to 30%; poss
ster mapping ar M in Germany with, for examp
Navteq (Hakla e OSM display erably in rural o
pper service.. F
d GRASS produ the 1980s. Agg
northern Italy, http://grasswik
SM in the years and remarkably e completed, b sibly as a resul arena? Quantity y some tests ha
ple, commercia ay, 2010; Zielst ys good detail ones.
From Dodge et a
uct, still much t gregated weekly including shad ki.osgeo.org/wik
s 2008 to 2011. y complete – in ut by 2010 the lt of increasing y is not quality. ave been made al routing data tra et al, 2010). in urban areas,
al (2012).
the same as the y astronomical dows. 5mx5m
The most vene the GRASS G Engineers in 1 data sets and latest release, engine and s GRASS has b support an e including OGC managed in a also enhanced
Figure 26: colourised by
Cartography a using the posts main GIS disp In addition, G popular open well pass the requested. Th component. Ju able to display user’s geograp
An example o 2012, ht programmes-2 portal/) where INSPIRE (ht (http://www.eu 120 portals rev support quanti policy researc (FOSS) comp have been dev
erable open sou GIS, first deve 1982. It was an its use have d has introduced support for ve been integrated extensive rang C-conformal Si a SQL-based D d to display 3D v
Building footp y building type.
and journal qu script hardcopy plays using the GRASS data m n source mapp
.
als
y try to prov e data sets them a and search an e user to othe his does not ust the opposite y their wares a phical and them
of a rather diffe ttp://www.wise 2008-2011/data e although the ttp://inspire-geo urogeoss.eu/def viewed by the a itative and qual ch. WISERD u ponents and se veloped by the W
urce mapping c eloped by the n entirely raster diversified grea d a new topolo ector network d with the GDA e of raster a imple Features DBMS. The vis
vector data and
prints extruded GRASS produ
uality figures c y authoring tool PostScript, PN may be exporte ping software
vide access to mselves. As such nd discovery p er sites to co mean they h e may well be t and interact me matic questions t
erent portal is W rd.ac.uk/researc -integration-the e principles ar oportal.ec.europ fault.aspx), the authors – was th litative social sc ses free and op rvices. A rang WISERD Data
apability is pro US Army Co r system but bo atly. GRASS 6 ogical 2D/3D v analysis. Inter AL/OGR librari and vector for . Attributes are sualization tool d voxel volumes
to 3D block, an uct for Trento, I
can now be cr l or directly from NG, or Cairo dr
ed for use in such as GM
data sets, bu h they are conc processes. They llect any data have no geos true as they mu eaningfully wit to provide answ
WISERD (Fry ch/phase-1-rese eme/the-wiserd re the same a
pa.eu/) or GE
application – o he only one tryi cience academi pen source sof ge of software
Integration Tea
ure standards c nomic data sour and text-based
SYNERGIST
wdsourcing is n idered the natu ple, motorised
los et al (201 erage of the pos
type or another
ure 27: Urban m digital worlds.
uitable paradigm from Resch et ween the physic
bject terror!
achines are to b VGI, CGI, or dards are requir l (2007) wrote ne the standard he possibility o ices through th ering: Langu surements (cou guage; Sensor a Web Notificat
SWE aims to en stems, observat ternet. This p nsor’s capabili
sensor parame rocess and geol r time-series o ncodings” (Bott
result is that p c sensors, trans tion on the Lon dd to their VGI s into environ ome very impor
nings, or tsun eillance system
compliant meta rces, and the W
search tools fo
IC SENSING –
not limited to ure of machine transport, or st 1), and Resch sibilities and in and their use in
monitoring - con From Resch et City Lab, 2
m to represent th t al (2011) w al and digital w
be successful se authoritative red so that they
the OpenGIS s and formalise f interoperabili e Sensor Web E age (Sensor unterpart to Sen Observation, P tion Service.
able the discov tions, and obser process compr ities and qualit eters that autom locate observat observations an s et al, 2007).
people are now sport informati
don Undergrou content and to nmental crises
tant, and ubiqu ami tracking. ms, hopefully for
adata for a va WISERD Geo P or accessing this
– PEOPLE + S
humans! Many e sensors, whet
tatic. See Bott et al (2012) nteractions betw n the environm
nnections betwe t al (2011), from 2009).
his situation is which shows t world; one of e
ensors and full data collection may transmit t white paper fo e the structures ity and spawne Enablement In rML); Obser nsorML); a Tra
Planning and A
very and queryi rvation procedu rises determin ty of measurem matically allow tions, retrieval nd coverages
w able to use m ion – such as t und system disc o inform their a
and disaster uitous, be it for
The possibili r the public ben
ariety of socio-Portal provides s database.
SENSORS
y authors have ther carried by ts et al (2007), for interesting ween sensors of
ent.
een the physical m (SENSEable
given in Figure the connection either great fun
l participants in n process then their data. Botts or the OGC to s used. This led ed many sensor itiative (SWE), rvations and ansducer Model Alert Services;
ing of sensor ures over the nation of a ments, access w software to of real-time in standard
-3.1 Use of M
OGC Open G information us message servic
Figure 28: Lef al, 2011). R
bicycle cou
There are man in disaster man sites, or as giv project, to mo (CO, NOx), n sensor technol mounted sens shown on the r
The now com text service ha crowdsourced dynamic resp could not be painful and slo
Air photos can been common used to updat survey in othe This has chan survey instrum trained staff is on a largely al gather informa
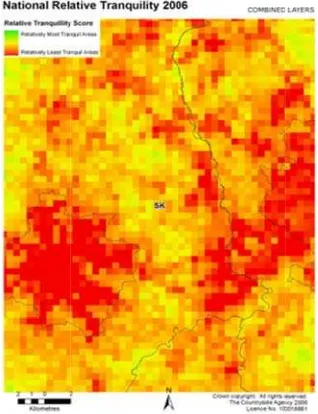
But these ban Indeed, they collecting them project may no for data collec the map shee created by the to Protect Rur 500m square r tranquillity sc participation. according to a rural idyll.
Mobile Devices
GeoSMS provid sing the text SM ce in use can be
ft, alert messag Right, map of C uriers for the O
ny possibilities nagement proce ven in Resch e onitor air quali noise, and weat logy in the latte sors used in C right in Figure
mmonplace GPS ave led to a rap material, and onse and upda used in this m ow if it involve
n be used to ide n practice for l te detail in man ers. The latter p nged markedly ments, but main s still a major co ltruistic band of ation for timely
nds of voluntee are becomin matic data for p
ot be organised ction, refinemen et for Derbysh
Tranquillity pr ral England), w raster for Engla core for each Red indicates a variety of me
des a means of MS service. An e seen on the le
ge example, sent CO in Copenhag
pen Scents pro 2012).
for using this edures at some et al (2011) in t ity capturing d ther parameters er case is the u Copenhagen. Th
28.
S, mobile phon pid growth in th
most importan ating. A decad manner, updati
d trips to the fie
entify change th land survey. T ny cases, or at process was ne with the arriva ntaining a suffic ost limitation. T f editors roamin y updates; a maj
ers are not limi ng increasingl projects they pe d by volunteers nt and update. hire shown in roject, run by th where Jackson e
and showing a q h cell by crow
qualitatively a asures used, an
f sending geos n example of s ft in Figure 28.
t by SMS (Bou gen, generated oject (Resch et a
service, for ins of the Ushahid the Common S data related to s. A novel aspe
se of courier bi he resulting m
ne and its assoc heir use in gath ntly, now allow de ago, when
ng of any sort eld.
hrough time, an The photos cou t least guide gr ecessarily very al of small GPS
cient body of su Today OSM can ng the countrys jor change.
ited to basic su ly concerned
rceive essential , but uses VGI One such exa Figure 29, wa he CPRE (Camp et al (2008) crea qualitatively de wd sourced p a least tranquil nd green expose
spatial
gure 29: CPRE ering Derbyshir solution of grid
came apparent p a check on
eived level of t ome areas. T nomically and m mobile phon
ntryside, record 011) conducted ynamic geospa involvement, ibilities of the c
gure 30: Infillin geo-d
major problem eys tend to be ile signals caus survey required s of the country other hand the p
volunteers cou or data could b ning at the co ming multimed
E Tranquillity su re. From Pawlow
cells of origina 500m
that it would b dynamic and tranquillity, and he only way efficiently was nes that, as th
ed position, voi d the survey and atial survey cam
and the iterativ collection proce
ng dynamic upd data. From Paw
with the tech conducted in sed difficulties. d some crowd tr yside required lo process was suf uld be used, dep e transmitted au ntrol centre m dia data was full
urvey of Englan wicz et al (201 al CPRE survey m.
be useful to upd d fluctuating c d to provide hi this could b s by using VG the volunteers
ice, and photos nd concluded th
me from its ad ve repetitive re ess.
dating with mul wlowicz (2011).
hnique was th rather rural ar Also the qualit training. Mobili ots of volunteer ufficiently flexib pending on typ
utomatically, li might be deve ly and reliably
nd, SK sheet, 1). Note coarse y, at 500m by
date this map to changes in the igher definition e done at all GI data derived traversed the s. Pawlowicz et at the strengths daptability, the al time control
ltimedia VGI .
3.2 Problem
Using mobile information st temporal chan support them. defined what h three tempora time, and obje
Figure 31: Sia
Siabato’s tri-te models propo Siabato consid states that mig able to enrich
Figure 32: Wo than snapshots
Worboys, in geodata and a “what happen changes occur is no clarity a change points fabricated. Th rather than a versioning sy possible. This national map s
This is not a p through the ed frequency and
ms with Time an
devices and se tored requires a nges occur an Siabato et al ( he called a Tim al axes: databas ect creation time
abato’s three tim Point. From S
emporal model osed by Worbo ders his formula ght occur as the
the temporal re
orboys (2005) a s.
2005, conside a comparison b ned at a given r?” Most maps about how map s are recorded he advantage snapshot histo ystems, is that s is not the cas
series with 20 y
problem with O dits to earlier f d rapidity of ed
nd Update
nsors to update an understandin nd what type (2012) address ming Point whic
se recording tim e (see Figure 31
me axes needed Siabato et al (20
has an extra ax oys (1998) and ation essential t e creation time a elations between
approach to reco
ered event-orie between the sn time?” as opp follow the first p one changed i then a comple of maintaining ory, equally im recreation of se with snapsho year updates.
OSM, as it is p forms of the ma dits in OSM is
e and edit previ ng of the way sp
of structures m ed this problem ch was measure me, object chan 1).
d to define a Tim 012),
xis to the bi-tem d Snodgrass (1 to correctly rela axis is required n features.
ording change r
ented approach napshot approa posed to “when t approach and into map two. ete history mig g a change h mportant in sof the entire eve ot histories; see
possible to peel ap; little is lost illuminating. F
iously
shows the OSM ium from Au pleted. It is dif pared with natio
Figure 33: OSM
4 I
onal surveys d r than for topog e significant 3D ities, or way f r centres. This s dchild (2009) m his area particu s provided by ance, now exis ping, not just s ey and naviga ding. Experimen beacons, inerti asound and laser oach or the bas
Indoor and U
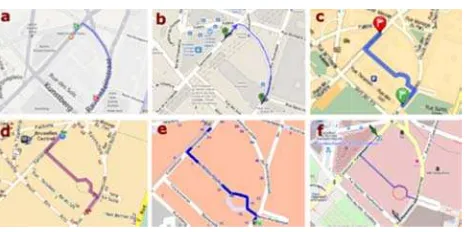
gure 34: Route c Mappy, (d) OpenRouteS
ome places ped exist, and navi ely linked. Van routing algorit w.bing.com/ma
py (www.map
M mapping fo g 2008 to Au fficult to fault onal maps.
M mapping of Lo Perkins (2
NDOOR AND
o not traditiona graphy. In partic D surveys of bu finding throug situation is chan made particular
ularly in urban y CityGML (h st to achieve f spaghetti boxes ation can best
ntal technologi ial navigators, rs, but none has is for standards
nderground R
choices from (a ) Via Michelin, ervice. From V
destrian pathwa igation through nclooster et al (2
thms from a aps), Google M ppy.com), the
or the UK Lo Aug 2011 as e
the OSM map
London Olympic 2011).
D 3D MAPPING
nally map the th cular few publi uilding interior gh indoor urba anging, but so fa
point of the ne n centres. The
http://www.city full 3D structu s. But it remain be performed ies are available local extens s yet emerged a s.
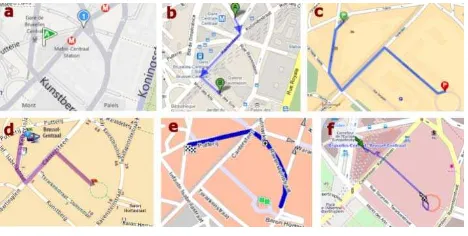
Routing
a) Bing ,(b) Goo , (e) RouteNet a Vanclooster et a
ay mapping thr h interior and ex (2012) tested th number of Maps (www.goo Via Michelin
ondon Olympic each part was p update speed
c site, From
G
hird dimension ic organisations s, underground an shopping or ar quite slowly. eed for progress standards and ygml.org/), for ured connected ns unclear how d internal to a e based on Wi-sions of GPS, as the dominant
ogle Maps, (c) and (f) l (2012).
(www.viamichelin.com), RouteNet plan (www.routenet.com), OpenRouteService (http://openrouteservice.org) and Naver – in South Korea (http://maps.naver.com). Brussels in Belgium was used for most of the tests, but Seoul in Korea was chosen for one of the underground experiments.
When calculating the shortest path in Brussels both (Figure 34) Bing and Google do not use a gallery as a short cut, whereas the others do so; Bing does not show the route, but Google Maps does provide a name, but not a route. The conclusion must be that some networks do include interior pathways accessed by above ground entrances in their shortest route calculations; others did not have indoor networks at the time of the experiment.
The underground Myondong shopping centre in Seoul lies beneath a wide and very busy road, with entrances at either side of the road. This made a good test of routing software: would the calculated path suggest going down, through the shopping centre, and then up on the other side of the road? Only Naver was able to provide pedestrian routing in Seoul, and it did successfully find the route; definitely a case of “Why did the chicken survive crossing the road? Because it’s route planner did know the underground path.”
Figure 35: Brussels Central Station to Ravensteingallerij using route planner (a) Bing ,(b) Google Maps, (c) Mappy, (d) Via
Michelin, (e) RouteNet and (f) OpenRouteService. From Vanclooster et al (2012).
A further test was conducted in Brussels to see if underground entrances and exits were part of the route planner’s database. The test route went from the main railway station via an underground connection to the Ravensteingallerij (see Figure 35). Only OpenRouteService used all available entrances and underground passageways to progress directly to the gallery. The other networks were less successful. In many cases, for all route finders, the address translating process to convert to geo-location on the map were rather simplified. For instance all the route planners used one entrance/address point for route planning, no matter what the destination of the query, while railway stations are well known for having several entrances, owing to their considerable size,
These tests show that the data for the route networks in these Brussels and Seoul examples were incomplete when the tests took place, not that the route finder algorithms per se were inadequate. All data providers add as much extra spatial data and information into their networks as they can, but update and discovery take time, and this leads to inadequacy in some locations. Until the last few years most commercial data providers did not use any VGI or CGI spatial data to update their networks. Now, more are doing so as it becomes very clear that organisations such as OSM can provide accurate useful information. For example, Google Maps – definitely in the CGI
camp for data acquisition – has started to make increased efforts to use this huge human resource to improve its mapping.
4.2 Crowdsourcing Indoor Geodata
The inside of buildings provides a fairly difficult VGI survey environment because of the non-operation of most easily understood GPS handheld devices. Other means are becoming possible using 3-axis accelerometers and the 3-axis magnetometers available in many smart phones and even a piezometer implanted in a Nike running shoe (Xuan et al, 2011). But, the kit and skills required are not yet commonplace. Added to the sudden change of scale, and therefore desired locational accuracy, when moving across the interface from exterior survey to interior mapping there is the question, as discussed by Vanclooster et al (2012), of address matching with possible multiple entrances to the same building. Lee (2009) has considered the address interface problem and comments on the orderliness of some exterior addresses and the disorganised nature of many interiors.
One of the most prolific authors dealing with 3D city models published in the last few year has been Goetz (Goetz and Zipf, 2011 and 2012; Goetz, 2012) who discusses the CityGML standard for storing and exchanging 3D city models, and the progress of modelling, mostly with German examples. As he points out, different regions in the world have different desires and therefore different standards that need to be met in their 3D models. According to Haklay (2010) and others OSM is often able to exceed official or commercial data sources in terms of quality and quantity.
Figure 36: Levels of Detail (LoD0 – LoD4) defined in CityGML specification
CityGML defines a number of Levels of Detail (LoD) for modelling purposes: LoD0 is the plan view of a 2.5D terrain model, LoD1 is a simple extruded block rendition, LoD2 is textured with roof structures, LoD3 is a detailed architectural model, and LoD4 is a full “walkable” 3D model.
As we have seen, most routing systems focus on a 2D network specification and cannot cope easily with a 3D model. Goetz proposes:
This would appear to be a very useful contribution to both mapping and routing services, and the use of OSM to provide much of the ground truth data would prove invaluable in terms of both time and money.
Figure 37: Increase in use of the “building” (blue) and the “indoor” key for OSM additions from 2007 up to 2011. From
Goetz and Zipf (2011).
There are now about 45M tagged buildings in OSM with approaching 0.5M added every week (Goetz, 2012); not all are fully rendered, but many are well above LoD1. This rate of building increase is currently higher than that for roads, which, although standing at about the same total, increases by perhaps 0.2M per week. See Figure 37, which shows the increase in usage of building and interior keys between 2007 and 2011.
Describing and modelling buildings requires a common understanding of terms and importance. Ontologies have been developed to allow not only questioning, searching and joining, but also to allow routing and navigation. Yuan and Zizhang (2008) proposed an alternative navigation ontology, but one that did not concern itself about colour or other non-essentials to navigation. Goetz’s ontology is kept simple, but allows realistic visualization of the building as well.
It would appear from the foregoing that much of the present work on buildings, both exterior and interior is being performed by OSM crowdsource enthusiasts; many of them very skilled. Who should be the crowdsourced agents for making the building models? Rosser et al (2012) say that perhaps the buildings occupants are those best placed to make the most satisfactory models; to them at least, and who has a better claim?
As time passes and the number of building edits shown in Figure 34 increases exponentially, it is likely that much of the activity will turn to editing and the improvement of the quality of OSM submitted buildings, where in some cases exuberance may have dominated accuracy. The open source tools to make and use the models have been generated, the skills are present in some quantity, and the ontologies are defined to allow the buildings to be more than a pretty object; they can become full network models.
4.3 Indoor Google
Google in its various mapping guises has for many years been the mainstay for providing base maps for the crowdsource community. The main commercial spatial data providers were for many years Navteq, TeleAtlas and Google. Historically, Netherlands based TeleAtlas and North American Navteq were used in many navigation applications.
Since Nokia (http://en.wikipedia.org/wiki/Navteq) bought Navteq in 2008 and TomTom acquired TeleAtlas, also in 2008 (http://en.wikipedia.org/wiki/Tele_Atlas), there has been a clear
separation where each navigation specialist was responsible for its own data sets. But in 2011 Garmin bought Navigon AG (to capture the iOS and Android navigation apps market where Navigon was dominant. This was an important step for Garmin because all portable navigation devices had been losing ground to smartphone navigation apps, a market that Garmin had not entered before. Interestingly in June 2011 Navigon had introduced a PoI package derived from the crowdsourced OSM project.
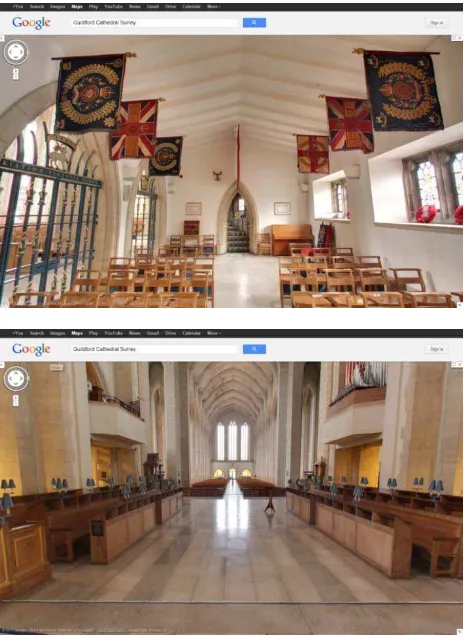
Figure 38: Interiors of Guildford Cathedral, showing the indoor online possibilities of Google’s Street View. A full walk about
is very possible. Google Guildford Cathedral.
Catherine Palace and Ferapontov monastery, Taiwan's Chiang Kai-shek Memorial Hall, Vancouver's Stanley Park, the interior of Kronborg Castle in Denmark, and Guildford Cathedral in Figure 38.
This interest on Google’s part in interiors and encouraging both Street View but also crowdsourced participation may herald the start of complete routing systems that do understand 3D buildings, their interiors, the underground passages, and the car parks that go to make up the modern city. It will then be very interesting to apply Vanclooster’s routing tests again and see whether the 3D information gathered by VGI, CGI, or PGI means, allows accurate shortest/fastest guidance through the urban maze.
5 WHITHER SPATIAL ONTOLOGIES?
Shanahan (1995) is quoted in Bhatt (2008) as defining spatial ontology as:
“If we are to develop a formal theory of common sense, we need a precisely defined language for talking about shape, spatial location and change. The theory will include axioms, expressed in that language, that capture domain-independent truths about shape, location and change, and will also incorporate a formal account of any non-deductive forms of common sense inference that arise in reasoning about the spatial properties of objects and how they vary over time.”
The idea that common sense is vital and will be used while reasoning with and about spatial objects is to be applauded. The understanding and semantics of geographical concepts vary both between user communities – VGI or PGI based – and need ontological formal languages and structures to represent the concepts used by any information community. Stock (2008) argues that, as human semantics can be extremely informal in nature, “Perhaps NSDIs have been too formal and do not account for this human flexibility?”
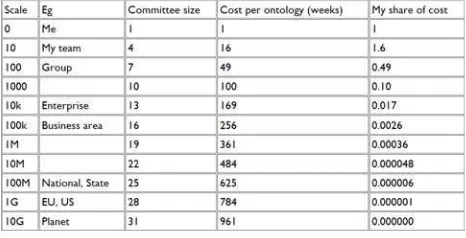
Berners-Lee (2005) tried to estimate the effort involved in ontology creation. The table in figure 39 shows his results.
Figure 39: Berners-Lee (2005) Total cost of ontologies.
This table assumes ontologies are evenly spread across orders of magnitude, committee size is reasonably represented by log(community), time is community**2, and costs are shared evenly over the community. The scale column represents the community size from which the committee size and costs are calculated. The general conclusion is that the cost of large efforts is huge, but it is borne by and benefits an even larger group and so the cost per individual is very, very small indeed.
A large effort is required to build an ontology for a particular domain. This is a disincentive for groups who might create
ontologies to suit their own circumstances. Also, why should there be a single ontology, and why in English, which might act as a constraint to some non-English semantic ontologies (http://en.wikipedia.org/wiki/Linguistic_relativity)? Perhaps variety and semantic translation and interoperability would be a better approach? The figures in the table argue strongly in favour of large group participation and might be thought to be a good prospect for professional crowdsourcing, as with standards and software open source projects?
GIS has used standard forms with attached labels since it appeared as a discipline (Evans, 2008). Researchers consider a good representation of the world assumes: there is only one type of object in a given space; several in one space would be identical, and that everyone would use the same descriptive terms and labels. In practice this is not so; we are all our own experts with different mental formulations of the world around us brought about by different experiences and upbringing in society.
Despite this problem with diverse groups OSM has built an open ontology from scratch (Dodge, 2011). Many of the people most actively involved in the ontological development of OSM, whilst skilful and self-motivated, do not have a cartographic background. This often leads to lively debates about the ontology for OSM and some new thoughts about how maps should look and work. The difficulties are usually ironed out by social negotiation to determine the best understanding of the objects in question. As time passes so OSM’s ontology is becoming more complex and useful, but partly as the result of considerable mental anguish amongst the contributors and editors.
5.1 Vagueness
Much time and effort is involved in defining ontologies of spatial objects; possibly even more in recognising, defining and categorising the objects in a formal manner so that they can enter an ontological description. A major problem of the real world is that although an object is definitely present it can rarely be described by a single term, or multiple occurrences by the same exact definition. Our desire to classify is confounded by vagueness of description.
A traditional example of this problem is: when does a pond become a river, become a lake, become a sea (Third, 2008)? Scale is one factor, form is another, salinity might be a third, and so on. Our descriptors are unclear and suit our thinking, perhaps. This problem of vagueness could be overcome by choosing to ignore insignificant parts, but insignificant is also vague and undefined in most cases. Humans tend to skip over insignificant deviations. A serious problem in developing an ontology is to define the terms to be used within it.
Bennett (2008) discussed the standpoint theory of vagueness and showed how apparently impossibly difficult semantic problems – is this a river or an estuary? Is this a heap or merely a pile? – could be expressed using supervaluation semantics (Bennett, 2008) to enable vague human language to be logically interpreted by a set of possible precise interpretations (called precisifications), providing a very general framework within which vagueness could be analysed within a formal representation and handled by computer algorithm.
definitions is geographers f (for instance picking a relev possibilities w
5.2 Moving f SDIs?
Bennett et al whether peopl the expansion questions to b now being dev ontology mat available, or u external resou Janowicz et al Enablement L the Semantic W et al (2010) s Resource Desc OSM data set service for sea
Stock et al (2 register contai rather than an contain a voc could use, pro assist interpret dealing with f enable flexibl form an impo expression wi ISO’s FTC w and by adding compliant regi richness of in language or U
Stock’s appro benefits: easy SDI where it providers (per management WSML) and s able to conclu flexibility in s including chan language inter
5.3 Standard
International s by crowd sou awareness am problems invo been addresse complexity o groups: OGC (www.isotc21 from previous Cole and Kin vant finite set o was difficult!
from Ontology
(2007) require le recognised an n of the seman be asked. Du e veloped to perfo tching based using lexical and
urces and pri l (2010) though Layer for an SD
Web was an im suggested using
cription Frame t, within the Se arching and que
2010) has prop ining a Feature
n ontology to cabulary of term
ovide what Sto tation of the re feature types. T le response to ortant link betw ithin an SDI. S within the OGC g stored querie istry. The FTC nformation an UML rather than
ach, stressing t navigation to c
has been buil rhaps as in the
of the gap be static content o ude that non-on solving comple nge through tim rpretations.
ds Equals Qua
standards exist, urced data col mongst many
olving geograp d and mostly m f the standard (www.opengeo 1.org/Outreach
0) while writin the act or proc nformation reg
. Along with m academic quan g, 1975), Benn of regions from
y Feature Type
ed: more forma nd approved th ntic structures et al (2012) rep orm automated
on shared up d structural info ior matches ( ht a shared and t DI, integrating mportant missing
g the LinkedG ework (RDF) im
emantic Web, erying geodata.
osed the idea Type Catalogu support SDIs ms that both c ock calls a ligh egistry contents This formulation
operations on ween implemen She suggested t C’s Web Catalo es allow interro s could store v d be expresse n in formal onto
the use of the F content, simple lt or is being u
case of OSM) etween web se ontology. By 20 ntology approa ex geographical me, vagueness,
ality?
, and are used, llectors, partly crowdsource e phical descript met, and partly ds generated b ospatial.org/stan h/ISO_TC_211_
g about standar cess of combini garding one o
many generatio ntitative revolu nett discovered m an infinite ran
e Catalogue Ba
al semantics, te e formal results to allow locat port many tool and semi-autom pper ontologie ormation, user i (Noy et al, 2 transparent Sem query services g element. Hah GeoData project reators and da htweight ontolo s, and a structur
n would, Stock a feature type ntation and sem the incorporati ogue Service (C
ogation of the variable amount ed either in na ology language.
FTC, provides er management
updated by mu ), and an end t ervice (eg OW 011 Stock et al aches provided l research prob and varying n
, but not neces y owing to lac
enthusiasts tha tion standards
due to the nece by the internat ndards/gml) and _Standards_Gui
rds said: ing or associat or more entit
ons of
onsidered in an improve one’s r detection, id ntity.”
at is a map but a onal or region en, and assume able (same prob
opriate for the p k (2008).
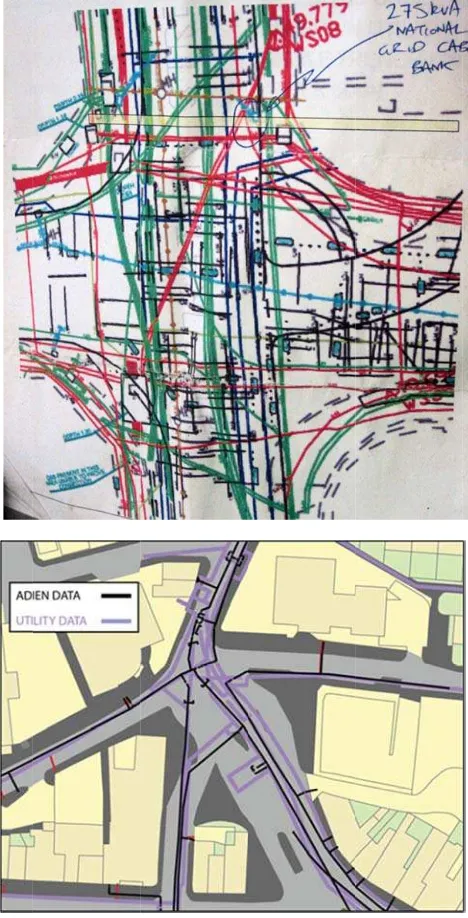
gure 40: Top, u same juncti
ical mapping of Figure 40, gain ate, showing a m
tion. The map er smaller scal ty lines. It pr raction, not real
explicit or imp s capability (or dentification, o
a fusion process nal mapping ag
they: are corre blem), and tha purpose of the
tility survey da on on the finali
f a real world s ned from groun
multitude of uti on the right is e with general rovides a clea lity. It also mee
plicit knowledg r provide a new or characteriza
s? Most people agencies, either
ect (whatever th at the level of
map. Look at F
ata at a junction ised map (Beck
situation is reve nd survey and ility lines
criss-a plcriss-an of the criss-a lisation of both ar interpretatio ets standards, m
ge framework w capability) ation of that
see maps from r on paper or hat means), are f abstraction is Figure 40, from
n, Bottom, the k, 2008)
but is not precise, nor is it complete. There are many ways of storing data, here on paper or in a GIS, and several ways of structuring the data using a variety of syntactic and schematic models. What is needed, as proposed by Stock and others listed earlier in this text, is the ability to integrate models based on global schema and perhaps to use Bennett’s standpoint theory to help remove vagueness from the mix.
Mary McRae, until 2010 working with OASIS (Organization for the Advancement of Structured Information Standards), is well known for a presentation containing the slide “Standards are like parachutes: they work best when they're open”, possibly derived from LE Modesitt Jr, or was it Frank Zappa, or Elvis? The point is well made, however. Open standards are essential if people are to be willing to use them. They must be, according to OSGeo, freely and publicly available, non-discriminatory, with no license fees, agreed through formal consensus, vendor neutral, and data neutral. Note that open standards does not mean open source. Standards are usually documents; sources tend to be software. See the paper from OSGeo on this subject – Open Source and Open Standards at http://wiki.osgeo.org/wiki/Open_Source_and_Open_Standards.
The OGC recommends many geospatial standards to users, including GML (Geography Markup Language) as its base. See http://en.wikipedia.org/wiki/Geography_Markup_Language. GML is the XML grammar for expressing geospatial features. It offers a system for data modelling and as such is used as a basis for scientific applications and for international interoperability. It is at the heart of INSPIRE (Infrastructure for Spatial Information in the European Community), the European initiative, and for GEOSS (Global Earth Observation System of Systems). See http://inspire.jrc.ec.europa.eu/index.cfm and http://www.earthobservations.org/geoss.shtml. New standards from OGC are continuing, with community-specific application schemas introduced to extend GML. GML 3.0 is a generic XML defining points, lines, polygons and coverages. It extends GML to model data related to a city using CityGML for representation, storage and exchange of virtual 3-D models. There was a workshop in January 2013: CityGML in National Mapping. See http://www.geonovum.nl/content/programme-workshop-national-mapping.
Other standards include: the Web Feature Service (WFS), for requesting geographical features; the Web Map Service (WMS), for requesting maps using layers, to be drawn by the server and exported to the client as images; and the Styled Layer Descriptor (SLD) which provides symbolisation and colouring for feature and coverage data.
The OGC is an international organisation, but so is ISO, and both generate standards for the geodata community to use. The OGC was started with mainly industrial, commercial and some research membership, whereas ISO, in the form of Technical Committee 211 (ISO/TC211), was instituted as a completely independent body with members delegated by participating nations, usually but not always from appropriate national standards bodies. Both operated in the same field but, fortunately, for many years OGC and ISO have cooperated closely in standards specification to the benefit of both. Recently ISO/TC211 has published the text for standard 19157, Geographic information — Data quality, to specify standards for ensuring that quality of geographic information can be implemented, measured and maintained. The data quality elements consist of: completeness of features; logical consistency, adherence to data structure rules; positional accuracy within a spatial reference system; thematic accuracy
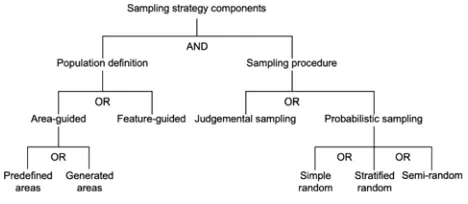
of quantitative and qualitative attributes; temporal quality of a time measurement; usability element based on user requirements; and lineage: provenance of the data. Interestingly, all but logical consistency need to be verified by some ground truth action. The standard proposes that different methods of sampling (see Figure 41) will be necessary for different data types.
Figure 41: Choosing a sampling strategy for quality checking by logical feature or by areal selection (ISO/TC19157).
There is flexibility as to which strategy is chosen based on either a complete population survey, probabilistic or judgemental sampling procedure. The choice depends on the data being tested.
6 ACCURACY, QUALITY, AND TRUST
Figure 42: MODIS (top) and GLC-2000 (bottom) satellite images covering a 20km x 20km area around the UK town of Milton Keynes, showing automatic classification by different but standard approaches, to indicate similar land cover classes. In both images deep pink is cropland or natural vegetation, red