DESCRIPTION AND ANALYSIS OF THE GAMBIA
SOLE STOCK ASSESSMENT 2012
FEBRUARY 2013
2
The work herein was supported by the USAID funded Gambia-Senegal Sustainable Fisheries Project (BaNafaa). The BaNafaa project is implemented by the Coastal Resources Center at the University of Rhode Island and the World Wide Fund for Nature-West Africa Marine Program Office (WWF-WAMPO) in partnership with the Department of Fisheries and the Ministry of Fisheries and Water Resources. Data collected by the Atlantic Seafood Company and Lamin Sanyang. Analysis conducted by Salifu Ceesay and Amadou Jallow from The Gambian Department of Fisheries and Christopher Parkins and Kathleen Castro from the University of Rhode Island.
Citation: Cessay, S., Jallow, A.,Sanyang, L, Parkins, C and K. Castro. 2013. Description and analysis of the Gambia sole stock assessment- 2012. pp. 13
Disclaimer: This report was made possible by the generous support of the American people through the United States Agency for International Development (USAID). The contents are the responsibility of the authors and do not necessarily reflect the views of USAID or the United States Government. Cooperative Agreement # 624-A-00-09- 00033-00.
Cover Photo: USAID/BaNafaa project/World Wide Fund for Nature-West Africa Marine Program Office (WWF-WAMPO).
Photo Credit: USAID/BaNafaa project/WWF-WAMPO
3
Table of Contents
INTRODUCTION ... 4
LENGTH WEIGHT RELATIONSHIP ... 4
Methods ... 4
Results ... 5
CONDITION FACTORS OF RED AND BLACK SOLE ... 7
Methods ... 8
Results ... 8
ESTIMATION OF THE LEVEL OF EXPLOITATION ... 9
Methods ... 9
Results ... 10
REFERENCE POINTS ... 11
SUMMARY, CONCLUSION AND RECOMMENDATIONS ... 12
REFERENCES ... 13
List of Figures Figure 1: Ln(length) vs ln(weight) plot for Red sole ... 5
Figure 2: ln(length) vs ln(weight) plot of Black sole ... 5
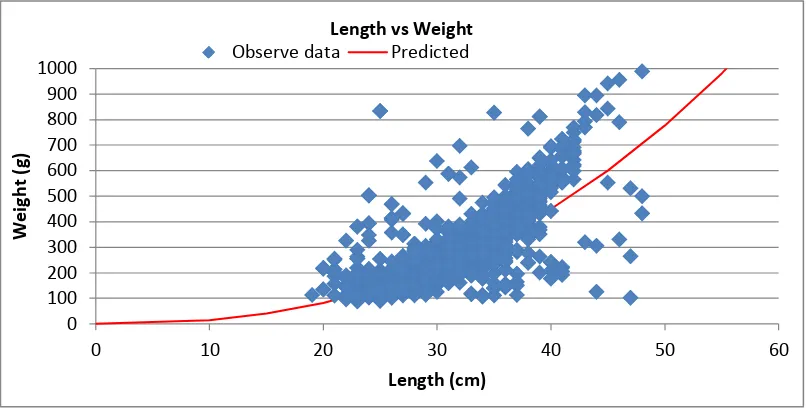
Figure 3: Length- weight of Red sole... 6
Figure 4: Length-weight of Black sole. ... 7
Figure 5: Condition factor for Red and Black sole with standard error bars. ... 9
Figure 6: Results of LCCA for red sole ... 10
Figure 7: Results of LCCA for black sole ... 10
Figure 8: Reference points for red sole. Fmax = 0.87 and F30% = 0.51. ... 11
4 INTRODUCTION
This report presents the stock assessment of the Gambian sole fishery for the January-December 2012 period. Although several species of sole fish are reported to inhabit the coastal waters of the Gambia, two species predominate the catch and landings: Red sole (Cynoglossus
senegalensis) and Black sole (Synaptura cadenati) (DeAlteris et al., 2012). The species have been aggregated in the first sole stock assessment as an attempt at estimating preliminary values of fishing mortality (Medley et al., 2008). The purpose of this report is to summarize what is known for the resource in the Gambia in 2012.
The Atlantic Seafood Company has provided a sub-sample of length-weight measurements of red and black sole for 2012. They additionally provided length frequency data that was used to estimate the level of fishing mortality.
LENGTH WEIGHT RELATIONSHIP
Length-weight relationship studies typically entail estimation of mean weight of fish of a given body length, and conversion of length-growth models to corresponding weight growth models. Since variation in weight appears to be high for the Gambian sole, determination of body
condition factors (an interpretation of relative well-being and maturity was a conducted to see if variations could be explained with spawning condition change. This stock assessment assesses the length-weight relationships of Red sole (Cynoglossus senegalensis) and Black sole
(Synaptura cadenati).
Methods
Length-weight data have been collected for the individual species by the Atlantic Seafood Company from January 2012 to December 2012. A total of 4054 Black sole and 4324 Red sole were measured and weighed.
Two methods were used: a linear regression on the Ln W and ln L; and a non-linear method using Excel Solver where parameters (a and b) of the length-weight relationship function were estimated using the equation:
W=aL
bWhere W = weight (g), L = length (cm), a (y-intercept) is the initial growth coefficient, and b (slope) the growth coefficient. After logarithmic transformation, the above equation may be expressed as a linear function:
5 Results
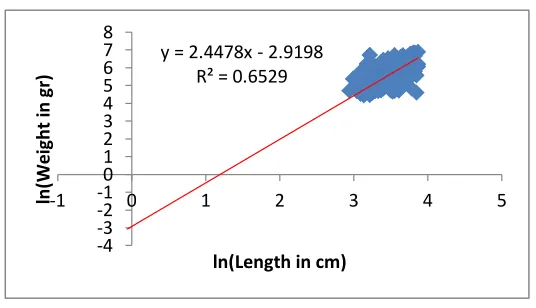
Prior to regression analysis of lnW on lnL, ln (Length) was plotted against ln (weight) to determine the slope (b) and y- intercept (a) of both Red and Black sole ( Figures 1 and 2).
Figure 1: Ln(length) vs ln(weight) plot for Red sole
Figure 2: ln(length) vs ln(weight) plot of Black sole
y-6
The final values of the parameters in the linear model are presented in table 1 for red and black sole.
Parameters a b
Red 0.18 2.0
Black 0.054 2.45
Table 1: Linear model estimates of parameter values for Red and Black sole.
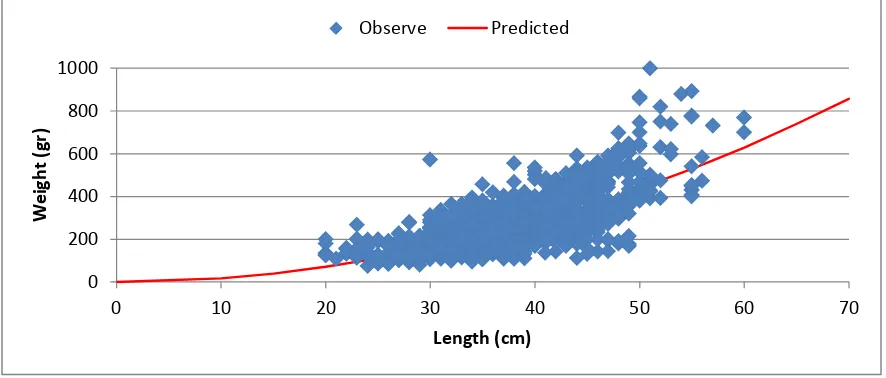
The data were then fit to a non-linear model.
A data series of length was created and weight was solved using the length-weight equation (W=aLb) and the parameter values obtained. The non-linear method consists of a table where the three columns are the observed weight, the predicted weight and the squared difference between the observed and predicted weight. Values for the model parameters a and b are
7
Figure 4: Length-weight of Black sole.
Table 2: Parameter values for Red and Black sole using non-linear methods
CONDITION FACTORS OF RED AND BLACK SOLE
As a great deal of variability is observed in the length weight relationship, the condition factor was explored as a possible explanation. As fish spawn, they change weight. Measures of fish condition are thought to be reliable indicators of the energetic condition or energy reserves of fish. Abowei (2009) found that for red sole in Nigeria, K values vary over the season because of spawning activities with the lowest K value found during the spawning season (Sanyang et al., 2011). Fulton’s condition factor (K) has been widely used by the fisheries profession. Fulton’s condition factor assumes isometric growth (b = 3, fish shape does not change with growth) and is calculated as the ratio between the observed weight and an expected weight dependent on the fish’s length. The formula for calculating K:
8
Where w=the weight of the fish (g), and L=the length of the fish (cm)
Methods
Fish were examined by their body condition index (K) in each month. Fulton’s condition formula above was then used to estimate the growth condition factor k for red and black sole.
Results
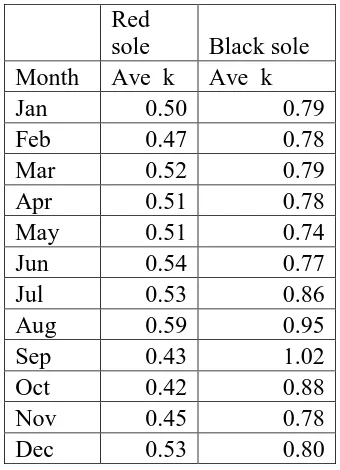
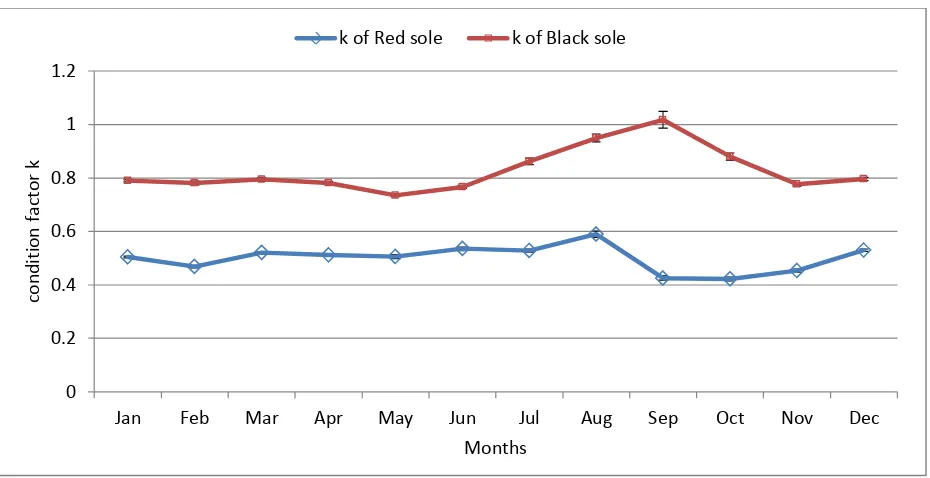
In each month the condition factor k was estimated based on the length-weight data from the Atlantic Seafood. (Table 3 and Figure 5).
Red
sole Black sole Month Ave k Ave k
Jan 0.50 0.79
Feb 0.47 0.78
Mar 0.52 0.79
Apr 0.51 0.78
May 0.51 0.74
Jun 0.54 0.77
Jul 0.53 0.86
Aug 0.59 0.95
Sep 0.43 1.02
Oct 0.42 0.88
Nov 0.45 0.78
Dec 0.53 0.80
9
Figure 5: Condition factor for Red and Black sole with standard error bars.
From the above analysis, it could be observed that both species (Red and Black sole) showed changes in the condition factor over the season (Figure 5). The higher the W, the higher the K. Biologically, the highest weight should be seen just prior to actual spawning. This would indicate peak spawning for red sole to be September, while black sole would spawn in August.
ESTIMATION OF THE LEVEL OF EXPLOITATION
In 2011 a similar analysis was conducted based on the length frequency data collected from the landing sites and Atlantic Seafood to assess the level of exploitation of sole in the Gambia waters. Using a length converted catch curve, F was obtained and compared to a reference point. For this analysis the only data available was from Atlantic Seafood for 2012. Reference points were recalculated based on changes to life history parameters thought to better reflect red and black sole.
Methods
A Length-based Catch Curve Analysis (LCCA) was conducted on length frequency distribution collected from the Atlantic Seafood in 2012. This data were expanded and re-sorted according to months, and finally summed for the 12 months for red and black sole. The lengths of the fish length were converted to mean age using a von Bertalanffy growth equation, using a specific value of Linf and K, the growth coefficient. To determine the total mortality (Z), the natural log of the numbers captured was plotted versus the estimated age at mean length.
0
Jan Feb Mar Apr May Jun Jul Aug Sep Oct Nov Dec
10 Results
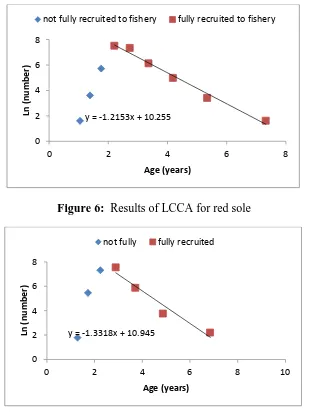
The natural log of numbers captured was plotted versus the estimated age at mean length; the regression slope was estimated on fish which were fully recruited to the fishery.
Figure 6: Results of LCCA for red sole
Figure 7: Results of LCCA for black sole
The results of the length-based Catch Curve Analysis of the red and black sole indicated that the slope of the linear regression of the natural log of numbers versus the age, the total mortality was 1.2 for red sole and 1.3 for black sole.
Using a new value for M=0.4 as a more conservative estimate, F was calculated as: Red sole = 0.8 and black sole 0.9. This analysis was based on the following parameters for the life history
y = -1.2153x + 10.255
not fully recruited to fishery fully recruited to fishery
11
characteristics: Linf= 65 cm, K= 0.35 and M= 0.4 for red sole and Linf= 55 cm, k=0.35 and M=0.4 for black sole.
REFERENCE POINTS
Using the new estimates of M= 0.4 and a larger Linf for red sole, the new YPR and SSBPR reference points are shown below (Figures 8 and 9). F30% and F 20% were estimated for comparison purposes.
Figure 8: Reference points for red sole. Fmax = 0.87 and F30% = 0.51.
12
SUMMARY, CONCLUSION AND RECOMMENDATIONS
The following results indicate levels of overfishing for the Gambian sole using new life history parameters.
Species F
calculated F max
F30% F20% Conclusion
Red sole 0.8 0.87 0.51 0.80 Recruitment overfishing; no growth overfishing
Black sole
0.9 0.61 0.46 0.68 Both recruitment and growth overfishing
Based on these results, it is recommended that fishing mortality be reduced, so that the stock can begin to recover. To reduce fishing mortality the following measures are recommended:
• Mesh size control: Larger mesh sizes need to be used to reduce catch of small fish.
• Fishing effort must be reduced: this can be achieved through limiting the number of fishing days, nets or fishing boats.
• Closed season or closed areas should be introduced: mostly should be around spawning areas and times.
13 REFERENCES
Abowei, J.F.N. 2009. The Abundance, Condition Factor, and Length-Weight Relationship of Cynoglossus senegalensis (Kaup, 1858) from Nkoro River, Niger Delta, Nigeria. Advanced J. of Food Sci. and Tech 1(1): 57-62.
DeAlteris, J. Cessay, S. and A. Jallow. 2012. Final report: the Gambian Sole Stock Assessment. CRC, URI. Pps 20.
Lamin Sanyang, Alexa Kretsch and Kathleen Castro, 2011, Length-weight relationships and condition factors of Red sole, Cynoglossus senegalensis and Black sole, Synaptura cadenati from The Gambia, Coastal Resources Center, University of Rhode Island, pp.7