Principles of
Genome Analysis
and Genomics
Sandy B. Primrose
Business and Technology Management High WycombeBuckinghamshire, UK
Richard M. Twyman
Department of BiologyUniversity of York York, UK
350 Main Street, Malden, MA 02148-5018, USA 108 Cowley Road, Oxford OX4 1JF, UK
550 Swanston Street, Carlton South, Melbourne, Victoria 3053, Australia Kurfürstendamm 57, 10707 Berlin, Germany
The rights of Sandy Primrose and Richard Twyman to be identified as the Authors of this Work have been asserted in accordance with the UK Copyright, Designs, and Patents Act 1988.
All rights reserved. No part of this publication may be reproduced, stored in a retrieval system, or transmitted, in any form or by any means, electronic, mechanical, photocopying, recording or otherwise, except as permitted by the UK Copyright,
Designs, and Patents Act 1988, without the prior permission of the publisher. First published 1995
Second edition 1998 Third edition 2003
Library of Congress Cataloging-in-Publication Data
Primrose, S.B.
Principles of genome analysis and genomics/ Sandy B. Primrose, Richard M. Twyman.—3rd ed.
p. cm.
Includes bibliographical references and index. ISBN 1-40510-120-2 (pbk.: alk. paper)
1. Gene mapping. 2. Nucleotide sequence. 3. Genomics. I. Twyman, Richard M. II. Title.
QH445.2.P75 2002 572.8′633—dc21 2002070937
A catalogue record for this title is available from the British Library. Set in 9A/12pt Photina
by Graphicraft Limited, Hong Kong Printed and bound in Italy by G. Canale & C.S.P.A., Turin
For further information on Blackwell Publishing, visit our website:
Retrofitting, 44 Choice of vector, 45 Suggested reading, 45 Useful website, 46
4 Assembling a physical map of the genome, 47
Introduction, 47
Restriction enzyme fingerprinting, 47 Marker sequences, 49
Hybridization assays, 59
Physical mapping without cloning, 64 Integration of different mapping methods, 69
Suggested reading, 70 Useful websites, 70
5 Sequencing methods and strategies, 71 Basic DNA sequencing, 71
Modifications of chain-terminator sequencing, 73
Automated DNA sequencing, 75 DNA sequencing by capillary array electrophoresis, 76
Basecalling and sequence accuracy, 77 High-throughput sequencing, 77 Sequencing strategies, 78 Alternative DNA sequencing methodologies, 85
Suggested reading, 92 Useful websites, 93
6 Genome annotation and bioinformatics, 94 Introduction, 94
Traditional routes to gene identification, 94 Databases, 97
Overview of sequence analysis, 97 Detecting open-reading frames, 99 Software programs for finding genes, 99 Using homology to find genes, 102 Preface, v
Abbreviations, vi
1 Setting the scene: the new science of genomics, 1
Introduction, 1
Physical mapping of genomes, 1 Sequencing whole genomes, 3 Benefits of genome sequencing, 5 Outline of the rest of the book, 6 Terminology, 8
Keeping up to date, 8 Suggested reading, 8 Useful websites, 9
2 The organization and structure of genomes, 10
Introduction, 10 Genome size, 10
Sequence complexity, 11 Introns and exons, 13
Genome structure in viruses and prokaryotes, 16
The organization of organelle genomes, 18 The organization of nuclear DNA in eukaryotes, 19
Suggested reading, 33 Useful websites, 33
3 Subdividing the genome, 34 Introduction, 34
Fragmentation of DNA with restriction enzymes, 34
Separating large fragments of DNA, 36 Isolation of chromosomes, 37
Chromosome microdissection, 39 Vectors for cloning DNA, 39 Yeast artificial chromosomes, 40 P1-derived and bacterial artificial
Analysis of non-coding RNA and extragenic DNA, 105
Identifying the function of a new gene, 105 Secondary databases of functional domains, 107
Gene ontology, 108
Analyses not based on homology, 108 Genome annotation, 111
Molecular phylogenetics, 111 Suggested reading, 112 Useful websites, 112
7 Comparative genomics, 113 Introduction, 113
Orthologues, paralogues and gene displacement, 113
Protein evolution by exon shuffling, 113 Comparative genomics of prokaryotes, 114 Comparative genomics of organelles, 121 Comparative genomics of eukaryotes, 123 Other aspects of comparative genomics, 130 Suggested reading, 132
Useful websites, 132
8 Protein structural genomics, 133 Introduction, 133
Determining gene function by sequence comparison, 133
Determining gene function through conserved protein structure, 134
Approaches to protein structural genomics, 136
Suggested reading, 144 Useful website, 145
9 Global expression profiling, 146 Introduction, 146
Traditional approaches to expression profiling, 146
Global analysis of RNA expression, 148
Global analysis of protein expression, 163 Suggested reading, 171
Useful websites, 172
10 Comprehensive mutant libraries, 173 Introduction, 173
High-throughput systematic gene knockout, 173
Genome-wide random mutagenesis, 175 Suggested reading, 186
Useful websites, 186
11 Mapping protein interactions, 187 Introduction, 187
Methods for protein interaction analysis, 187 Library-based methods for screening protein interactions, 189
Informatics tools and resources for protein interaction data, 196
Suggested reading, 199 Useful websites, 199
12 Applications of genome analysis and genomics, 200
Introduction, 200
Theme 1: Understanding genetic diseases of humans, 200
Theme 2: Understanding responses to drugs (pharmacogenomics), 209
Theme 3: Getting to grips with bacterial pathogenicity, 211
Theme 4: Getting to grips with quantitative traits, 218
Theme 5: The impact of genomics on agriculture, 223
Theme 6: Developmental genomics, 225 Suggested reading, 228
For most of the 20th century, a central problem in genetics was the creation of maps of entire chromo-somes. These maps were crucial for the understand-ing of the structure of genes, their function and their evolution. For a long time these maps were created by genetic means, i.e. as a result of sexual crosses. Starting about 15 years ago, recombinant DNA technology was used to generate molecular or phys-ical maps, defined here as the ordering of distin-guishable DNA fragments by their position along the chromosome. Two key features of physical maps are that they can be generated much more quickly than genetic maps, and they usually have a much denser array of markers. The existence of physical maps now is greatly facilitating the analysis of a number of key questions in genetics such as the molecular basis of polygenic disorders and quantitative traits.
Physical mapping embraces a wide range of manipulative and analytical techniques which are detailed in specialist journals using a specialist lan-guage. This means that it is difficult for even the experienced biologist entering the field to compre-hend the latest developments or even what has been achieved. The first edition of this book was written to provide these new entrants with an overview of the methodologies employed.
The ultimate physical map is a complete genome sequence. Shortly after the first edition of this book was published in 1995, the complete sequence of a bacterial genome was reported for the first time. From a technical point of view this was a particu-larly noteworthy achievement because the genome sequenced had a size of 1.8 million base pairs, yet the longest individual piece of DNA that can be sequenced is only 600–800 nucleotides. Soon there-after, the sequences of several mammalian
chromo-somes were reported as well as the entire genome of the yeast Saccharomyces cerevisiae. The key issue was no longer how to sequence a genome but how to handle the sequence data. These changes were reflected in the second edition published in 1998.
As we entered the 21st century, the list of sequenced genomes included over 60 bacteria plus those of yeast, the nematode, the fruit fly, a flowering plant and humans. The size of the human genome (3 billion base pairs) indicates the progress made since the first edition was published. Sequen-cing of whole genomes is progressing at a rapid rate but the emphasis is now shifting back to biological questions. For example, how do the different com-ponents of the genome and the different gene prod-ucts interact? Answers to questions such as this are being provided using yet another new set of tools in combination with the established mapping and sequencing methodologies. This branch of biology is known as genomics and its importance is such that half of this third edition is devoted to it.
2DE two-dimensional gel electrophoresis
Ac Activator
ADME adsorption, distribution, metabolism and excretion
AFBAC affected family-based control AFLP amplified fragment length
polymorphism
ALL acute lymphoblastic leukaemia AML acute myeloid leukaemia APL acute promyelocytic leukaemia ARS autonomously replicating sequence ATRA all-trans-retinoic acid
BAC bacterial artificial chromosome BCG Bacille Calmette–Guérin bFGF basic fibroblast growth factor BIND Biomolecular Interaction Network
Database
BLAST Basic Local Alignment Search Tool BLOSUM Blocks Substitution Matrix BMP bone morphogenetic protein
bp base pair
BRET bioluminescence resonance energy transfer
CAPS cleaved amplified polymorphic sequences
CASP Critical Assessment of Structural Prediction
CATH Class, Architecture, Topology and Homologous superfamily (database) CCD charge couple device
CD circular dichroism cDNA complementary DNA
CEPH Centre d’Etude du Polymorphisme Humain
CHEF contour-clamped homogeneous electrical field
CID collision-induced dissociation
cM centimorgan
COG cluster of orthologous groups
cR centiRay
cRNA complementary RNA
CSSL chromosome segment substitution line
ct chloroplast
DDBJ DNA Databank of Japan DIP Database of Interacting Proteins DMD Duchenne muscular dystrophy DNA deoxyribonucleic acid
dNTP deoxynucleoside triphosphate
Ds Dissociation
dsDNA double-stranded DNA dsRNA double-stranded RNA EGF epidermal growth factor ELISA enzyme-linked immunosorbent
sandwich assay
EMBL European Molecular Biology Laboratory
ENU ethylnitrosourea ES embryonic stem (cells) ESI electrospray ionization EST expressed sequence tag EUROFAN European Functional Analysis
Network (consortium)
FACS fluorescence-activated cell sorting FEN flap endonuclease
FIAU Fialuridine
(1-2′-deoxy-2′-fluoro-β-d-arabinofuranosyl-5-iodouracil)
FIGE field-inversion gel electrophoresis FISH fluorescence in situhybridization FPC fingerprinted contigs
FRET fluorescence resonance energy transfer
FSSP Fold classification based on Structure–Structure alignment of Proteins (database)
GASP Genome Annotation Assessment Project
G-CSF granulocyte colony stimulating factor
GST gene trap sequence tag GST glutathione-S-transferase HAT hypoxanthine, aminopterin and
thymidine
HDL high-density lipoprotein HERV human endogenous retrovirus HPRT hypoxanthine
phosphoribosyl-transferase
HTF HpaII tiny fragment
htSNP haplotype tag single nucleotide polymorphism
IDA interaction defective allele Ihh Indian hedgehog
IPTG isopropylthio-β-d-galactopyranoside
IST interaction sequence tag IVET in vivoexpression technology
kb kilobase
LCR low complexity region LD linkage disequilibrium
LINE long interspersed nuclear element LOD logarithm10of odds
LTR long terminal repeat m : z mass : charge ratio
MAD multiwavelength anomalous diffraction
MAGE microarray and gene expression MAGE-ML microarray and gene expression
mark-up language
MAGE-OM microarray and gene expression object model
MALDI matrix assisted laser desorption ionization
Mb megabase
MGED Microarray Gene Expression Database
MIAME minimum information about a microarray experiment MIP molecularly imprinted polymer MIPS Munich Information Center for
Protein Sequences
MM ‘mismatch’ oligonucleotide MPSS massively parallel signature
sequencing mRNA messenger RNA MS mass spectrometry MS/MS tandem mass spectroscopy mt mitochondrial
MTM Maize Targeted Mutagenesis project
Mu Mutator
MudPIT multidimensional protein identification technology NGF nerve growth factor NIL near isogenic line
NMR nuclear magnetic resonance NOE nuclear Overhauser effect NOESY NOE spectroscopy
nt nucleotide
OFAGE orthogonal-field-alternation gel electrophoresis
ORF open-reading frame ORFan orphan open-reading frame P/A presence/absence polymorphism PAC P1-derived artificial chromosome PAGE polyacrylaminde gel electrophoresis PAI pathogenicity island
PAM percentage of accepted point mutations
PCR polymerase chain reaction PDB Protein Databank (database) Pfam Protein families database of
alignments
PFGE pulsed field gel electrophoresis PM ‘perfect match’ oligonucleotide poly(A)+ polyadenylated
PQL protein quantity loci PRINS primed in situ
PS position shift polymorphism PSI-BLAST Position-Specific Iterated BLAST
(software)
PVDF polyvinylidine difluoride QTL quantitative trait loci
RACE rapid amplification of cDNA ends RAPD randomly amplified polymorphic
DNA
RARE RecA-assisted restriction endonuclease
RC recombinant congenic (strains) RCA rolling circle amplification rDNA/RNA ribosomal DNA/RNA RFLP restriction fragment length
polymorphism
RIL recombinant inbred line R-M restriction-modification RNA ribonucleic acid RNAi RNA interference RNase ribonuclease
RT-PCR reverse transcriptase polymerase chain reaction
RTX repeats in toxins
SAGE serial analysis of gene expression SCOP Structural Classification of Proteins
(database)
SDS sodium dodecylsulphate
SELDI surface-enhanced laser desorption and ionization
SGDP SaccharomycesGene Deletion Project Shh sonic hedgehog
SINE short interspersed nuclear element SINS sequenced insertion sites
SNP single nucleotide polymorphism SPIN Surface Properties of protein–protein
Interfaces (database)
Spm Suppressor–mutator
SPR surface plasmon resonance SRCD synchrotron radiation circular
dichroism
SSLP simple sequence length polymorphism
SSR simple sequence repeat STC sequence-tagged connector STM signature-tagged mutagenesis STS sequence-tagged site
TAC transformation-competent artificial chromosome
TAFE transversely alternating-field electrophoresis
TAR transformation-associated recombination
T-DNA Agrobacteriumtransfer DNA TIGR The Institute for Genomic Research TIM triose phosphate isomerase TOF time of flight
tRNA transfer RNA
TUSC Trait Utility System for Corn UPA universal protein array UTR untranslated region VDA variant detector array VIGS virus-induced gene silencing Y2H yeast two-hybrid
Setting the scene:
the new science of genomics
Introduction
Genetics is the study of the inheritance of traits from one generation to another. As such, it examines the phenotypes of the offspring of sexual crosses. Useful as these data may be, they cannot provide an explana-tion for the biological basis of a phenotype for that requires biochemical information. In some cases the jump from phenotype to biochemical explanation was relatively simple. Good examples are amino acid auxotrophy and antibiotic resistance in microor-ganisms and phenylketonuria and sickle cell disease in humans. However, until recently, it was almost impossible to determine the biochemical basis for most of the traits in most organisms.
The first major advance in understanding pheno-types came in the mid-1970s with the development of methods for manipulating genes in vitro(‘genetic engineering’). This permitted genes to be cloned and sequenced which in turn provided data on the amino acid sequence of the gene product. It also became possible to overexpress the gene product, thereby facilitating its purification and characteriza-tion. As the number of characterized gene products has grown, the determination of gene function has become easier, as it is possible to search databases for closely related proteins whose properties are known. Other techniques that have facilitated the analysis of phenotypes are site-directed mutagen-esis, where specific base changes or deletions can be made in genes, and gene replacement. All of these techniques, and many others, are described in our companion volume Principles of Gene Manipulation (Primrose et al. 2001).
Over the past 25 years a vast amount of data has been generated for thousands of different gene products from many different organisms, most of it as a direct result of the ability to manipulate genes. Impressive as this is, gene manipulation on its own cannot meet all the needs of biologists. First, in many instances, a gene needs to be mapped close to a
convenient marker before it can be cloned. While this may be easy in an organism such as Drosophila where many mutants are available, it is much more difficult in humans or in organisms whose genetics have been poorly studied. Secondly, understanding the phenotype of one or a few genes gives little infor-mation about the whole organism and how all its components interact, e.g. its metabolic capabilities or how it controls its development. Thirdly, the an-alysis of a few genes does not enable us to answer the big questions in biology. For example, how did speech and memory evolve, what changes at the DNA level occurred as the primates evolved, etc.? However, these needs now are being met as a result of efforts to sequence the entire genomes of a num-ber of organisms.
Physical mapping of genomes
analysis impossible. A major breakthrough was the development of methods for using DNA probes to identify polymorphic sequences (Botstein et al. 1980). The first such DNA polymorphisms to be detected were differences in the length of DNA frag-ments after digestion with sequence-specific restric-tion endonucleases, i.e. restricrestric-tion fragment length polymorphisms (RFLPs; Fig. 1.1).
To generate an RFLP map the probes must be highly informative. This means that the locus must not only be polymorphic, it must be very poly-morphic. If enough individuals are studied, any randomly selected probe will eventually discover a polymorphism. However, a polymorphism in which one allele exists in 99.9% of the population and the other in 0.1% is of little utility because it seldom will be informative. Thus, as a general rule, the RFLPs used to construct the genetic map should have two, or perhaps three, alleles with equivalent frequencies.
The first RFLP map of an entire genome (Fig. 1.2) was that described for the human genome by
Donis-Keller et al. (1987). They tested 1680 clones from a phage library of human genomic DNA to see whether they detected RFLPs by hybridization to Southern blots of DNA from five unrelated indi-viduals. DNA from each individual was digested with 6–9 restriction enzymes. Over 500 probes were identified that detected variable banding patterns indicative of polymorphism. From this collection, a subset of 180 probes detecting the highest degree of polymorphism was selected for inheritance studies in 21 three-generation human families (Fig. 1.3). Additional probes were generated from chromo-some-specific libraries such that ultimately 393 RFLPs were selected. The various loci were arranged into linkage groups representing the 23 human chromosomes by a combination of mathematical linkage analysis and physical location of selected clones. The latter was achieved by hybridizing probes to panels of rodent–human hybrid cells con-taining varying human chromosomal complements (see p. 38). RFLP maps have not been restricted to the human genome. For example, RFLP maps have Parents
Offspring (b)
Heterozygous parents
Affected offspring
Heterozygous offspring
Normal offspring
Heterozygous parents
Direction of DNA migration (a)
Restriction sites
Probe
Normal
Affected
Fig. 1.1 Example of a RFLP and its use
been published for most of the major crops (see for example Moore et al. 1995).
The human genome map produced by Donis-Keller et al. (1987) was a landmark publication. However, it identified RFLP loci with an average spacing of 10 centimorgans (cM). That is, the loci had a 10% chance of recombining at meiosis. Given that the human genome is 4000 cM in length, the distance between the RFLPs is 10 Mb on average. This is too great to be of use for gene isolation. How-ever, if the methodology of Donis-Keller et al. (1987) was used to construct a 1 cM map, then 100 times the effort would be required! This is because 10 times as many probes would be required and 10 times more families studied. The solution has been to use more informative polymorphic markers and other mapping techniques and these are described in detail in Chapter 4. Use of these techniques has led to the generation of a human map with the desired density of markers. More important, these advances
in gene mapping were not restricted to the human genome. Rather, the methodology is generic and now has been applied to a wide range of animal and plant genomes.
Sequencing whole genomes
The late 1980s and early 1990s saw much debate about the desirability of sequencing the human genome. This debate often strayed from rationale scientific debate into the realms of politics, personal-ities and egos. Among the genuine issues raised were questions such as: Is the sequencing of the human genome an intellectually appropriate project for biologists?; Is sequencing the human genome feas-ible?; What benefits might arise from the project?; Will these benefits justify the cost and are there alter-native ways of achieving the same benefits?; Will the project compete with other areas of biology for fund-ing and intellectual resources? Behind the debate was a fear that sequencing the human genome was an end in itself, much like a mountaineer who climbs a new peak just because it is there.
In early 2001 two different groups (International Human Genome Sequencing Consortium 2001; Venter et al. 2001) reported the draft sequence of the
1 2 2 2
1 2
2 3 2 2
2 2
2 3 2 2 2 2 2 3 1 2 2 3 1 2 2 3
–1
–2
–3
Fig. 1.3 Inheritance of a RFLP in three generations of a
family. The RFLP probe used detects a single locus on human chromosome 5. In the family shown, three alleles are detected on Southern blotting after digestion with TaqI. For each of the parents it can be inferred which allele was inherited from the grandmother and which from the grandfather. For each child the grandparental origin of the two alleles can then be inferred. (Redrawn from Donis-Keller et al. 1987, with permission from Elsevier Science.)
Fig. 1.2 The first RFLP genetic linkage map of the entire
human genome. An analysis of this achievement provides clear answers to the questions raised above. Those opposed to the idea of sequencing the human genome had cited the resources (thousands of sci-entists and billions of dollars) and time that would be required to accomplish the task. Furthermore, they believed that once the human genome was sequenced there would be a major logistical problem in handling the sequence data. What happened was that the scientific community developed new strategies for sequencing genomes, rather than new methods for sequencing DNA, and complemented these with the development of highly automated methodologies. The net effect was that by the time the human genome had been sequenced, the com-plete sequence was already known for over 30 bac-terial genomes plus that of a yeast (Saccharomyces cerevisiae), the fruit fly (Drosophila melanogaster), a nematode (Caenorhabditis elegans) and a plant (Ara-bidopsis thaliana) (Table 1.1). Furthermore, a whole new science, bioinformatics, had been developed to handle and analyse the vast amounts of infor-mation being generated by these sequencing pro-jects. Fortuitously, the global development of the Internet occurred at the same time and this enabled scientists around the world to have access to the bioinformatics tools developed in global centres of excellence.
The development of bioinformatics not only facil-itated the handling and analysis of sequence data but the development of sequencing strategies as
well. For example, when a European consortium set themselves the goal of sequencing the entire genome of the budding yeast Saccharomyces(15 Mb), they segmented the task by allocating the sequencing of each chromosome to different groups. That is, they subdivided the genome into more manageable parts. At the time this project was initiated there was no other way of achieving the objective and when the resulting genomic sequence was published (Goffeau et al. 1996), it was the result of a unique multicentre collaboration. While the Saccharomycessequencing project was underway, a new genomic sequencing strategy was unveiled: shotgun sequencing. In this approach, large numbers of genomic fragments are sequenced and sophisticated bioinformatics algo-rithms used to construct the finished sequence. In contrast to the consortium approach used with Sac-charomyces, a single laboratory set up as a sequen-cing factory undertook shotgun sequensequen-cing.
The first success with shotgun sequencing was the complete sequence of the bacterium Haemophilus influenzae(Fleischmann et al. 1995) and this was quickly followed with the sequences of Mycoplasma genitalium(Fraser et al. 1995), Mycoplasma pneumo-niae(Himmelreich et al. 1996) and Methanococcus jannaschii(Bult et al. 1996). It should be noted that H. influenzaewas selected for sequencing because so little was known about it: there was no genetic map and not much biochemical data either. By contrast, S. cerevisiaewas a well-mapped and well-character-ized organism. As will be seen in Chapter 5, the
Table 1.1 Increases in sizes of genomes sequenced.
Genome sequenced
Bacteriophage fX174 Plasmid pBR322
Rice (Oryza sativa) Pufferfish (Fugu rubripes) Mouse (Mus musculis)
Year
First genome of cellular organism to be sequenced First eukaryotic genome to be sequenced
First genome of multicellular organism to be sequenced
relative merits of shotgun sequencing vs. ordered, map-based sequencing still are being debated today. Nevertheless, the fact that a major sequencing lab-oratory can turn out the entire sequence of a bac-terium in 1–2 months shows the power of shotgun sequencing.
Benefits of genome sequencing
Fears that sequencing the human genome would be an end in itself have proved groundless. Because so many different genomes have been sequenced it now is possible to undertake comparative analyses, a topic known as comparative genomics. By compar-ing genomes from distantly related species we can begin to decipher the major stages in evolution. By comparing more closely related species we can begin to uncover more recent events such as genome rearrangement and mutation processes. Currently, the most fertile area of comparative genomics is the analysis of bacterial genomes because so many have been sequenced. Already this analysis is throwing up some interesting questions. For example, over 25% of the genes in any one bacterial genome have no analogues in any other sequenced genome. Is this an artefact resulting from limited sequence data or does it reflect the unique evolutionary events that have shaped the genomes of these organisms? Again, comparative analysis of the genomes of a wide range of thermophiles has revealed numerous interesting features, including strong evidence of extensive hori-zontal gene transfer. However, what is the genomic basis for thermophily? We still do not know. Com-parative genomics also is of value with higher organisms. Selective breeding is not acceptable with humans so we use other mammals as surrogates. Which is the best species to select as a surrogate? Comparative genomics can answer this question.
One of the fascinating aspects of the classic paper of Fleischmann et al. (1995) was their analysis of the metabolic capabilities of H. influenzae which they deduced from sequence information alone. This analysis (metabolomics) has been extended to every other sequenced genome and is providing tremend-ous insight into the physiology and ecological adapt-ibility of different organisms. For example, obligate parasitism in bacteria is linked to the absence of genes for certain enzymes involved in central meta-bolic pathways. Another example is the correlation
between genome size and the diversity of ecological niches that can be colonized. The larger the bacterial genome, the greater are the metabolic capabilities of the host organism and this means that the organism can be found in a greater number of habitats.
Analysis of genomes has enabled us to identify most of the genes that are present. However, we still do not know what functions many of these genes perform and how important these genes are to the life of the cell. Nor do we know how the different gene products interact with each other. Because most gene products are proteins, the study of these interactions is known as proteomics. It is a discipline which is rooted in experiments rather than com-puter analysis. For example, the principal way of determining the function of a gene is to delete it and then monitor the fitness of the deletion strain under a variety of selective conditions. This is an enormous task but strategies have been developed for sim-plifying it. Of course, such a methodology cannot be used with humans, hence the need for comparative genomics.
The biochemistry and genetics of many human diseases have been elucidated but most of these are simple single-gene disorders. Unfortunately, most of the common diseases of humans, and those that put most financial burden on health provision, are poly-genic disorders, e.g. hypertension and cancer. Cur-rently we know very little about the causesof these diseases and hence we are reduced to treating the symptoms. One consequence of this is that many drugs have undesirable side-effects or else only work with certain individuals. Advances in genomics are enabling us to get a better handle on the causes of disease and this will lead to new therapies. Advances in physical mapping of the human genome are enabling us to better predict the effectiveness of a drug and the likely side-effects. Another advance in human genetics is the beginning of an understand-ing of complex social traits. For example, the first gene controlling speech has just been identified (Lai et al. 2001). Polygenic traits are of equal importance in agronomy. Many different characteristics such as weight gain, size, yield, etc. are controlled by many different loci. Again, physical mapping is enabling us to identify the different loci involved and this will facilitate more rational breeding programmes.
the human genome was equivalent to putting a man on the moon. However, putting a man on the moon was a race between two nations and was driven by global political ambitions as much as by scientific challenge. By contrast, genome sequencing truly has been an international effort requiring labora-tories in Europe, North America and Japan to col-laborate in a way never seen before. The extent of this collaboration can be seen from an analysis of the affiliations of the authors of the papers on the sequencing of the genomes of Arabidopsis(The Arabidopsis Genome Initiative 2000) and humans (International Human Genome Sequencing Con-sortium 2001), for example. The fact that one US company, Celera, has successfully undertaken many sequencing projects in no way diminishes this col-laborative effort. Rather, they have constantly chal-lenged the accepted way of doing things and have increased the efficiency with which key tasks have been undertaken.
Three other aspects of genome sequencing and genomics deserve mention. First, in other branches of science such as nuclear physics and space exploration, the concept of ‘superfacilities’ is well established. With the advent of whole genome sequencing, biology is moving into the superfacil-ity league and a number of sequencing ‘factories’ have been established. Secondly, high throughput methodologies have become commonplace and this has meant a partnering of biology with automation, instrumentation and data management. Thirdly, many biologists have eschewed chemistry, physics and mathematics but progress in genomics demands that biologists have a much greater understanding of these subjects. For example, methodologies such as mass spectrometry, X-ray crystallography and protein structure modelling are now fundamental to the identification of gene function. The impact that this has on undergraduate recruitment in the sci-ences remains to be seen.
Outline of the rest of the book
The remainder of the book is divided into three parts. The first part concentrates on the methods devel-oped for mapping and sequencing genomes and on the basics of bioinformatics (Fig. 1.4). The second part deals with genomics; i.e. the analysis of genome
data and the use of map and sequence data to locate genes of interest and to understand phenotypes and fundamental biological phenomena (Fig. 1.5). Thus in the second part of the book, we provide a solution to the problem of understanding the phenotype as outlined earlier in this chapter. Finally, in the last part (Chapter 12) we review some of the applications of the methodologies discussed in the preceding two sections.
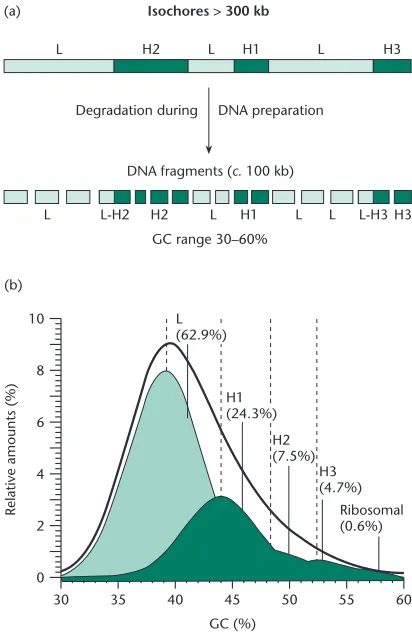
The genomes of free-living cellular organisms range in size from less than 1 Mb for some bacteria to millions, or tens of millions, of megabases for some plants. It may even come as a surprise to some to know that a protozoan, never mind a plant, can have a larger genome than that of humans. How-ever, size does not necessarily equal gene content, a phenomenon first elaborated as the C-value paradox (p. 11). Rather, size is often a reflection of genome structure and organization, particularly that of repetitive DNA. This topic is covered in Chapter 2.
The sheer size of the genome of even a simple bacterium is such that to handle it in the laboratory we need to break it down into smaller pieces that are handled as clones. The methods for doing this are covered in Chapter 3. The process of putting the pieces back together again involves mapping. Many different sequence markers are used to do this, as well as some novel mapping methods, and these are described in Chapter 4. DNA sequencing technology is such that only short stretches (~600 bp) can be analysed in a single reaction. Consequently, the genome has to be fragmented and the sequence of each fragment determined and the total sequence reassembled (Chapter 5). Fortunately, the tools and techniques used for mapping also can be applied to genome sequencing. Finally, all the sequence data generated need to be stored and the information that they contain extracted. An introduction to this topic of bioinformatics is provided in Chapter 6.
(Chap-ter 7). The premise here is that DNA sequences encoding important cellular functions are likely to be conserved whereas dispensable or non-coding sequences will not. However, comparative genomics only gives a broad overview of the capabilities of different organisms. For a more detailed view one needs to identify each gene in the genome and its function. Such whole genome annotation involves a combination of computer and experimental analysis and is described in Chapters 8–11.
In classical biochemistry one starts by purifying a protein of known function and then determining its structure. In structural genomics, as described in Chapter 8, one does the opposite on the basis that peptide sequences with a similar primary or second-ary structure are likely to have similar functions. Chapter 9 is devoted to the burgeoning field of
high throughput expression analysis which is being used with great success to determine the function of anonymous genes. The methodologies used also give qualitative and quantitative information about gene expression as it relates to the biology of the whole organism. For example, it is possible to iden-tify all the genes being transcribed in any cell or tis-sue at any time and the extent to which these RNAs are translated into proteins. Chapter 10 explores the idea of determining gene function by mutation. Whereas this is carried out on a gene-by-gene basis in classical genetics, in genomics it is performed on a genome-wide scale. Chapter 11 describes the invest-igation of protein–protein interactions and how these interactions are being mapped and assembled into databases in an attempt to link all proteins in the cell into a functional network.
Chromosome Genome
Library
Map
Sequence
Gene
Fragmentation with endonucleases Separation of large DNA fragments Isolation of chromosomes Chromosome microdissection Vectors for cloning
Chapter 3 Genome size
Sequence complexity Introns and exons Genome structure Repetitive DNA
Chapter 2
Restriction fingerprinting STSs, ESTs, SSLPs and SNPs RAPDs, CAPs and AFLPs Hybridization mapping
Optical mapping, radiation hybrids and HAPPY mapping Integration of mapping methods
Chapter 4
Sequencing methodology
Automation and high throughput sequencing Sequencing strategies
Sequencing large genomes Pyrosequencing
Sequencing by hybridization
Chapter 5
Databases and software Finding genes
Identifying gene function Genome annotation Molecular phylogenetics
Chapter 6
Fig. 1.4 ‘Road map’ outlining the
Terminology
Workers in the field of genomics have coined a whole series of ‘-omics’ terms to describe sub-discip-lines of what they do. Confusingly, not everyone uses these terms in the same way. Our use of these terms is defined in Box 1.1.
Keeping up to date
The science of genomics is moving forward at an incredible pace and significant new advances are being reported weekly. This in turn has led to the publication of a plethora of new journals with ‘-omics’ in their titles and which many hard-pressed libraries will be unable to afford. Fortunately, much of this material can now be accessed through the Internet and in the chapters that follow reference is made to relevant websites whenever possible. Any reader not familiar with the PubMed website
(http://www.ncbi.nlm.nih.gov/PubMed/) is strongly
advised to spend some time browsing it as it provides very useful access to a wide range of literature. It also has links to the contents pages of many journals.
Suggested reading
Donis-Keller H. et al. (1987) A genetic linkage map of the human genome. Cell51, 319–337. This is a classic paper and describes the first comprehensive human genetic map to be con-structed using DNA-based markers.
Fleischmann R.D. et al. (1995) Whole-genome random sequencing and assembly of Haemophilus influenzaeRd. Science269, 496–512. This is another classic paper and the wealth of information about the biology of the bacterium that was inferred from the sequence data provided the justification, if one was needed, for whole genome sequencing.
Primrose S.B., Twyman R.M. & Old R.W. (2001) Principles of Gene Manipulation(6th edn.) Blackwell Science, Oxford. This textbook is widely used around the world and provides a detailed introduction to the many different techniques of gene manipula-tion that form the basis of the methods for genome analysis. Chapter 8
Structural genomics
Chapter 7 Comparative
genomics
Chapter 11 Protein interactions
Chapter 9 Expression profiling
Chapter 10 Mutant libraries Chapter 6
Annotation and bioinformatics
Fig. 1.5 Organization of the second
Useful websites
http://www3.ncbi.nlm.nih.gov/
This is the website of the National Center for Biotechnology Information. It contains links to many other useful websites. The OMIM pages on this site contain a wealth of information on Mendelian inheritance in humans. This site also is the
entry point to PubMed which enables researchers to access abstracts and journal articles on-line.
http://www.sciencemag.org/feature/plus/sfg/resources/
This is the website on functional genomics resources hosted by Sciencemagazine. It contains many useful pages and the ones on model organisms are well worth visiting. There also are features pages which are revised regularly.
Term Definition
Genomics The study of the structure and function of the genome
Functional genomics The high throughput determination of the function of a gene product. Included within this definition is the expression of the gene, the relationship of the sequence and structure of the gene product to other gene products in the same or other organisms, and the molecular interactions of the gene product
Structural genomics The high throughput determination of structural motifs and complete protein structures and the relationship between these and function
Comparative genomics The use of sequence similarity and comparative gene order (synteny) to determine gene function and phylogeny
Proteomics The study of the proteome, i.e. the full complement of proteins made by a cell. The term includes protein–protein and protein–small molecule interactions as well as expression profiling
Transcriptomics The study of the transcriptome, i.e. all the RNA molecules made by a cell, tissue or organism
Metabolomics The use of genome sequence analysis to determine the capability of a cell, tissue or organism to synthesize small molecules
Bioinformatics The branch of biology that deals with in silico processing and analysis of DNA, RNA and protein sequence data
Annotation The derivation of structural or functional information from unprocessed genomic DNA sequence data
The organization and
structure of genomes
Introduction
There is no such thing as a common genome struc-ture. Rather, there are major differences between the genomes of bacteria, viruses and organelles on the one hand and the nuclear genomes of eukary-otes on the other. Within the eukaryeukary-otes there are major differences in the types of sequences found, the amounts of DNA and the number of chromo-somes. This wide variability means that the map-ping and sequencing strategies involved depend on the individual genome being studied.
Genome size
Because the different cells within a single organism can be of different ploidy, e.g. germ cells are usually haploid and somatic cells diploid, genome sizes always relate to the haploid genome. The size of the
haploid genome also is known as the C-value. Measured C-values range from 3.5×10³bp for the
smallest viruses, e.g. coliphage MS2, to 1011bp for
some amphibians and plants (Fig. 2.1). The largest viral genomes are 1–2×10⁵bp and are just a little
smaller than the smallest cellular genomes, those of some mycoplasmas (5×10⁵bp). Simple unicellular
eukaryotes have a genome size (1–2×10⁷bp) that
is not much larger than that of the largest bacterial genomes. Primitive multicellular organisms such as nematodes have a genome size about four times larger. Not surprisingly, an examination of the gen-ome sizes of a wide range of organisms has shown that theminimumC-value found in a particular phy-lum is related to the structural and organizational complexity of the members of that phylum. Thus the minimum genome size is greater in organisms that evolutionarily are more complex (Fig. 2.2).
A particularly interesting aspect of the data shown in Fig. 2.1 is the range of genome sizes found within
Flowering plants
Birds
Mammals
Reptiles
Amphibians
Bony fish
Cartilaginous fish
Echinoderms
Crustaceans
Insects
Molluscs
Worms
Fungi
Algae
Bacteria
Mycoplasmas
Viruses
103 104 105 106 107 108 109 1010 1011
DNA content (bp)
Fig. 2.1 The DNA content of the
each phylum. Within some phyla, e.g. mammals, there is only a twofold difference between the largest and smallest C-value. Within others, e.g. insects and plants, there is a 10- to 100-fold variation in size. Is there really a 100-fold variation in the number of genes needed to specify different flowering plants? Are some plants really more organizationally com-plex than humans, as these data imply? Although there is evidence that birds with smaller genomes are better flyers (Hughes & Hughes 1995) and that plants are more responsive to elevated carbon diox-ide concentrations ( Jasienski & Bazzaz 1995) as their genomes increase in size, this is not sufficient to explain the size differential. The resolution of this apparent C-value paradox was provided by the an-alysis of sequence complexity by means of reasso-ciation kinetics.
Sequence complexity
When double-stranded DNA in solution is heated, it denatures (‘melts’) releasing the complementary single strands. If the solution is cooled quickly the DNA remains in a single-stranded state. However, if the solution is cooled slowly reassociation will occur. The conditions for efficient reassociation of DNA were determined originally by Marmur et al. (1963) and since then have been extensively studied by others (for a review, see Tijssen 1993). The key parameters are as follows. First, there must be an adequate concentration of cations and below 0.01m
sodium ion there is effectively no reassociation. Secondly, the temperature of incubation must be high enough to weaken intrastrand secondary structure. In practice, the optimum temperature for reassociation is 25°C below the melting temperature (Tm), that is, the temperature required to dissociate 50% of the duplex. Thirdly, the incubation time and the DNA concentration must be sufficient to per-mit an adequate number of collisions so that the DNA can reassociate. Finally, the size of the DNA fragments also affects the rate of reassociation and is conveniently controlled if the DNA is sheared to small fragments.
The reassociation of a pair of complementary sequences results from their collision and therefore the rate depends on their concentration. As two strands are involved the process follows second-order kinetics. Thus, if Cis the concentration of DNA that is single stranded at time t, then
where k is the reassociation rate constant. If C0is the initial concentration of single-stranded DNA at time t =0, integrating the above equation gives
When the reassociation is half complete, C/C0=0.5 and the above equation simplifies to
Thus the greater the C0t1/2 value, the slower the reaction time at a given DNA concentration. More important, for a given DNA concentration the half-period for reassociation is proportional to the number of different types of fragments (sequences) present and thus to the genome size (Britten & Kohne 1968). This can best be seen from the data in Table 2.1. Because the rate of reassociation depends on the concentration of complementary sequences, the C0t1/2for organism B will be 200 times greater than for organism A.
Experimentally it has been shown that the rate of reassociation is indeed dependent on genome size (Fig. 2.3). However, this proportionality is only true in the absence of repeated sequences. When the
C t0 1 2/ .=1
k
C
C0 C t0
1 1
.
=
+ ⋅k
d
d k
C t = − C
2 106 107 108 109 1010
105
Mycoplasmas
Bacteria
Yeasts
Worms, insects
Birds, amphibians
Mammals
Minimum genome size (bp)
Fig. 2.2 The minimum genome size found in a range of
reassociation of calf thymus DNA was first studied, kinetic analysis indicated the presence of two com-ponents (Fig. 2.4). About 40% of the DNA had a C0t1/2of 0.03, whereas the remaining 60% had a C0t1/2 of 3000. Thus the concentration of DNA sequences that reassociate rapidly is 100 000 times, the concentration of those sequences that reasso-ciate slowly. If the slow fraction is made up of unique sequences, each of which occurs only once in the calf genome, then the sequences of the rapid frac-tion must be repeated 100 000 times, on average. Thus the C0t1/2value can be used to determine the sequence complexity of a DNA preparation. A com-parative analysis of DNA from different sources has shown that repetitive DNA occurs widely in eukary-otes (Davidson & Britten 1973) and that different
Organism A Organism B
Starting DNA concentration (C0) 10 pg ml−1 10 pg ml−1
Genome size 0.01 pg 2 pg
No. of copies of genome per ml 1000 5 Relative concentration (A vs. B) 200 1
Table 2.1 Comparison of sequence
copy number for two organisms with different genome sizes.
Per
centage reassociated
0
100 20
40
60
C0t (mol × s l–1) 10
30
50
70 80 90
Poly U · Poly A Mouse satellite DNA Phage MS2 Phage T4 Calf thymus DNA (non-repetitive)
1 101 102 103 104 105 106 107 108 109 1010 Nucleotide pairs
10–6 10–5 10–4 10–3 10–2 10–1 1 101 102 103 104
E. coli
DNA
Per
centage reassociated
0
100 20
40
60
C0t (mol × s l–1) 10
30
50
70
80 90
10–2 10–1 1 101 102 103 104
Fig. 2.3 Reassociation of
double-stranded nucleic acids from various sources. (Redrawn from Lewin 1994 by permission of Oxford University Press.)
Fig. 2.4 The kinetics of reassociation of calf thymus DNA.
types of repeat are present. In the example shown in Fig. 2.5 a fast-renaturing and an intermediate-renaturing component can be recognized and are present in different copy numbers (500 000 and 350, respectively) relative to the slow component which is unique or non-repetitive DNA. The com-plexities of each of these components are 340 bp, 6×
105bp and 3×10⁸bp, respectively. The proportion
of the genome that is occupied by non-repetitive DNA versus repetitive DNA varies in different organ-isms (Fig. 2.6), thus resolving the C-value paradox. In general, the length of the non-repetitive DNA component tends to increase as we go up the evolu-tionary tree to a maximum of 2×10⁹bp in
mam-mals. The fact that many plants and animals have a much higher C-value is a reflection of the presence of large amounts of repetitive DNA. Analysis of mes-senger RNA (mRNA) hybridization to DNA shows that most of it anneals to non-repetitive DNA, i.e. most genes are present in non-repetitive DNA. Thus genetic complexity is proportional to the content of non-repetitive DNA and not to genome size.
Introns and exons
Introns were initially discovered in the chicken ovalbumin and rabbit and mouse β-globin genes (Breatnach et al. 1977; Jeffreys & Flavell 1977).
Both these genes had been cloned by isolating the mRNA from expressing cells and converting it to complementary DNA (cDNA). The next step was to use the cloned cDNA to investigate possible
Per
Fig. 2.5 The reassociation kinetics of a eukaryotic DNA
sample showing the presence of two types of repeated DNA. The arrows indicate theC0t1/2values for the three components. (Redrawn from Lewin 1994 by permission of Oxford University Press.)
E. coli C. elegans D. melanogasterM. musculus X. laevis N. tabacum
14% 13%
Fig. 2.6 The proportions of different
differences in the structure of the gene from express-ing and non-expressexpress-ing cells. Here the Southern blot hybridizations revealed a totally unanticipated situ-ation. It was expected that the analysis of genomic restriction fragments generated by enzymes that did not cut the cDNA would reveal only a single band corresponding to the entire gene. Instead several bands were detected in the hybridized blots. The data could be explained only by assuming the existence of interruptions in the middle of the protein-coding sequences. Furthermore, these insertions appeared to be present in both expressing and non-expressing cells. The gene insertions that are not translated into protein were termed intronsand the sequences that are translated were called exons.
Since the original discovery of introns, a large number of split genes has been identified in a wide variety of organisms. These introns are not restricted to protein-coding genes for they have been found in rRNA and tRNA genes as well. Split genes are rare in
prokaryotes (Edgellet al. 2000; Martinez-Abarca & Toro 2000). They also are not particularly common in lower eukaryotes (see below) but the mitochon-drial DNA of Euglenais an exception with 38% of the genome consisting of intron DNA (Hallick et al. 1993).
InSaccharomyces cerevisiae, sequencing of the com-plete genome suggests that there are 235 introns compared with over 6000 open-reading frames and that introns account for less than 1% of the genome (Goffeau et al. 1996). Those genes which do have introns usually have only one small one and the longest intron is only 1 kb in size.
However, proceeding up the evolutionary tree, the number of split genes, and the number and size of introns per gene, increases (Fig. 2.7 and Table 2.2). More important, genes that are related by evolution have exons of similar size, i.e. the introns are in the same position. However, the introns may vary in length, giving rise to variation in the length of
Per cent
80
60
40
20
S. cerevisiae
Per cent
30
20
10
D. melanogaster
Per cent
15
5
Number of exons
2 3 4 5 6 7 8 9 10 11 12 13 14 15 16 17 18 19 20 <30 <40 <60 >60 1
Mammals
10 0
0
0 95%
17%
6%
Fig. 2.7 The number of exons in three representative eukaryotes. Uninterrupted genes have only one exon and are totalled in the
the genes (Fig. 2.8). Note also that introns are much longer than exons, particularly in higher eukaryotes.
If a split gene has been cloned, it is possible to sub-clone either the exon or the intron sequences. If these sub-clones are used as probes in genomic Southern blots, it is possible to determine if these same sequences are present elsewhere in the genome. Often, the exon sequences of one gene are found to be related to sequences in one or more other genes. Some examples of suchgene familiesare given in Table 2.3. In some instances the duplicated genes
are clustered, whereas in others they are dispersed. Also, the members may have related, or even ident-ical, functions, although they may be expressed at different times or in different cell types. Thus dif-ferent globin proteins are found in embryonic and adult red blood cells, while different actins are found in muscle and non-muscle cells.
Functional divergence between members of a multigene family may extend to the loss of gene function by some members. Such pseudogenescome in two types. In the first type they retain the usual intron and exon structure but are functionless or
Table 2.2 Intron statistics for genes from different species.
Average Average Average Average mRNA % Exon
Species exon number intron number length (kb) length (kb) per gene
Yeast 1 0 1.6 1.6 100
Nematode 4 3 4.0 3.0 75
Fruit fly 4 3 11.3 2.7 24
Chicken 9 8 13.9 2.4 17
Mammals 7 6 16.6 2.2 13
0 50 100 150
Number of amino acids
122 334 159
229 99
119
4800 3400
141 113
130 850
38 76 115
32 68 103
31 105
31 99
30 104
161
143
153
141
146 Plant globin
Leghaemoglobin
Myoglobin
Human β-globin Human α-globin
1098
876
8659
677
1418 Size of
gene (bp)
Fig. 2.8 The placement of introns
they lack one or more exons. In the second type, found in dispersed gene families, processed pseu-dogenes are found which lack any sequences cor-responding to the introns or promoters of the functional gene members. Multiple copies of an exon also may be found because the same exons occur in several apparently unrelated genes. Exons that are shared by several genes are likely to encode poly-peptide regions that endow the disparate proteins with related properties, e.g. adenosine triphosphate (ATP) or DNA binding. Some genes appear to be mosaics that were constructed by patching together copies of individual exons recruited from different genes, a phenomenon known as exon shuffling(see pp. 31 and 114).
By contrast with exons, introns are not related to other sequences in the genome, although they contain the majority of dispersed, highly repetitive sequences. Thus, for some genes the exons con-stitute slightly repetitive sequences embedded in a unique context of introns. It should be noted that introns are not necessarily junk because there now is evidence that some of them encode functional RNA (Moore 1996).
Two intron databases have been constructed (Schisler & Palmer 2000). The Intron DataBase (IDB) contains detailed information about introns
and the other, the Intron Evolution DataBase, pro-vides a statistical analysis of the intron and exon sequences catalogued in the IDB.
Genome structure in viruses
and prokaryotes
The genomes of viruses and prokaryotes are very simple structures, although those of viruses show remarkable diversity (for a review see Dimmock et al. 2001). Most viruses have a single linear or circular genome but a few, such as reoviruses, bacteriophage
φ6 and some plant viruses, have segmented RNA genomes. For a long time it was believed that all eubacterial genomes consisted of a single circular chromosome. However, linear chromosomes have been found in Borrelia sp., Streptomyces sp. and Rhodococcus fascians and mapping suggests that Coxiella burnetiialso has a linear genome. Two chro-mosomes have been found in a number of bacteria includingRhodobacter spheroides, Brucella melitensis, Leptospira interrogansand Agrobacterium tumefaciens (Cole & Saint Girons 1994). In the case of Agrobac-terium, there is one circular chromosome and one non-homologous linear chromosome (Goodner et al. 1999). Linear plasmids have been found in Borrelia
Approximate Clustered (L) or
Gene family Organism no. of genes dispersed (D)
Actin Yeast 1 –
Slime mould 17 L, D
Drosophila 6 D
Chicken 8–10 D
Human 20–30 D
Tubulin Yeast 3 D
Trypanosome 30 L
Sea urchin 15 L, D
Mammals 25 D
a-Amylase Mouse 3 L
Rat 9 ?
Barley 7 ?
b-Globin Human 6 L
Lemur 4 L
Mouse 7 L
Chicken 4 L
Table 2.3 Some examples of multigene
sp. and Streptomyces sp. as well as a number of bacteria with circular chromosomes (Hinnebush & Tilley 1993). Borreliahas a very complex plasmid content with 12 linear molecules and nine circular molecules (Casjens et al. 2000).
Bacterial genomes lack the centromeres found in eukaryotic chromosomes although there may be a partitioning system based on membrane adherence. Duplication of the genomes is initiated at an origin of replication and may proceed unidirectionally. The structure of the origin of replication, the oriC locus, has been extensively studied in a range of bacteria and found to consist essentially of the same group of genes in a nearly identical order (Cole & Saint Girons 1994). The oriC locus is defined as a region harbour-ing the dnaA (DNA initiation) or gyrB (B subunit of DNA gyrase) genes linked to a ribosomal RNA operon.
Many bacterial and viral genomes are circular or can adopt a circular conformation for the purposes of replication. However, those viral and bacterial genomes which retain a linear configuration need a special mechanism to replicate the ends of the chro-mosome (see Box 2.1). A number of different strateg-ies for replicating the ends of linear molecules have been adopted by viruses (see Dimmock et al. 2001) but in bacteria there are two basic mechanisms (Volff & Altenbuchner 2000). InBorrelia, the chro-mosomes have covalently closed hairpin structures
at their termini. Such structures are also found in Borreliaplasmids, Escherichia coliphage N15, poxvir-uses and linear mitochondrial DNA molecules in the yeasts Williopsisand Pichia. Exactly how these hair-pin structures facilitate replication of the ends of the molecule is not known. By contrast, in Streptomyces, the linear molecules have proteins bound to the 5′
ends of the DNA and such proteins are also found in adenoviruses, and a number of bacteriophages and fungal and plant mitochondrial plasmids. These ter-minal proteins probably are involved in the comple-tion of replicacomple-tion. In addicomple-tion, Streptomyceslinear replicons have palindromic sequences and inverted repeats at their termini.
The bacterial genomes that have been completely sequenced have sizes ranging from 0.6 to 7.6 Mb. The difference in size between the smallest and the largest is not a result of introns for these are rare in prokaryotes (Edgell et al. 2000; Martinez-Abarca & Toro 2000). Nor is it a result of repeated DNA. Analysis of the kinetics of reassociation of denatured bacterial DNA did not indicate the presence of repeated DNA inE. coli(Britten & Kohne 1968) and only small amounts have been detected in all of the bacterial genomes that have been sequenced. In both Mycoplasma genitalium (0.58 Mb) and E. coli (4.6 Mb) about 90% of the genome is dedicated to protein-coding genes. Therefore the differences in size reflect the number of genes carried. This begs the
The ends of eukaryotic chromosomes are also the ends of linear duplex DNA and are known as telomeres. That these must have a special structure has been known for a long time. For example, if breaks in DNA duplexes are not rapidly repaired by ligation they undergo recombination or exonuclease digestion, yet, the ends of chromosomes are stable and chromosomes are not ligated together. Also, DNA replication is initiated in a 5′→3′direction with the aid of an RNA primer. After removal of this primer there is no way of completing the 5′end of the molecule (Fig. B2.1). Thus, in the absence of a method for completing the ends of the molecules, chromosomes would become shorter after each cell division.
Box 2.1 The need for telomeres
5’ 3’
3’ 5’
RNA primer
5’ 3’
Primer excision
5’ 3’
3’ 5’
5’ 3’
3’ 5’
5’ 3’
3’ 5’
5’ 3’
Fig. B2.1 Formation of two daughter molecules with
question as to the minimal genome size possible for a bacterium. The current view is about 300 genes (Mushegian 1999; see also p. 114). In Borreliathe small genome size (1.5 Mb) may be complemented by the high plasmid content (see above) which con-stitutes 0.67 Mb. These plasmids carry 535 genes, many of which have no counterparts in other organ-isms, suggesting that they perform specialized func-tions (Casjens et al. 2000).
The organization of organelle genomes
Mitochondria and chloroplasts both possess DNA genomes that code for all of the RNA species and some of the proteins involved in the functions of the organelle. In some lower eukaryotes the mitochon-drial (mt) DNA is linear but more usually organelle genomes take the form of a single circular molecule of DNA. Because each organelle contains several copies of the genome and because there are multiple organelles per cell, organelle DNA constitutes a repetitive sequence. Whereas chloroplast (ct) DNA falls in the range 120–200 kb, mtDNA varies enorm-ously in size. In animals it is relatively small, usu-ally less than 20 kb, but in plants it can be as big as 2000 kb.
Organization of the chloroplast genome
The complete sequence of ctDNA has been reported for over a dozen plants including the single-celled protist, Euglena (Hallick et al. 1993), a liverwort (Ohyama et al. 1986), and angiosperms such as Arabidopsis, spinach, tobacco and rice (Shinozaki et al. 1986; Hiratsukaet al. 1989; Satoet al. 1999;
Schmitz-Linneweber et al. 2001). Overall, there is a remarkable similarity in size and organization (Fig. 2.9 and Table 2.4). The differences in size are accounted for by differences in length of introns and intergenic regions and the number of genes. A gen-eral feature of ctDNA is a 10–24 kb sequence that is present in two identical copies as an inverted repeat. The proportion of the genome that is represented by introns can be very high, e.g. inEuglenait is 38%.
The chloroplast genome encodes 70–90 proteins, including those involved in photosynthesis, four rRNA genes and 30 or more tRNA genes. Chloroplast mRNAs are translated with the standard genetic code (cf. mitochondrial mRNA). However, edit-ing events cause the primary structures of several
Inverted repeats
Short unique sequence
Long unique sequence
Fig. 2.9 Generalized structure of ctDNA.
Feature Arabidopsis Spinach Maize
Inverted repeats 26 264 bp 25 073 bp 22 748 bp Short unique sequence 17 780 bp 17 860 bp 12 536 bp Long unique sequence 84 170 bp 82 719 bp 82 355 bp Length of total genome 154 478 bp 150 725 bp 140 387 bp
Number of genes 108 108 104
rRNA genes 4 4 4
tRNA genes 37 30 30
Protein-encoding genes 87 74 70
Table 2.4 Key features of chloroplast
transcripts to deviate from the corresponding gen-omic sequences by C to U transitions with a strong bias for changes at the second codon position (Maier et al. 1995). This editing makes it difficult to convert chloroplast nucleotide sequences into amino acid sequences for the corresponding gene products.
Astasia longais a colourless heterotrophic flagel-late which is closely reflagel-lated toEuglena gracilis. It con-tains a plastid DNA that is 73 kb in length, about half the size of the ctDNA from Euglena. Sequencing of this plastid DNA has shown that all chloroplast genes for photosynthesis-related proteins, except that encoding the large subunit of ribulose-1, 5-bisphosphate carboxylase, are missing (Gockel & Hachtel 2000).
Organization of the mitochondrial genome
Mitochondrial DNA (mtDNA) is an essential compon-ent of all eukaryotic cells. It ensures consistency of function (cellular respiration and oxidative phos-phorylation) despite the great diversity of genome organization. However, many of the genes for mito-chondrial proteins are found in the nucleus. Some organisms use the standard genetic code to translate nuclear mRNAs and a different code for their mito-chondrial mRNAs.
The mtDNA from animals is about 15–17 kb in size, nearly always circular and very compact. It encodes 37 genes: 13 for proteins, 22 for tRNAs and two for rRNAs. There are no introns and very little intergenic space. It has been found that mtDNA can survive in museum specimens and palaeontological remains and so is proving useful for the study of the genetic relationships of extinct animals (Hofreiter et al. 2001).
Plant mtDNA is much larger than that from ani-mals and in angiosperms ranges from 200 kb to 2 Mb (i.e. larger than some bacterial genomes). Plant mtDNAs rival the eukaryotic nucleus in terms of the C-value paradox they present. That is, larger plant mt genomes do not contain more genes than smaller ones but simply have more spacer DNA. Plant mtDNAs do have introns but there is little vari-ation in intron content and size across the range of angiosperms. As an example of the C-value paradox, ArabidopsismtDNA is 367 kb in size whereas human mtDNA is 16.6 kb in size but the former has only 14 more genes (Marienfeld et al. 1999). Angiosperm
mtDNAs are larger than their animal counterparts partly because of frequent duplications and partly because of the frequent capture of DNA sequences from the chloroplast and the nucleus. Plant mtDNAs also can lose sequences to the nucleus (Palmer et al. 2000).
Fungal mtDNAs resemble plant mtDNAs in that they are larger than those from animals and more heterogeneous in size, e.g. SaccharomycesmtDNA is 86 kb in size whereas that from Mucor is 34 kb (Fouryet al. 1998; Papp et al. 1999). Fungal mtDNA also contains introns.
Plant mtDNAs differ from those of animals and lower eukaryotes in more than just size. At the sequence level they have an exceptionally low rate of point mutations that is 50–100 times lower than that seen in vertebrate mitochondria. At the structural level, plant mtDNAs have a high rate of genomic rearrangement and duplication.
The organization of nuclear DNA
in eukaryotes
Gross anatomy
Each eukaryotic nucleus encloses a fixed number of chromosomes which contain the nuclear DNA. During most of a cell’s life, its chromosomes exist in a highly extended linear form. Prior to cell division, however, they condense into much more compact bodies which can be examined microscopically after staining. The duplication of chromosomes occurs chiefly when they are in the extended stage (inter-phase). One part of the chromosome, however, always duplicates during the contracted metaphase state. This is the centromere, a body that controls the movement of the chromosome during mitosis. Its structure is discussed later (p. 30).