MINISTRY OF HEALTH, MALAYSIA
National Trauma Database
National Trauma Database
Ministry of Health Malaysia
NATIONAL TRAUMA DATABASE
JANUARY 2009 TO DECEMBER 2009
FOURTH REPORT
Edited by
Sabariah Faizah Jamaluddin Mahathar Abd Wahab Mohd Yusof Abdul Wahab
Yeoh Tze Ming Ismail Mohd Saiboon
A publication of the National Trauma Database
And
July 2011
©National Trauma Database, Malaysia
Published by the
National Trauma Database (NTrD) Hospital Sungai Buloh
Jalan Hospital 47000 Sungai Buloh Selangor Darul Ehsan Malaysia
Tel : 603-6145 4333 (ext:5231)
Fax : 603-6157 2727
Email : [email protected]
Website : http://www.acrm.org.my/ntrd
Disclaimer
This report has been supplied by the NTrD. The interpretation and reporting of these data are the responsibility of the editors.
Suggested citation
The suggested citation for this report is as follows:
Sabariah Faizah Jamaluddin, Mahathar Abd Wahab, Mohd Yusof Abdul Wahab,Yeoh Tze Ming, Ismail Mohd Saiboon (Eds) National Trauma Database January 2009 To December 2009– Fourth Report, Malaysia 2011.
Electronic version
i
ACKNOWLEDGEMENTS
The National Trauma Database Committee would like to thank all those
who have participated and contributed to our fourth report, from January
2009 to December 2009.
We would like to extend our special thanks to the following:
1.
All centre coordinators, doctors, medical assistants and staff nurses
from the Emergency Departments of the participating hospitals.
Their commitment and timely data collection and submission helped
smooth the progression of the project.
2.
The Clinical Research Centre for its continuous support and guidance.
ii
INTRODUCTION
The National Trauma Database 2009
–
Fourth Report provides a descriptive
analysis of patients with major trauma who were admitted and referred to
eight participating hospitals in Malaysia. The data source for this report is
derived from the National Trauma Database (NTrD). A major trauma
patient is defined as patient with one of the following criteria:
i.
Patient who died from injuries after admission.
ii.
Patient with Injury Severity Score (ISS) of >(more than) 15
iii.
Patient admitted to Intensive Care Units (ICUs) or High
Dependency Wards (HDWs) for > (more than) 24 hours and who
were mechanically ventilated.
iv.
Urgent surgery within 24 hours for intracranial, intrathoracic,
intraabdominal, or fixation for pelvic or spinal injuries
v.
All severe head injury patient rated 3-8 on the Glasgow Coma
Scale (GCS)
The report is presented in five Chapters:
Chapter 1 provides an overview of the
patie ts’
demographics, including
gender, age group, race, time and date of admission and admission type.
Chapter 2 assesses the patient
’
s details of injury, such as injury mechanism,
injury intent, injury cause, injury place, disposition, ICU admission, and
systolic BP. The patients were also rated on the Glasgow Coma Scale (GCS),
Revised Trauma Score (RTS), Abbreviated Injury Scale (AIS) and Injury
Severity Score (ISS).
iii
Chapter 4 provides information on the outcome of the patients, which is
then categorized according to age group, injury mechanism, injury cause,
injury places, cause and place of injury, admission types, systolic BP, GCS,
RTS, AIS, ISS, and ICU admission.
The Trauma Injury Severity Score (TRISS) methodology is also used to
determine the probability of survival based on the ISS, RTS, mechanism of
i jury a d patie t’s age.
Chapter 5 shows the total length of stay in hospitals and ICUs.
The limitations of the study are:
i.
Under reporting - The reported data were less than the actual
number of cases.
iv
About NTrD
The National Trauma Database (NTrD) is a service initiated and supported
by the Ministry of Health (MOH) to collect information
o Malaysia’s
major
trauma incidences and its risk factors, and management. Such information
is of vital value for the MOH, non-governmental organizations, private
healthcare providers and other interested parties to implement strategies
to strengthen and improve trauma care in the country.
The NTrD is co-sponsored by the following organizations of the Ministry of
Health Malaysia:
i.
Emergency Medical and Trauma Services
ii.
Surgical Services
iii.
Clinical Research Centre
The objectives of the NTrD are to:
1. Determine the frequency, mechanisms of injury and distribution of major
trauma in Malaysia. The statistic and data will be of importance in determining the resources utilization in the management of major trauma.
2. Determine the outcome and probability of survival of trauma patients.
3. Evaluate major trauma management practices in the participating
hospitals and design better guidelines for improved trauma care.
4. Determine the effectiveness and impact after introduction of improved
practices.
5. Stimulate and facilitate research on major trauma and its management.
v
METHOD OF DATA COLLECTION
Coverage
The NTrD is a multi-centre study with eight MOH hospitals as source data
provider (SDP) in year 2009. The number of centres has from five centres in
previous reports from May 2006 to December 2008.
Registration method
The participation of Source Data Providers (SDPs) was entirely voluntary.
A standardized Case Report Form (CRF) was used for data collection (Refer
to Appendix A). The CRF gathers information on patient demography,
admission, injury details, clinical details, diagnostic and operative
procedures, in-hospital outcome and Injury Severity Scores.
The data were then uploaded onto the NTrD, a custom designed and secure
web based application. The data transferred to NTrD was kept strictly
confidential with access only to authorized individuals involved in the NTrD.
Two level user authentications were practiced, that is in addition to the
login ID and password, user were required to enter the authentication code
sent as a text message to their personal mobile phone before they are able
to access the web application. Access is controlled according to the role of
the user. Data is then analyzed, interpreted and presented in reports and
disseminated to the users.
Statistical analysis
Descriptive analysis was conducted on all the variables. All data were
described in percentages except for continuous data such as length of stay
(LOS). Missing data was excluded and the analysis was confined to
complete data. The TRISS methodology was used to determine the
probability of survival which incorporates ISS, RTS, mechanisms of injury
a d the patie t’s age.
vi
MEMBERS OF THE STEERING COMMITTEE OF THE NTrD
1.
Dr Sabariah Faizah Jamaluddin
(Chairman)
Head of Department
Emergency and Trauma Department,
Hospital Sungai Buloh
2.
Dr Goh Pik Pin
Director
Clinical Research Centre,
Ministry of Health
3.
Dr
Fatahul
Laham
Bin
Mohamed
Head of Department
Emergency and Trauma Department,
Hospital Sultanah Bahiyah
4.
Dr Jamaiyah Haniff
Head of
Clinical Epidemiology Unit,
Clinical Research Centre
5.
Dr Mahathar Bin Abdul Wahab
Emergency Physician
Emergency Department,
Kuala Lumpur Hospital
SUPPORTING STAFF OF THE NTrD
Role
Team member
1.
Clinical Registry Manager
Mr Mohd Fadhleen Bin Dom
(October 2007 - July 2009)
Ms Lithnes Kalaivani Palniandy
(July 2009
–
November 2010)
Ms Dan Siew Peng
(December 2010- April 2011)
2.
Clinical Data Manager
Ms Teo Jau Shya
3.
Medical Reviewer
Ms Anne John Michael
4.
Clinical Epidemiologist
Dr Jamaiyah Bte Haniff
5.
Clinical Economist
Dr Shanti Varatharajan
6.
Biostatistician
Ms Lena Yeap
Ms Yeong Lai Chee
7.
Web Application Developer
Mrs Sayani Bte Sabran
8.
Desktop Publisher
Mrs Azizah Bte Alimat
9.
Database Admin
Ms Lim Jie Ying
vii
LIST OF PARTICIPATING CENTRES
1.
Selayang Hospital
Department
: Emergency and Trauma
Head of Department : Dr Mohamed Alwi Bin Haji Abdul Rahman
Coordinator
: Dr Ahmad Fadzil Bin Sujak
Members
: MA Hushaimi Bin Husin
SN Aisah Bte Ibos
2.
Kuala Lumpur Hospital
Department
: Emergency and Trauma
Head of Department
: Dato Dr Abu Hassan Asaari Bin Abdullah
Coordinator
: Dr Mahathar Bin Ab Wahab
Members
: MA Mohamad Aiyri Harizat Abdul Rahim
MA Mudzaffar Shah Bin Abdul Ghaffar
3.
Sultanah Bahiyah Hospital
Department : Emergency and Trauma
Head of Department : Dr Fatahul Laham Bin Mohamed
Members : Dr Zaidah Bte M. Arif
MA Mohd Yusof Mamat
MA M.Sani Abdullah
4.
Pulau Pinang Hospital
Department
: Emergency and Trauma
Head of Department : Dr Teo Aik Howe
Members
: MA Raj Kumar a/l Paramasiven
viii
5.
Sultanah Aminah Hospital
Department
: Emergency and Trauma
Head of Department : Dr Md Saed Bin Mian
Members
: MA Raschidi Bin Abdul Karim
: MA Radzman Bin Che Rus
: MA Ahmad Salimi Bin Mohd Noor
: MA Norzamzuri Bin Zakaria
6.
Sungai Buloh Hospital
Department
: Emergency and Trauma
Head of Department : Dr Sabariah Faizah Jamaluddin
Members
: MA Mazlan Bin Zakariya
: SN Asmalida Bte Md Emran
7.
Tengku Ampuan Rahimah Hospital
Department
: Emergency and Trauma
Head of Department : Dr Ahmad Tajuddin Bin Mohamad Noor
Coordinator
: Dr Ranjini Sivaganabalan
Members
: SN Marykutty Mathews
: SN Megala a/p Soomoo
8.
Hospital Ampang
Department
: Emergency and Trauma
Head of Department
: Dr. Ridzua Bi Dato’ Mohd Isa
Members
: MA Mohd Fadhillah
ix
ABBREVIATIONS
AIS
Abbreviated Injury Scale
ALOS
Average Length of Stay
BP
Blood Pressure
CRC
Clinical Research Centre
CRF
Case Report Form
ED Emergency Department
GCS
Glasgow Coma Score
HDW
High Dependency Ward
ICU
Intensive Care Unit
ISS
Injury Severity Score
LOS
Length of Stay
MOH
Ministry of Health
NTrD
National Trauma Database
OP
Operation Procedure
OT
Operating Theatre
Ps
Probability of Survival
RTA
Road Traffic Accident
RTS
Revised Trauma Score
SDP
Source Data Provider
x
GLOSSARY
Disease Register
The on-going systemic collection, analysis and
interpretation of specific disease data essential to
the planning, implementation and evaluation of
clinical and public health practices, closely
integrated with dissemination of these data to
those who need to know. The final link in the chain
is the application of these data to the
management, prevention and control of the
disease. A registration system includes a functional
capacity for data collection, analysis and
dissemination, linked to clinical and public health
programmes.
Site
The location of a SDP reporting data on registrable
patients to the registry.
Source Data Providers The individuals or institutions that report the
required data to the registry.
Sponsors
The individuals or institutions that own the
registry.
xi
EDITORIAL TEAM
CHIEF EDITOR:
Dr Sabariah Faizah Jamaluddin
Head
Emergency and Trauma Department,
Sungai Buloh Hospital
Dr Mahathar Bin Abd Wahab
Emergency Physician
Emergency and Trauma Department
Kuala Lumpur Hospital
Dato Dr Mohd Yusof Bin Abdul
Wahab
Consultant General Surgeon
Department of Surgery
Tengku Ampuan Rahimah Hospital
Assoc Prof Dr Ismail Bin Mohd
Saiboon
Emergency and Orthopaedic Surgeon
Emergency Medicine Department
University Kebangsaan Malaysia Medical
Centre
MEMBERS OF THE NTrD TEAM
Ms Dan Siew Peng
NTrD Registry Manager
Dr Lee Kun Yun
CRC Hospital Sungai Buloh
EXPERT PANEL ON REPORT WRITING
Dr Sabariah Faizah Jamaluddin
Head
Emergency and Trauma Department,
Sungai Buloh Hospital
Dr Mahathar Bin Abd Wahab
Emergency Physician
Emergency and Trauma Department
Kuala Lumpur Hospital
Dato Dr Mohd Yusof Bin Abdul
Wahab
Consultant General Surgeon
Department of Surgery
Tengku Ampuan Rahimah Hospital
Mr Yeoh Tze Ming
General Surgeon
Department of Surgery
Tengku Ampuan Rahimah Hospital
Assoc Prof Dr Ismail Bin Mohd
Saiboon
Emergency and Orthopaedic Surgeon
Emergency Medicine Department
xii
CONTENTS
Acknowledgements
i
Introduction
ii-iv
Method of Data Collection
v
Steering Committee and Supporting Staff of the NTrD
vi
List of Participating Centres of NTrD
vii-viii
Abbreviations and Glossary
ix
Glossary
x
Editorial Team
xi
Contents
xii
Report Summary
1
Listing of Tables
6
Listing of Figures
8
1
CHAPTER 1: DEMOGRAPHICS
There were a total of 166,768 trauma patients admitted to the
Emergency Department from eight participating centres in 2009. Major
trauma patients constituted 1.2% (2061/166,768) of all trauma admissions.
Centre E reported the highest number of major trauma cases; making up
one third of total cases (30.9%).
Males were about 6.5 times more likely than the females to sustain
major trauma. (male 86.6% versus female 13.4%). The younger age group
(15-34 years: 56.6%) was at the highest risk of major trauma. From the
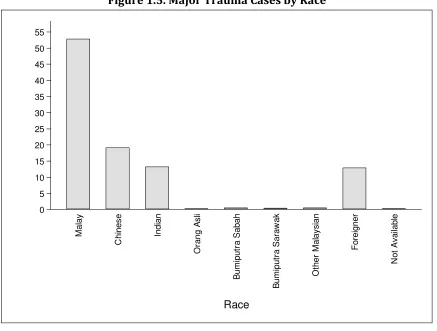
2061 cases of major trauma, 52.9% involved Malays and 12.9% involved
foreigners.
Most of the major trauma patients attended the emergency
department (ED) between 1801-2400 hours (31.3%). There were similar
rates of admission on all days except for Sundays, which was slightly busier.
2
CHAPTER 2: INJURY DETAILS
The majority of the injuries were from blunt trauma (96.3%). A high
percentage of the injuries were unintentional (91.2%) with most of the
cases due to road traffic accidents (76.8%). Motorcyclists (66.0%) were at
the highest risk of road traffic accidents. Injuries from home accounted for
6.8% of total cases while 5.0% of the injuries occured at
industrial/construction areas.
Emergency physician and surgical field specialists reviewed 19.9%
and 11.2% of the cases respectively at the Emergency Department. About
25.9% of the cases were sent directly to the general ward, another 23.0% of
the cases were sent directly to the operating theatre (OT) from ED and
21.0% of the cases were admitted to ICU from ED.
During hospital admission, 56.8% of the patients received ICU care.
Centre E (68.0%) reported the highest number of patients admitted to ICU
while Centre H only sent 4 (16.7%) major trauma patients to ICU in 2009.
3
CHAPTER 3: OPERATIVE MANAGEMENT
In 2009, endotracheal intubation was performed on 64.8% of
patients. CT Scan was done on 71% of patients. Majority of the CTs
performed on major trauma patients was for CT Brain (92.5%), followed by
cervical spine CTs (42.5%). Ultrasound/FAST was carried out in 29.5% of the
cases. Chest tube was inserted in 7.1% of major trauma patients in the
emergency department.
Half (51.33%) of the major trauma patients underwent surgery; the
common reason was for cranial injuries (63.6%). Surgery for
intra-abdominal injuries was the second most common (16.92%), followed by
pelvic fixation (1.61%).
CHAPTER 4: OUTCOME
The survival rate for major trauma cases was 72.1 % of the 2059
cases documented in 2009. This ranged from 60.9% to 83.5 % for individual
centres; Centre B had the highest percentage of survival. Centre H had the
highest mortality rate at 39.1%.
Of those who survived, majority (65.9%) were discharged home.
Others were transferred back to the referring hospital (18.8%), transferred
to other hospitals (11.2%) or discharged against medical advice (4.0%).
The survival rates among those younger than 55 years old were
higher (ranging between 64.7 % and 93.6 %). The elderly, aged more than
65 years old, had lower survival rates ranging from 52.8 % to 22.2%.
4
There were more survivors among patients who were transferred
(75.7%) compared with those who were admitted directly (68.2%).
Patients who had a systolic blood pressure (SBP) of more than
89mmHg on arrival had a higher survival rate (>74.0%) compared with
those who presented with SBP of less than 76mmHg. The survival rate was
higher in those with Glasgow Coma Scale (GCS) of 13-15 (88.0 %) and 9-12
(83.4 %). The survival rate for patients with GCS 3-8 was only 57.8 %.
Patients who had a Revised Trauma Score (RTS) of more than 5 had a
much better outcome, with a survival rate of more than 65.0 %. Similarly,
for those who had an Abbreviated Injury Scale (AIS) of more than or equal
to , sur i al rate as 7 .0 %. Patie ts’ ho had I jury Se erity Score ISS
of more than 40, 57.6% survived
. Patie ts’ ho had ISS
-40, 71.8%
survived; ISS 16-25, 76.9% survived.
Most death occurred in patients with ISS > 40 (42.4%) and those with
ISS <10 (43.7%). The mortality rate for those who admitted to Intensive
Care Unit (ICU) was 27.1%.
5
CHAPTER 5: LENGTH OF STAY
The average length-of-stay (ALOS) for major trauma patients from
the eight participating hospitals in 2009 ranged from 3 to 18 days. Two
centres recorded ALOS of 7 or less days while the other 6 centres recorded
ALOS of between 8 to 18 days.
Out of the 2056 cases recorded, 72.0% of patients survived and the
other 28.0 % succumbed to their injuries. Among those who survived, the
ALOS was between 5 and 22 days while the ALOS for those who died were
between 0 and 8 days. The ALOS for patients admitted in ICU and survived
was between 5 and 11 days.
6
Listing of Tables
Chapter 1 Demographics
Table 1.1.Total Number of Trauma Admission at Emergency Department by Centre 11
Table 1.2. Major Trauma Cases by Centre ... 12
Table 1.3. Major Trauma Cases by Gender ... 13
Table 1.4. Major Trauma Cases by Age Group ... 14
Table 1.5. Major Trauma Cases by Race ... 15
Table 1.6. Time of Admission for Major Trauma Cases... 16
Table 1.7. Day of Admission for Major Trauma Cases ... 17
Table 1.8. Type of Admission for Major Trauma Cases ... 188
Table 1.8a. Type of Admission for Major Trauma Cases by Centre ... 199
Table 1.9. Type of Admission Referred From for Major Trauma Cases ... 20
Chapter 2 Injury Details Table 2.1. Mechanism of Injury for Major Trauma Cases ... 21
Table 2.2. Major Trauma Cases by Injury Intent ... 22
Table 2.3. Major Trauma Cases by Cause of Injury ... 23
Table 2.3a. Major Trauma Cases by Type of Road Traffic Accident ... 24
Table 2.4. Major Trauma Cases by Place of Injury ... 25
Table 2.5. Category of Initial Reviewing Officer in ED for Major Trauma Cases ... 26
Table 2.6. Disposition of Major Trauma Cases from ED ... 27
Table 2.7. ICU Admission for Major Trauma Cases ... 28
Table 2.7a. Total ICU Admissions for Major Trauma Cases by Centre ... 29
Table 2.8. Major Trauma Cases by Systolic BP ... 30
Table 2.9. Major Trauma Cases by Glasgow Coma Scale (GCS) ... 31
Table 2.10. Major Trauma Cases by RTS ... 32
Table 2.11. Injuries According to Body Region for Major Trauma Cases ... 33
Table 2.12. Abbreviated Injury Score (AIS) for All Major Trauma Patients ... 34
Table 2.12a. Distribution According to Body Region for Major Trauma Cases ... 41
Table . . Body Region with Abbreviated )njury Score A)S for Major Trauma Cases . 42 Table 2.14. Injury Severity Score (ISS) for Major Trauma Cases ... 43
Chapter 3 Operative Management Table 3.1. Procedure Done in ED for Major Trauma Cases ... 44
Table 3.2. Operative Management for Major Trauma Cases ... 45
7
Chapter 4 Outcome
Table 4.1. Total Outcome for Major Trauma Cases ... 47 Table 4.1a. Outcome for Major Trauma Cases by Centre ... 48 Table 4.2. Disposition of Survivors at Discharge for Major Trauma Cases ... 49 Table 4.3. Outcome for Major Trauma Cases by Age Group ... 50 Table 4.4. Outcome for Major Trauma Cases by Mechanism of Injury ... 51 Table 4.5. Cause of Injury for Major Trauma Cases by Outcome 52 Table 4.6. Outcome by Type of Road Traffic Accident for Major Trauma Cases ... 533 Table 4.7. Place of Injury for Major Trauma Cases by Outcome ... 54 Table 4.8. Type of Admission for Major Trauma Cases by Outcome ... 55 Table 4.9. Systolic BP for Major Trauma Cases by Outcome ... 56 Table 4.10. Glasgow Coma Score (GCS) for Major Trauma Cases by Outcome ... 57 Table 4.11. Revised Trauma Score (RTS) for Major Trauma Cases by Outcome ... 58
Table . . Outcome with A)S for Major Trauma Cases ... 59 Table 4.13. ISS for Major Trauma Cases by Outcome ... 60 Table 4.14. ICU Admissions for Major Trauma Cases by Outcome ... 61 Table 4.15. TRISS Distribution for Major Trauma Cases ... 62 Table 4.16. Observed and Expected Outcome for Major Trauma Cases ... 63
Chapter 5 Length of Stay
8
Listing of Figures
Chapter 1 Demographics
Figure 1.1. Total Number of Trauma Admission at Emergency Department by Centre .. 10 Figure 1.1a. Total Number of Trauma Admission at Emergency Department by Centre 11
Figure 1.2. Major Trauma Cases by Centre ... 12 Figure 1.3. Major Trauma Cases by Gender ... 13 Figure 1.4. Major Trauma Cases by Age Group ... 14 Figure 1.5. Major Trauma Cases by Race ... 15 Figure 1.6. Time of Admission for Major Trauma Cases ... 16 Figure 1.7. Day of Admission for Major Trauma Cases ... 17 Figure 1.8. Type of Admission for Major Trauma Cases ... 18 Figure 1.8a. Type of Admission for Major Trauma Cases by Centre ... 19 Figure 1.9. Type of Admission Referred From for Major Trauma Cases ... 20
Chapter 2 Injury Details
Figure 2.1. Mechanism of Injury for Major Trauma Cases ... 21 Figure 2.2. Major Trauma Cases by Injury Intent ... 22 Figure 2.3. Major Trauma Cases by Cause of Injury ... 23 Figure 2.3a. Major Trauma Cases by Type of Road Traffic Accident ... 24 Figure 2.4. Major Trauma Cases by Place of Injury ... 25 Figure 2.5. Category of Initial Reviewing Officer in ED for Major Trauma Cases ... 26 Figure 2.6. Disposition of Major Trauma Cases from ED ... 27 Figure 2.7. ICU Admission for Major Trauma Cases ... 28 Figure 2.7a. ICU Admissions for Major Trauma Cases by Centre ... 29 Figure 2.8. Major Trauma Cases by Systolic BP ... 30 Figure 2.9. Major Trauma Cases by Glasgow Coma Scale (GCS) ... 31 Figure 2.10. Major Trauma Cases by RTS ... 32 Figure 2.11. Injuries According to Body Region for Major Trauma Cases ... 33 Figure 2.12. Abbreviated Injury Score (AIS) for All Major Trauma Patients ... 344 Figure 2.12a. Abbreviated Injury Score (AIS) Distribution According to Body Region
for Major Trauma Cases ... 35 Figure 2.12a(i). The Head and Neck Region ... 35 Figure 2.12a(ii). The Face Region ... 36 Figure 2.12a(iii). The Thorax Region ... 377 Figure 2.12a(iv). The Abdomen/Pelvic Content Region ... 38 Figure 2.12a(v). The Extremities /Pelvic Girdle Region ... 39 Figure 2.12a(vi). The External Region ... 40 Figure 2.13. Body Region with Abbreviated )njury Score A)S 3 for Major Trauma
9
Chapter 3 Operative Management
Figure 3.1. Procedure Done in Emergency Department for Major Trauma Cases ... 44 Figure 3.2. Operative Management for Major Trauma Cases ... 45 Figure 3.3. Operative Procedure for Major Trauma Cases ... 46
Chapter 4 Outcome
Figure 4.1. Total Outcome for Major Trauma Cases ... 47 Figure 4.1a. Outcome for Major Trauma Cases by Centre... 48 Figure 4.2. Disposition of Survivors at Discharge for Major Trauma Cases ... 49 Figure 4.3. Outcome for Major Trauma Cases by Age Group ... 50 Figure 4.4. Mechanism of Injury by Outcome for Total Major Trauma Cases ... 51 Figure 4.5. Injury Cause for Major Trauma Cases by Outcome ... 52 Figure 4.6. Outcome by Type of Road Traffic Accident for Major Trauma Cases ... 53 Figure 4.7. Place of Injury for Major Trauma Cases by Outcome 54 Figure 4.8. Type of Admission for Major Trauma Cases by Outcome ... 55 Figure 4.9. Systolic BP for Major Trauma Cases by Outcome ... 56 Figure 4.10. Glasgow Coma Score (GCS) for Major Trauma Cases by Outcome ... 57 Figure 4.11. Revised Trauma Score (RTS) for Major Trauma Cases by Outcome ... 58 Figure 4.12. Outcome with A)S for Major Trauma Cases ... 59 Figure 4.13. ISS for Major Trauma Cases by Outcome ... 60 Figure 4.14. ICU Admissions for Major Trauma Cases by Outcome ... 61 Figure 4.15. TRISS for Major Trauma Cases ... 62 Figure 4.16. Observed and Expected Outcome for Major Trauma Cases ... 63
Chapter 5 Length of Stay
10
Chapter 1: Demographic
Figure 1.1. Total Number of Trauma Admission at Emergency Department by Centre
0 5,000 10,000 15,000 20,000 25,000 30,000 35,000 40,000 45,000 50,000 55,000
A B C D E F G H
11
Figure 1.1a. Total Trauma Emergency Department Admissions by Centre
0 5 10 15 20 25 30
A B C D E F G H
Centre
Table 1.1. Total Trauma Emergency Department Admissions by Centre
Centre No %
A 14,538 8.72
B 50,983 30.57
C 13,699 8.21
D 18,771 11.26
E 19,692 11.81
F 9,998 6.00
G 32,757 19.64
H 6,330 3.80
12
Figure 1.2. Major Trauma Cases by Centre
0 5 10 15 20 25 30 35
A B C D E F G H
Centre
Table 1.2. Major Trauma Cases by Centre
Centre No. %
A 48 2.33
B 480 23.29
C 227 11.01
D 137 6.65
E 637 30.91
F 185 8.98
G 323 15.67
H 24 1.16
13
Figure 1.3. Major Trauma Cases by Gender
0 10 20 30 40 50 60 70 80 90
Male Female
Gender
Table 1.3. Major Trauma Cases by Gender
Gender No. %
Male 1784 86.56
Female 277 13.44
14
Figure 1.4. Major Trauma Cases by Age Group
0 5 10 15 20 25 30 35
>0-4 5-14 15-24 25-34 35-44 45-54 55-64 65-74 75-84 >=85
Age Group
Table 1.4. Major Trauma Cases by Age Group
Age group No. %
>0-4 31 1.5
5-14 143 6.94
15-24 703 34.11
25-34 464 22.51
35-44 271 13.15
45-54 173 8.39
55-64 146 7.08
65-74 87 4.22
75-84 34 1.65
9 0.44
15
Figure 1.5. Major Trauma Cases by Race
0
Table 1.5. Major Trauma Cases by Race
16
Figure 1.6. Time of Admission for Major Trauma Cases
0 2 4 6 8 10 12 14 16 18 20 22 24 26 28 30 32
0001-0600 0601-1200 1201-1800 1801-2400
Time of Admission
Table 1.6. Time of Admission for Major Trauma Cases
Time of Admission (Hours) No. %
0001-0600 536 26.01
0601-1200 398 19.31
1201-1800 482 23.39
1801-2400 645 31.3
17
Figure 1.7. Day of Admission for Major Trauma Cases
0 2 4 6 8 10 12 14 16 18
Sunday Monday Tuesday Wednesday Thursday Friday Saturday
Day
Table 1.7. Day of Admission for Major Trauma Cases
Admission (Days) No. %
Sunday 336 16.3
Monday 299 14.51
Tuesday 289 14.02
Wednesday 272 13.2
Thursday 300 14.56
Friday 289 14.02
Saturday 276 13.39
18
Figure 1.8. Type of Admission for Major Trauma Cases
0 10 20 30 40 50 60
Direct Transferred/ Referral
Admission Type
Table 1.8. Type of Admission for Major Trauma Cases
Admission Type No. %
Direct 993 48.18
Transferred / Referral 1068 51.82
19
Figure 1.8a. Type of Admission for Major Trauma Cases by Centre
0 20 40 60 80 100
A B C D E F G H
Center
Direct Transfer
Table 1.8a. Type of Admission for Major Trauma Cases by Centre
Centre Direct Transferred / Referral Total
No. % No. %
A 48 100 0 0 48
B 184 38.3 296 61.7 480
C 129 56.8 98 43.2 227
D 85 62 52 38 137
E 178 27.9 459 72.1 637
F 118 63.8 67 36.2 185
G 228 70.6 95 29.4 323
H 23 95.8 1 4.2 24
TOTAL 993 48.2 1068 51.8 2061
20
Figure 1.9. Source of Referral for Major Trauma Cases
0 5 10 15 20 25 30 35 40 45 50
Hospital with Specialist
Hospital without Specialist
Health Clinics
Private Hospital
Private Clinics
Source of Referral
Table 1.9. Type of Admission Referred From for Major Trauma Cases
Source of Referral No. %
Government Hospital with Specialist 493 46.47
Goverment Hospital without Specialist 482 45.43
Health Clinics 24 2.26
Private Hospital 52 4.9
Private Clinics 10 0.94
TOTAL 1061 100
21
Chapter 2: INJURY DETAILS
Figure 2.1. Mechanism of Injury for Major Trauma Cases
0 10 20 30 40 50 60 70 80 90 100
Blunt Penetrating Burns
Mechanism of Injury
Table 2.1. Mechanism of Injury for Major Trauma Cases
Mechanism of Injury
(Total Patients=2061) No. %
Blunt 1985 96.31
Penetrating 58 2.81
Burns 21 1.02
22
Figure 2.2. Major Trauma Cases by Injury Intent
0
Table 2.2. Major Trauma Cases by Injury Intent
Injury Intent (Total Patients=2061) No. %
Unintentional 1880 91.22
Intentional Self Harm 15 0.73
Domestic Violence 0 0
Intent Cannot be Determined 67 3.25
Child Neglect / Maltreatment 1 0.05
Intentional Assault 96 4.66
23
Figure 2.3. Major Trauma Cases by Cause of Injury
0
Cause of Injury
Table 2.3. Major Trauma Cases by Cause of Injury
Cause of Injury No. %
Road Traffic Accident 1582 76.76
Industrial Accident 26 1.26
24
Figure 2.3a. Major Trauma Cases by Type of Road Traffic Accident
0
Type of Road Traffic Accident
Table 2.3a. Major Trauma Cases by Type of Road Traffic Accident
Type of Road Traffic Accident No. %
Motorcycle Rider 1044 65.99
Motorcycle Pillion 100 6.32
25
Figure 2.4. Major Trauma Cases by Place of Injury
0
Place of Injury
Table 2.4. Major Trauma Cases by Place of Injury
Place of Injury No. %
Road/Street/Highway 1678 81.42
Home 140 6.79
Industrial / Construction Area 102 4.95
School / Kindergarten / Nursery 6 0.29
Sports Recreational Area 13 0.63
Trade / Service Area 22 1.07
Residential 10 0.49
Other Specified Place 30 1.46
Unspecified Place 24 1.16
Not Available 36 1.75
26
Figure 2.5. Category of Initial Reviewing Officer in Emergency Department for Major Trauma Cases
0
Medical Officer / Trainee Specialist / Consultant
Category of Initial Reviewing Officer
Emergency Physician Surgeon
Table 2.5. Category of Initial Reviewing Officer in Emergency Department for Major Trauma Cases
Category of Initial Reviewing Officer
Emergency
Physician Surgeon
No. % No. %
Medical Officer / Trainee 1643 80.15 1761
88. 76
Specialist / Consultant 407 19.85 223
11. 24
TOTAL 2050 100 1984 100
27
Figure 2.6. Disposition of Major Trauma Cases from ED
0
Disposition from ED
Table 2.6. Disposition of Major Trauma Cases from ED
Disposition From ED No. %
Intensive Care Unit (ICU) 435 21.11
Operating Theatre (OT) 473 22.95
General Ward 534 25.91
Mortuary 147 7.13
AOR 10 0.49
High Dependency Ward (HDW) 393 19.07
Other Hospital 69 3.35
Not Available 0 0
28
Figure 2.7. ICU Admission for Major Trauma Cases
0 5 10 15 20 25 30 35 40 45 50 55 60
Yes No
ICU Admission
Table 2.7. ICU Admission for Major Trauma Cases
ICU Admission No. %
Yes 1170 56.77
No 891 43.23
29
Figure 2.7a. ICU Admissions for Major Trauma Cases by Centre
0
Table 2.7a. Total ICU Admissions for Major Trauma Cases by Centre
Centre
ICU admissions
30
Figure 2.8. Major Trauma Cases by Systolic BP
0 5 10 15 20 25 30 35 40 45 50 55 60 65
1-49 50-75 76-89 90-120 >120
Systolic BP
Table 2.8. Major Trauma Cases by Systolic BP
Systolic BP No. %
1-49 10 0.49
50-75 42 2.04
76-89 74 3.59
90-120 664 32.22
>120 1271 61.67
31
Figure 2.9. Major Trauma Cases by Glasgow Coma Scale (GCS)
0 5 10 15 20 25 30 35 40 45 50
13-15 9-12 3-8
GCS
Table 2.9. Major Trauma Cases by Glasgow Coma Scale (GCS)
Glasgow Coma Scale (GCS) No. %
13-15 625 30.33
9-12 410 19.89
3-8 1026 49.78
32
Figure 2.10. Major Trauma Cases by Revised Trauma Score (RTS)
0 5 10 15 20 25 30 35
0-0.99 1-1.99 2-2.99 3-3.99 4-4.99 5-5.99 6-6.99 7-7.84
RTS
Table 2.10. Major Trauma Cases by Revised Trauma Score (RTS)
RTS No. %
0-0.99 0 0
1-1.99 7 0.34
2-2.99 16 0.78
3-3.99 43 2.09
4-4.99 341 16.55
5-5.99 625 30.33
6-6.99 416 20.18
7-7.84 613 29.74
33
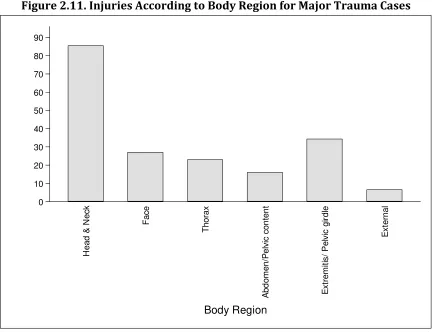
Figure 2.11. Injuries According to Body Region for Major Trauma Cases
0
Table 2.11. Injuries According to Body Region for Major Trauma Cases
Body Region (Total Patients=2061) No. %
Head & Neck 1743 85.36
Face 551 26.98
Thorax 469 22.97
Abdomen/Pelvic content 326 15.96
Extremitis/ Pelvic girdle 701 34.33
External 133 6.51
34
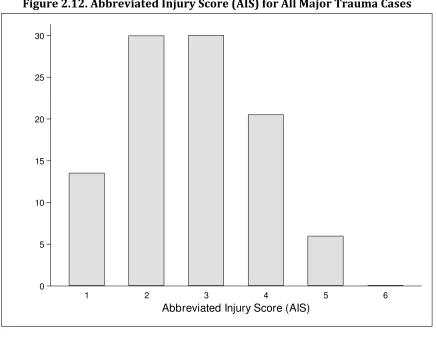
Figure 2.12. Abbreviated Injury Score (AIS) for All Major Trauma Cases
0 5 10 15 20 25 30
1 2 3 4 5 6
Abbreviated Injury Score (AIS)
Table 2.12. Abbreviated Injury Score (AIS) for All Major Trauma Cases
AIS No. %
1 1065 13.52
2 2360 29.96
3 2365 30.02
4 1614 20.49
5 471 5.98
6 3 0.04
TOTAL 7878 100
35
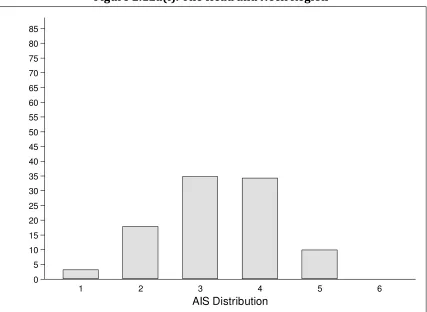
Figure 2.12a. Abbreviated Injury Score (AIS) Distribution According to Body Region for Major Trauma Cases
Figure 2.12a(i). The Head and Neck Region
0 5 10 15 20 25 30 35 40 45 50 55 60 65 70 75 80 85
1 2 3 4 5 6
36
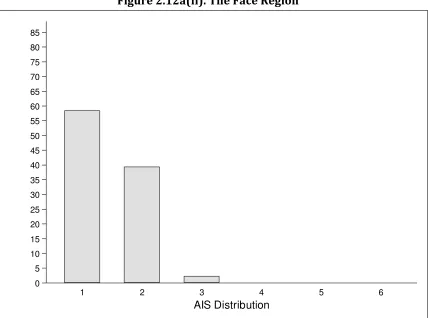
Figure 2.12a(ii). The Face Region
0 5 10 15 20 25 30 35 40 45 50 55 60 65 70 75 80 85
1 2 3 4 5 6
37
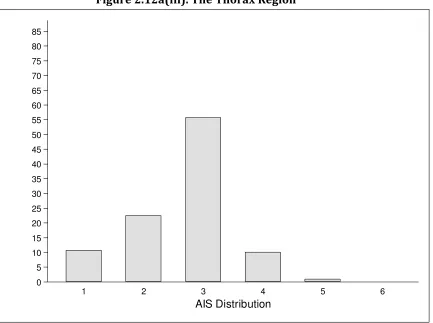
Figure 2.12a(iii). The Thorax Region
0 5 10 15 20 25 30 35 40 45 50 55 60 65 70 75 80 85
1 2 3 4 5 6
38
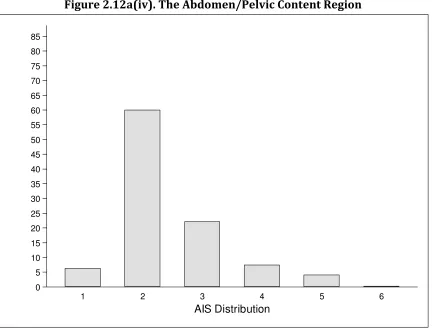
Figure 2.12a(iv). The Abdomen/Pelvic Content Region
0 5 10 15 20 25 30 35 40 45 50 55 60 65 70 75 80 85
1 2 3 4 5 6
39
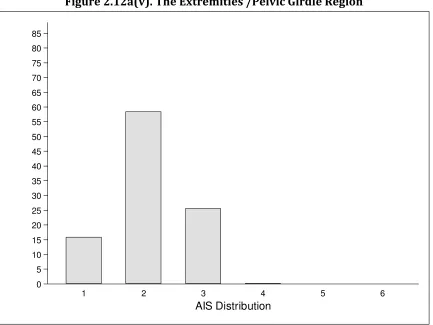
Figure 2.12a(v). The Extremities /Pelvic Girdle Region
0 5 10 15 20 25 30 35 40 45 50 55 60 65 70 75 80 85
1 2 3 4 5 6
40
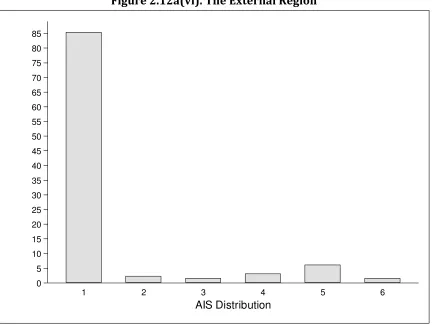
Figure 2.12a(vi). The External Region
0 5 10 15 20 25 30 35 40 45 50 55 60 65 70 75 80 85
1 2 3 4 5 6
41
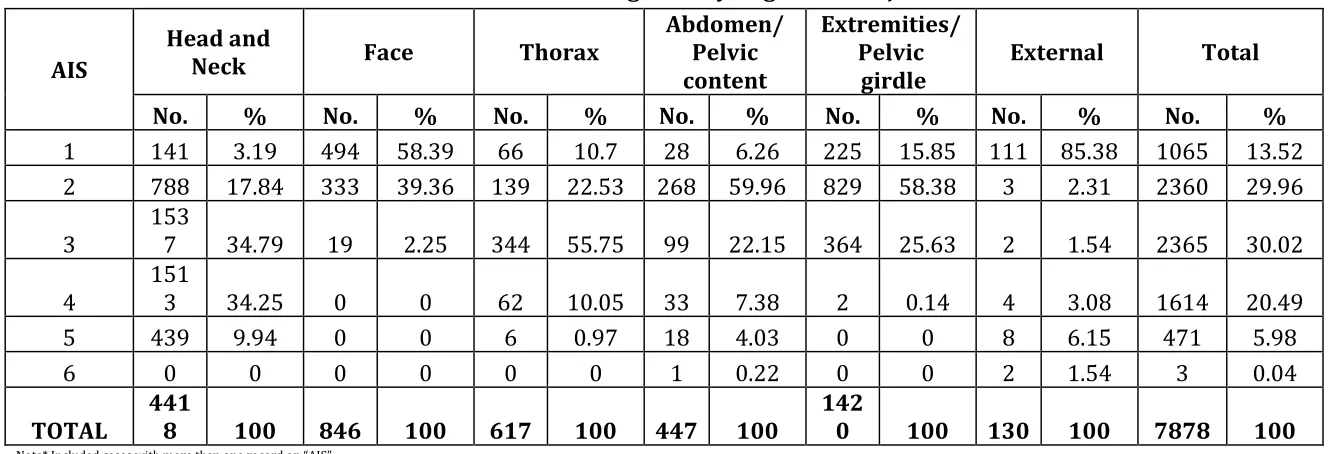
Table 2.12a. Distribution According to Body Region for Major Trauma Cases
AIS
Head and
Neck Face Thorax
Abdomen/ Pelvic content
Extremities/ Pelvic girdle
External Total
No. % No. % No. % No. % No. % No. % No. %
1 141 3.19 494 58.39 66 10.7 28 6.26 225 15.85 111 85.38 1065 13.52
2 788 17.84 333 39.36 139 22.53 268 59.96 829 58.38 3 2.31 2360 29.96
3
153
7 34.79 19 2.25 344 55.75 99 22.15 364 25.63 2 1.54 2365 30.02
4
151
3 34.25 0 0 62 10.05 33 7.38 2 0.14 4 3.08 1614 20.49
5 439 9.94 0 0 6 0.97 18 4.03 0 0 8 6.15 471 5.98
6 0 0 0 0 0 0 1 0.22 0 0 2 1.54 3 0.04
TOTAL
441
8 100 846 100 617 100 447 100
142
42
Major Trauma Cases
Body Region No. %
Head & Neck 3489 78.35
Face 19 0.43
Thorax 412 9.25
Abdomen/Pelvic content 151 3.39
Extremitis/Pelvic girdle 366 8.22
External 16 0.36
43
Figure 2.14. Injury Severity Score (ISS) for Major Trauma Cases
0 5 10 15 20 25 30 35 40 45 50 55 60 65 70
<10 10-15 16-25 26-40 >40
Injury Severity Sore (ISS)
Table 2.14. Injury Severity Score (ISS) for Major Trauma Cases
ISS No. %
<10 245 12.06
10-15 129 6.35
16-25 1315 64.75
25-40 309 15.21
>40 33 1.62
TOTAL 2031 100
44
Chapter 3: PROCEDURES AND OPERATIVE MANAGEMENT
Figure 3.1. Procedure Done in Emergency Department for Major Trauma Cases
0
Procedure Done in ED
Table 3.1. Procedure Done in Emergency Department for Major Trauma Cases
Procedure Done in ED No. %
Endotracheal Intubation 1336 64.8
Intubated at Referral Hospital 596 44.61
Intubated at Current Hospital 740 55.39
Not Available 0 0
Needles Thoracocentesis 14 0.7
Pelvic Clamp/Binding/ext. Fixator 8 0.4
CT Scan 1463 71
Mechanical Ventilation 1348 65.4
Chest Tube Insertion 147 7.1
45
Figure 3.2. Operative Management for Major Trauma Cases
0 5 10 15 20 25 30 35 40 45 50 55
Yes No
Operative Management
Table 3.2. Operative Management for Major Trauma Cases
Operative Management Total
No. %
Yes 1058 51.33
No 1003 48.67
46
Figure 3.3. Operative Procedure for Major Trauma Cases
0
Table 3.3. Operative Procedure for Major Trauma Cases
Operative Procedure No. %
Intracranial 673 63.61
Intrathoracic 9 0.85
Intra-abdominal 179 16.92
Spinal Surgery 8 0.76
Pelvic Fixation 17 1.61
Others 256 24.2
47
Chapter 4: Outcome
Figure 4.1. Total Outcome for Major Trauma Cases
0 10 20 30 40 50 60 70 80
Survivors Death
Outcome
Table 4.1. Total Outcome for Major Trauma Cases
Outcome No. %
Survivors 1484 72.07
Deaths 575 27.93
TOTAL 2059 100
48
Figure 4.1a. Outcome for Major Trauma Cases by Centre
0 10 20 30 40 50 60 70 80 90
A B C D E F G H
Centre
Survivors Death
Table 4.1a. Outcome for Major Trauma Cases by Centre
Centre Survivors Deaths Total
No. % No. %
A 32 66.67 16 33.33 48
B 400 83.51 79 16.49 479
C 146 64.32 81 35.68 227
D 88 64.23 49 35.77 137
E 451 70.8 186 29.2 637
F 135 72.97 50 27.03 185
G 218 67.49 105 32.51 323
H 14 60.87 9 39.13 23
Total 1484 72.07 575 27.93 2059
49
Figure 4.2. Disposition of Survivors at Discharge for Major Trauma Cases
Table 4.2. Disposition of Survivors at Discharge for Major Trauma Cases
Disposition Survivors
No. %
Discharged to Home 975 65.92
Transferred to Referring Hosp. 278 18.8
Transferred to Other Hosp. 166 11.22
Discharged Against Medical Advice 59 3.99
Not Available 1 0.07
TOTAL 1479 100
50
Figure 4.3.Outcome for Major Trauma Cases by Age Group
0 20 40 60 80 100
0-4 5-14 15-24 25-34 35-44 45-54 55-64 65-74 75-84 >=85
Center
Survivors Death
Table 4.3. Outcome for Major Trauma Cases by Age Group
Age Group (years)
Survivors Deaths Total
No. % No. % No. %
0-4 29 93.55 2 6.45 31 1.51
5-14 124 86.71 19 13.29 143 6.95
15-24 537 76.39 166 23.61 703 34.14
25-34 349 75.38 114 24.62 463 22.49
35-44 192 70.85 79 29.15 271 13.16
45-54 112 64.74 61 35.26 173 8.4
55-64 80 55.17 65 44.83 145 7.04
65-74 46 52.87 41 47.13 87 4.23
75-84 13 38.24 21 61.76 34 1.65
2 22.22 7 77.78 9 0.44
51
Figure 4.4. Mechanism of Injury by Outcome for Major Trauma Cases
0 10 20 30 40 50 60 70 80 90
Blunt Penetrating Burns
Mechanism of Injury
Survivors Death
Table 4.4. Outcome for Major Trauma Cases by Mechanism of Injury
Mechanism of Injury
Survivors Deaths Total
No. % No. % No. %
Blunt 1427 71.89 556 28.01 1985 96.31
Penetrating 47 81.03 11 18.97 58 2.81
Burns 12 57.14 9 42.86 21 1.02
52
Figure 4.5. Injury Cause for Major Trauma Cases by Outcome
0
Cause of Death
Survivors Death
Table 4.5. Cause of Injury for Major Trauma Cases by Outcome
Cause of Injury Survivors Deaths Total
No. % No. % No. %
Road Traffic Accident 1132 71.6 449 28.4 1581 76.78
Industrial Accident 22 84.62 4 15.38 26 1.26
Fall from over 2 metres 108 73.47 39 26.53 147 7.14 Fall under 2 metres (about a
53
Figure 4.6. Outcome by Type of Road Traffic Accident for Major Trauma Cases
0
Type of Road Traffic Accident
Survivors Death
Table 4.6. Outcome by Type of Road Traffic Accident for Major Trauma Cases
54
Figure 4.7. Place of Injury for Major Trauma Cases by Outcome
Table 4.7. Place of Injury for Major Trauma Cases by Outcome
Place of Injury Survivors Deaths Total
No. % No. % No. %
Road/ Street/ Highway 1205 71.85 472 28.15 1677 81.45
Home 93 66.43 47 33.57 140 6.8
Industrial / Construction
Area 80 78.43 22 21.57 102 4.95
School / Kindergarten /
Nursery 4 66.67 2 33.33 6 0.29
Sports/Recreational Area 13 100 0 0 13 0.63
Trade / Service Area 14 63.64 8 36.36 22 1.07
Residential Institution 8 80 2 20 10 0.49
Other Specified Place 23 76.67 7 23.33 30 1.46
Unspecified Place 19 79.17 5 20.83 24 1.17
Not Available 25 71.43 10 28.57 35 1.7
55
Figure 4.8. Type of Admission for Major Trauma Cases by Outcome
0 10 20 30 40 50 60 70 80
Direct Transfer/ Referred from
Type of Admission
Survivors Death
Table 4.8. Type of Admission for Major Trauma Cases by Outcome
Type of Admission Survivors Death Total
No. % No. % No. %
Direct 676 68.15 316 31.85 992 48.2
Transferred / Referral 808 75.73 259 24.27 1067 51.8
56
Figure 4.9. Systolic BP for Major Trauma Cases by Outcome
0 10 20 30 40 50 60 70 80 90
1-49 50-75 76-89 90-120 >120
Systolic BP
Survivors Death
Table 4.9. Systolic BP for Major Trauma Cases by Outcome
Systolic BP
Survivors Deaths Total
No. % No. % No. %
1-49 1 10 9 90 10 0.49
50-75 15 35.71 27 64.29 42 2.04
76-89 35 47.3 39 52.7 74 3.59
90-120 493 74.36 170 25.64 663 32.2
>120 940 74.02 330 25.98 1270 61.68
57
Figure 4.10. Glasgow Coma Score (GCS) for Major Trauma Cases by Outcome
0 10 20 30 40 50 60 70 80 90 100
13-15 9-12 3-8
GCS
Survivors Death
Table 4.10. Glasgow Coma Score (GCS) for Major Trauma Cases by Outcome
Glasgow Coma Score (GCS)
Survivors Deaths Total
No. % No. % No. %
13-15 550 88 75 12 625 30.35
9-12 342 83.41 68 16.59 410 19.91
3-8 592 57.81 432 42.19 1024 49.73
58
Figure 4.11. Revised Trauma Score (RTS) for Major Trauma Cases by Outcome
0 10 20 30 40 50 60 70 80 90 100
1-1.99 2-2.99 3-3.99 4-4.99 5-5.99 6-6.99 7-7.84
RTS
Survivors Death
Table 4.11. Revised Trauma Score (RTS) for Major Trauma Cases by Outcome
RTS Survivors Deaths Total
No. % No. % No. %
1-1.99 0 0 7 100 7 0.34
2-2.99 2 12.5 14 87.5 16 0.78
3-3.99 8 18.6 35 81.4 43 2.09
4-4.99 176 51.76 164 48.24 340 16.51
5-5.99 409 65.54 215 34.46 624 30.31
6-6.99 345 82.93 71 17.07 416 20.2
7-7.84 544 88.74 69 11.26 613 29.77
59
Figure . . Outcome with A)S ≥ for Major Trauma Cases
0 10 20 30 40 50 60 70 80
Survivors Death
Outcome
Table . . Outcome with A)S ≥ for Major Trauma Cases
Outcome No. %
Survivors 1401 74.01
Death 492 25.99
60
Figure 4.13. ISS for Major Trauma Cases by Outcome
0 10 20 30 40 50 60 70 80
<10 10-15 16-25 25-40 >40
ISS
Survivors Death
Table 4.13. ISS for Major Trauma Cases by Outcome
ISS Survivors Deaths Total
No. % No. % No. %
<10 138 56.33 107 43.67 245 12.07
10-15 81 62.79 48 37.21 129 6.36
16-25 1010 76.86 304 23.14 1314 64.76
25-40 221 71.75 87 28.25 308 15.18
>40 19 57.58 14 42.42 33 1.63
TOTAL 1469 72.4 560 27.6 2029 100
61
Figure 4.14. ICU Admissions for Major Trauma Cases by Outcome
0 10 20 30 40 50 60 70 80
Yes No
ICU Admission
Survivors Death
Table 4.14. ICU Admissions for Major Trauma Cases by Outcome ICU
Admissions
Survivors Deaths Total
No. % No. % No. %
Yes 852 72.88 317 27.12 1169 56.78
No 632 71.01 258 28.99 890 43.22
62
Figure 4.15. TRISS for Major Trauma Cases
0 10 20 30 40 50 60 70 80 90
<0.25 0.25-<0.5 0.5-<0.75 >=0.75
TRISS Group
Table 4.15. TRISS Distribution for Major Trauma Cases
TRISS (Ps) Total
No. %
<0.25 17 0.84
. Ps< . 79 3.92
. Ps< . 188 9.34
Ps . 1729 85.89
TOTAL 2013 100
63
Figure 4.16. Observed and Expected Outcome for Major Trauma Cases
0 10 20 30 40 50 60 70 80
Ps>=0.5 Ps<0.5
TRISS
Survivors Death
Table 4.16. Observed and Expected Outcome for Major Trauma Cases
TRISS Survivors Deaths Total
No. % No. % No. %
Ps . 1438 75.05 478 24.95 1916 95.28
Ps<0.5 29 30.53 66 69.47 95 4.72
TOTAL 1467 72.95 544 27.05 2011 100
64
Chapter 5: Length of Stay
Figure 5.1. Total Length of Hospital Stay for Major Trauma Cases by Centre
0
65
Figure 5.1a. Average Length of Hospital Stay for Major Trauma Cases by Centre
0
Table 5.1a. Total and Average Length of Hospital Stay for Major Trauma Cases by Outcome and Centre
Centre
Survivors Death
66
Figure 5.2. Total Length of ICU Stay for Major Trauma Cases by Centre
0
67
Figure 5.2a. Average Length of ICU Stay for Major Trauma Cases by Centre
0
Table 5.2a. Total and Average Length of ICU Stay for Major Trauma Cases by Outcome and Centre
Centre
Survivors Deaths
68
Figure 5.3. Average Length of Hospital Stay for Major Trauma Cases by Admission Type
0 1 2 3 4 5 6 7 8 9 10 11
Direct Transfer/Referred
Type of Admission
Table 5.3. Total and Average Length of Hospital Stay for Major Trauma Cases by Admission Type
Admission Type No. LOS
Total Average
Direct 990 11346 11
Transferred/Referral 1068 11252 11
69
Figure 5.4. Total Length of Hospital Stay in Days for Major Trauma Cases by Cause of Injury
0
70
Figure 5.4a. Average Length of Hospital Stay in Days for Major Trauma Cases by Cause of Injury
0
Cause of Injury
Table 5.4. Total and Average Length of Hospital Stay in Days for Major Trauma Cases by Cause of Injury
Cause of Injury No. Total
LOS
Average LOS
Road Traffic Accident 1581 17961 11
A. Reporting Centre Name: 11. Mechanism of Injury :
13. Cause of Injury :
Unintentional Domestic violence
Intentional self harm
Child neglect / Maltreatment Intent cannot be determined Intentional assault
14. Place of Injury : 3. Patient RN :
(dd/mm/yy) (dd/mm/yy)
Penetrating (e.g. Stab, Gunshot wound) Burns Blunt (e.g. MVA)
B. Date of Notification: (dd/mm/yy)
Specify nationality:
National Trauma Database (NTrD) Notification Form 2009
10. Date of Injury : (dd/mm/yy)
AM / PM :
SECTION 1 : PATIENT'S PARTICULARS
SECTION 2 : ADMISSION
SECTION 3 : INJURY
15. Pulse rate : 16. Respiratory rate :
17. Blood pressure :
18. Temperature : 19. Pulse Oximetry :
(Beats / Min) (Breath / Min)
(C) (%)
a. Systolic : (mmHg) b. Diastolic : (mmHg)
SECTION 4 : CLINICAL DETAILS (EMERGENCY DEPARTMENT)
23. Disposition from ED to : 22. Reviewed by :
Emergency Physician
Surgeon Medical Officer / Trainee Specialist / Consultant
(Check one or more boxes) Medical Officer / Trainee Specialist / Consultant
Office use:
2. Identification Card
Number : MyKad / MyKid: Old IC:
Other document No: (eg Birth Cert, Mother's IC)
Specify type (eg.passport, armed force ID):
-ED: Neurosurgery Dept (if different from ED): Admission:
21. Procedures done in ED :
(Check one or more boxes)
Endotracheal intubation
Needle thoracocentesis Pelvic clamp/binding/ext. fixator
CT scan Brain Cervical spine Pelvis
Mechanical ventilation Chest tube insertion
Ultrasound/FAST
Abdomen Thorax Others, specify:
Intubated at referral hospital Intubated at current hospital *
Other M'sian, specify :
Direct
Transfer / Referred
Road Traffic
Accident Motorcycle Rider
Motorcycle Pillion
Driver
Front Seat Passenger
Back Seat Passenger Bicyclist
Pedestrian Not Available Industrial Accident
Fall over 2 metre
Fall under 2 metre (about 1 door's height)
Sports Injury
Road, Street, Highway Home
Industrial / Construction Area
School / Kindergarten / nursery Sports / Recreational Area Trade / Service area
Residential institution Other specified place Not Available
ICU OT General Ward Mortuary Other Hospital AOR HDW
20. Glasgow Coma Scale :
1 2 3 4 5 6
a. Best Eyes opening : b. Best Verbal Response : c. Best Motor Response :
d. Total GCS : (Auto Calc)
e. Head Injury Category: (Auto Calc) Mild (13-15) Moderate (9-12) Severe (3-8)
1 2 3 4 5
1 2 3 4
(Please score as Verbal 1 if patient is intubated)
*
Hospital with Specialist Health clinics Private Clinic
Hospital without Specialist Private Hospital Not Available Hospital
Type:
A. Reporting Centre Name: B. Date of Notification (dd/mm/yy)
28. Operative Procedure :
30. Length of Stay in
(Check one or more boxes) Intracranial
Intrathoracic
SECTION 5 : DIAGNOSIS AND OPERATIVE PROCEDURE
SECTION 6 : IN-HOSPITAL OUTCOME 24. Operative Management:
(dd/mm/yy)
29. Discharge Date :
Pelvic fixation
(Auto calc. From date of admission to date of discharge)
31. Admission to ICU
Yes
No
Number of days:
day(s)
32. Patient's Outcome at Discharge:
Disposition
Discharge Home
Transfer to Referring Hospital
Transfer to Other Hospital
Discharge Against Medical Advice Name of Hospital:
Alive
Death
Yes (if Yes, please fill up below)
No (If No, please proceed to Section 6 directly)
Name of Hospital: *
*
*
*
*
(Excluding operation for ICP monitoring only)
Name :
33. Injuries and Injury Severity Score
BODY REGION INJURY DESCRIPTION
35. Revised Trauma Score : Head & Neck
Face
Thorax
Abdomen / Pelvic content
Extremitis / Pelvic girdle
Patient who died from their injuries after admission Patients with injury severity score (ISS) of >15
Patients admitted to ICU or high dependency area for >24 hours and mechanically ventilated
Urgent surgery (within 24hours) for intracranial, intrathoracic, intraabdominal or fixation for pelvic or spinal injuries.
SECTION 7 : INJURY SEVERITY SCORE
34. Total ISS : (Auto Calc)
AIS AIS
AIS CODE Best AIS 2
INJURY NO.
A. Reporting Centre Name MyKad / MyKid:
Other document No: Specify type (eg.passport,
armed force ID):
-
-E. Patient RN :
B. Date of Follow Up: (dd/mm/yy)
2 - Persistent Vegetative 1 - Dead
3 - Severe Disability
4 - Moderate Disability
5 - Well
d. Lost to Follow Up
ED: Neurosurgery Dept (if different from ED):
PATIENT OUTCOME
1. Follow Up at:
3 months
6 months 1 year
National Trauma Database (NTrD) Follow Up Form
Office use:Centre: /
Complete this form at 3rd month, 6th month, 12th month and annually after the trauma event. Check ( ) one box unless specified otherwise.
3. Glasgow Outcome Score 2. Outcome
c. Transferred to another centre
ii) Name of centre transferred to:
i) Date of last follow up: