Summary In some conifers, shoot geometry and needle mor-phology vary significantly in response to the light conditions under which they develop. We measured shoot length, silhou-ette area, total projected needle area, total needle weight and needle thickness on current shoots developed under a wide range of light conditions in a 36-year-old Abies amabilis (Dougl.) Forbes stand. Current light was quantified by evalu-ating percent openness from hemispherical photographs taken before the growing season. Unweighted total openness was correlated with shoot geometry and needle morphology better than any weighted indices tested. Needle thickness and leaf mass/area were both closely correlated with total openness (R2 = 0.86 and 0.82, respectively). The most exposed needles were 2.5 times thicker and had 3--4 times more leaf mass/area than the most shaded needles. Total projected leaf area/shoot silhou-ette area was also correlated with openness (R2 = 0.74) and was about twice as high in sun shoots as in shaded shoots. As a result of greater leaf mass/leaf area and greater leaf area/shoot sil-houette area, a unit of intercepted light was dispersed over about 6 times as much leaf mass in a sun shoot as in a shade shoot, which presumably permits more efficient utilization of the intercepted light under high illumination with less energy wastage to light saturation. Moreover, leaf mass per unit of silhouette area was almost exactly proportional to canopy openness, as predicted by resource optimization theory if ni-trogen concentration and photosynthetic capacity per unit mass are constant in new leaves. The close correlation of needle thickness and leaf mass/area with openness suggests that either parameter could be used as an index of the distribution of light or light-driven processes in an A. amabilis canopy.
Keywords: leaf mass/area, leaf thickness, light acclimation, optimization, silhouette area.
Introduction
Developing leaves acclimate to local light conditions in many ways (Boardman 1977, Björkman 1981, Lichtenthaler 1985, Givnish 1988, Stenberg et al. 1995). Biochemical adaptations include changes in chlorophyll concentration, chlorophyll/ni-trogen ratio, chlorophyll a/b ratio and core/antennae ratio. These adaptations regulate the internal chemistry of the leaf
and affect the balance between the light harvesting and CO2 -fixation components of photosynthesis. Most of the biochemi-cal adaptations are reversible, so that leaves that form in the sun and then become shaded become biochemically similar to leaves formed in the shade (Brooks et al. 1994).
At the leaf level, common morphological adaptations to light include changes in leaf size and stomatal density such that sun leaves are thicker and have a greater mass per area than shade leaves. The main consequence of this change in leaf dimension seems to be to disperse incoming light over more leaf tissue. In general, morphological adaptations are perma-nent once leaf development is complete, i.e., once a sun or shade leaf is constructed, its physical characteristics are un-likely to change much regardless of changes in the local light environment.
Another type of sun--shade adaptation involves changes in shoot geometry, i.e., how leaves are displayed in space or grouped around stems. In some conifer species, needles tend to be arranged more or less cylindrically around shoots pro-duced in the sun, whereas shoots propro-duced in the shade tend to be flat and horizontal, with leaves displayed mainly at the sides of the shoots (Groom 1909; cf. Carter and Smith 1985, Tucker et al. 1987, Leverenz and Hinckley 1990, Stenberg 1996). A similar pattern is seen in some broad-leaved species, where leaves higher in the canopy tend to be displayed more or less vertically whereas leaves lower in the canopy are displayed horizontally (Miller 1967, McMillen and McClendon 1979, Hollinger 1989). Both of these adaptations have the same consequence: in sun shoots or at the top of the canopy, incom-ing radiation tends to be spread out over a large number of leaves displayed at a variety of angles, whereas in shade shoots or at the bottom of the canopy, radiation tends to be concen-trated on a single layer of horizontally displayed leaves. In high-light environments, light dispersed over more leaves is used more efficiently in photosynthesis and less is lost to saturation (Leverenz and Jarvis 1979, Carter and Smith 1985, Oker-Blom 1985, Oker-Blom et al. 1991), whereas in low-light environments, light concentrated on a few leaves is efficiently intercepted at a minimal cost in leaf construction and mainte-nance (Leverenz and Hinckley 1990). Leaf display and leaf morphology both effectively increase photosynthesis at high irradiances: thicker leaves usually have markedly higher
maxi-Effects of light on shoot geometry and needle morphology in
Abies
amabilis
D. G. SPRUGEL,
1J. R. BROOKS
1,2and T. M. HINCKLEY
11 College of Forest Resources, University of Washington, Seattle, WA 98195, USA
2 Present address: Department of Biology, University of Utah, Salt Lake City, UT 84112, USA
Received March 28, 1995
mum photosynthetic rates than thinner leaves of the same species, even though both leaf types intercept almost the same amount of light (Björkman 1981) and sun shoots have higher photosynthetic rates per unit of absorbed light (i.e., per silhou-ette area) than shade shoots (Carter and Smith 1985).
Despite the many studies of leaf- or shoot-level responses to light, few studies have examined both simultaneously to see how they combine and interact to control light dispersion. Moreover, although many studies have compared properties of extreme sun and shade leaves, there is little quantitative infor-mation on variation along the entire sun--shade gradient that occurs within a canopy. The lack of such quantitative informa-tion has become evident as a result of the recent observainforma-tion by Oren et al. (1986) and others that leaf thickness may be a useful proxy for quantifying the distribution of light or light-driven processes within a forest canopy. Although it is difficult to quantify light distribution within a canopy directly (because irradiance varies spatially and temporally), it may be much easier to collect and characterize a spatially dispersed sample of recently produced foliage, which may in turn provide an index of the integrated light conditions under which it was produced. This in turn may provide an index of light-driven processes such as photosynthesis. Despite the appeal of such an approach, it has only been employed by Ellsworth and Reich (1993), who used leaf mass/area to quantify light and photosynthesis distribution in a sugar maple forest.
An additional perspective on shoot geometry and needle morphology is provided by theoretical and empirical work that makes quantitative predictions of how structure and function of plant canopies should be organized to optimize the capture and utilization of light (e.g., Mooney and Gulmon 1979, 1982, Field 1983, Farquhar 1989, Field 1991). The consensus of these studies is that resource use is optimized when the distri-bution of photosynthetic capacity (Amax ) and nitrogen within the canopy is directly proportional to the distribution of ab-sorbed irradiance (Farquhar 1989); if one leaf is in a position to intercept five times more light than another, it should have five times greater Amax and N/leaf area. Empirical studies have shown that the actual variation in Amax and N/leaf area gener-ally follows the expected pattern but is less extreme than would be required for optimal resource utilization (Field 1991).
Optimization theory provides no indication about which aspect of foliage structure or function can be expected to change from the top to the bottom of the canopy to match the distribution of photosynthetic capacity and nitrogen to inter-cepted light (Pearcy and Sims 1994), but there are two obvious candidates: leaf mass per unit of intercepted light, and foliar nitrogen concentration and photosynthetic capacity per unit leaf mass. Empirical studies have shown that both may vary within canopies in relation to irradiance (e.g., Charles-Ed-wards et al. 1987, Hirose and Werger 1987, Evans 1993), but several recent studies have found that, in broad-leaved decidu-ous forests, most of the variation in nitrogen concentration and photosynthetic capacity per unit of intercepted light is due to variations in leaf mass/area, whereas nitrogen concentration and photosynthetic capacity per unit mass remain relatively constant (Hollinger 1989, Ellsworth and Reich 1993, Kull and
Niinemets 1993). However, as noted above, if resource use were to be completely optimized by this mechanism, leaf mass/area would be strictly proportional to intercepted light, which is rarely observed. There have been no studies of re-source use optimization in evergreen conifers, in which shoot geometry might be expected to interact with needle morphol-ogy to control light interception per unit of leaf mass.
We have quantified the variation in shoot geometry and needle morphology of Abies amabilis (Dougl.) Forbes over a wide range of natural light conditions. The results are inter-preted in terms of how trees respond to light, and their signifi-cance is discussed with respect to the distribution of light and light-driven processes within an A. amabilis canopy.
Materials and methods
Species and site
Abies amabilis (Pacific silver fir) is a common species in the upper montane forests of the Pacific Northwest. It is generally characterized as shade tolerant because seedlings can establish and grow under heavy shade, but it also grows well in full sunlight after release (Franklin and Dyrness 1973).
The trees were about 35 years old (dated from release) and were in an almost pure A. amabilis stand about 65 km southeast of Seattle, Washington (47°20′ N, 121°35′ W). The stand regenerated naturally after a 1955 clear-cut. Disturbance dur-ing the loggdur-ing operation eliminated seedldur-ings in many areas, so the trees are unevenly distributed, with dense clumps (up to 30 stems m−2) covering 5--30 m2 interspersed with treeless areas of up to 50 m2. Tree height ranged from 2 to 7 m.
Methods
In spring 1991, we selected 10 first-order branch tips on each of five 3--4 m tall A. amabilis saplings at the edges of clumps, attempting in each case to cover the full range of light exposure on each tree. In addition, two first-order branch tips on each of five suppressed saplings were selected to provide extra cover-age of the deep-shade end of the gradient. Before bud break, we took a hemispherical photograph at each location, with a Nikon 8 mm lens and Kodachrome 200 film. The photographs were analyzed with the CANOPY hemispherical photo analy-sis program (Rich 1989) for the following determinations. (1) Total canopy openness (indirect site factor sensu Anderson (1964) and Rich (1989))----this index gives equal weight to all directions and simulates irradiance under a uniform overcast sky (UOC; Monteith 1973). (2) Openness weighted by the standard overcast sky (SOC; Monteith 1973)----this index weights each pixel by (1 + 2sin(90 −θ))/3, where θ is the zenith angle. Under overcast conditions, the sky is generally brighter near the zenith than near the horizon, and this index gives greater weight to angles near the zenith. (3) Cosine-corrected openness (weighted by cosθ)----this estimates irradiation on a horizontal surface under a uniform overcast sky. (4) A combi-nation of (2) and (3)----this estimates irradiation on a horizontal surface from a SOC.
new shoots did not develop) and measured for shoot length and shoot silhouette area (SSA) by means of the OPTIMAS image analysis program. All the needles were removed from each shoot and measured to obtain total projected needle area (TPA), and then dried for 24--48 h at 70 °C and measured to obtain total needle weight. We also measured the thickness of three needles from near the middle of each shoot with a precision digital micrometer.
Characterization of shoot morphology
Shoot morphology in conifers can be characterized by the silhouette area ratio (SAR), which is defined as the maximum silhouette area of a shoot divided by the total projected area of all the needles (SSA/TPA) (Tucker et al. 1987; cf. Norman and Jarvis 1974, Leverenz 1980). The silhouette area to total area ratio (STAR) is similar to SAR except that the shoot silhouette area is divided by the total surface area (all sides) of all the needles (Carter and Smith 1985, Oker-Blom and Smolander 1988). The original definition of STAR by Carter and Smith (1985) indicated that the silhouette area of a shoot, and thus the value of STAR, would vary depending on the view angle, but their measurements appear to have been taken with the shoot perpendicular to the light (giving the maximum value for silhouette area and STAR). Oker-Blom and Smolander (1988) called this value STARmax and defined STAR
_____
as the mean STAR averaged over all possible view angles (see also Sten-berg 1996).
The SAR can be converted to STARmax by dividing by the total area/projected area ratio of an average needle, which typically ranges from about 2.0 to 3.14 (π). However, because this ratio may vary from needle to needle in species that have variable leaf morphology, any linear conversion from SAR to STAR (or vice versa) is only an approximation.
We characterized shoot morphology by the inverse of SAR, i.e., the ratio of total projected needle area to maximum shoot silhouette area (TPA/SSA). The TPA measures the maximum (one-sided) surface that might be illuminated by direct-beam radiation, whereas SSA is a measure of maximum light inter-ception by the shoot in direct-beam radiation. Hence TPA/SSA is an index of the amount of needle surface area over which a unit of light intercepted by the shoot could be dis-persed. The TPA/SSA ratio is thus somewhat analogous to leaf mass/area, which can be thought of as the volume over which a unit of light intercepted by the needle is dispersed. (The actual illuminated surface will be less than TPA if there is significant mutual shading by needles within the shoot, but Carter and Smith (1985) found mutual shading to be a rela-tively minor factor in the difference in STAR between sun and shade shoots of Pinus, Picea and Abies.)
Statistical analyses
Needle and shoot characteristics were regressed against simple power transformations (x, sqr(x), x1.5, x2) of each of the four openness indices. Goodness of fit was judged based on the R2 of the fitted line. Nonlinear curve fitting was used to see if intermediate powers of x would give significantly better fits, but they did not do so in any case.
Because some of the relationships appeared to exhibit a threshold at about openness = 0.3, we also calculated parame-ters for a threshold model in which y was constant for openness < 0.3 and increased linearly thereafter. This model was com-pared with the best power function using a partial F-test (Neter et al. 1990) to determine whether the reduction in residual sums of squares (if any) was large enough to justify using a model with a larger number of parameters. (The threshold model contains three fitted parameters (slope and intercept of the line above the threshold plus the mean of the values below the threshold), whereas the power models involve only two (intercept and coefficient).)
To partition variation between among-tree and between-tree components, we used analysis of covariance to test for signifi-cant differences among trees in slope and/or intercept of the various relationships between shoot and needle characteristics and openness (Neter et al. 1990). Only the five trees that spanned the entire range of openness were used in this analy-sis.
Finally, an examination of the data showed that all ratios involving total projected leaf area of Sample 3 on Tree 5 were unusually far from the regression lines (leaf mass/area, for example, was over five standard deviations away from the regression line based on the other 55 samples; P < 0.001). Moreover, the values for the middle 2.5 cm of this shoot (which were measured separately in all samples for comparison to another study) were strikingly different from those for the rest of the shoot. Both of these observations suggested that an error had probably been made in measuring projected leaf area of this shoot, so these values were not included in any of the calculations reported here.
Results
Openness indices
Total openness (or a transformation of it) was invariably as good or better at predicting shoot and needle characteristics than any of the openness indices that placed more weight on openness near the zenith. For example, for the relationship between leaf mass/area and different openness indices, the R2 values for total openness, SOC-weighted openness, cosine-corrected openness and cosine-cosine-corrected, SOC-weighted openness were 0.86, 0.85, 0.83 and 0.81, respectively. In some cases, the differences were smaller, and in others larger, but in no case was any weighted openness significantly superior to total openness. This result is consistent with that of Chazdon and Field (1987), who found that total canopy openness (meas-ured from the horizontal) was a better predictor of photosyn-thetic capacity in Piper species than more complex indices involving sun tracks, sunfleck duration, etc. Because the other indices were poorer predictors of shoot and needle charac-teristics than total openness, we will discuss only total open-ness.
Needle morphology
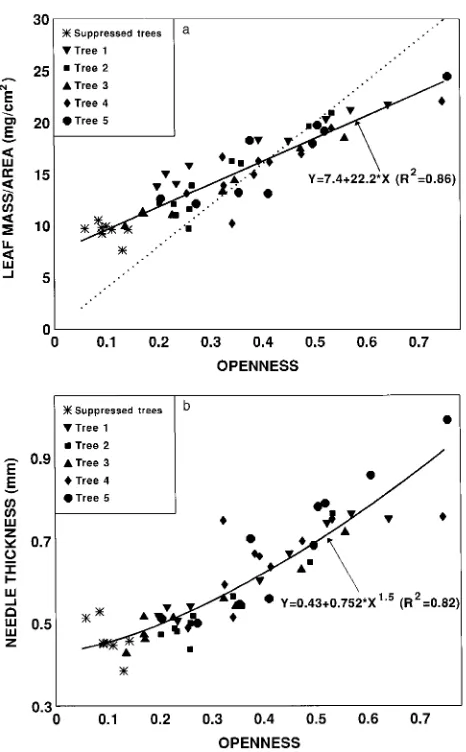
was linearly related to canopy openness (R2 = 0.86), whereas thickness was related to openness1.5 (R2 = 0.82). A simple linear model relating thickness to openness was only slightly weaker than the power function (R2 = 0.81, standard error of estimate (SEE) = 0.057 mm), whereas a threshold model gave a slightly better fit (R2 = 0.83, SEE = 0.054 mm), but the increase was not sufficient to justify including an additional parameter. For both thickness and leaf mass/area, there were significant differences (P < 0.05) between trees, with between-tree variation accounting for 35--40% of the residual error and within-tree variation accounting for 65--70%.
The most exposed needles were about 2.5 times thicker than the most shaded ones (1.0 versus 0.4 mm) and had up to four times as much mass per projected area (30 versus 7.5 mg cm−2). However, the difference between the most sunlit and the most shaded needles was less than it would have been if leaf
mass/area were strictly proportional to canopy openness, be-cause the most exposed samples had openness values over 10 times greater than the most shaded ones (Figure 1a). The finding that leaf mass/area varied more than thickness implies that, when the needles were collected in early September, sunlit needles had a higher density than shaded needles. The increase in density might be the result of enhanced starch accumulation, because a density index (weight/(projected area × thickness)) was positively correlated with openness (r = 0.58).
Shoot morphology
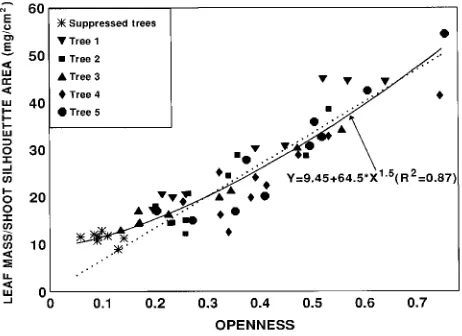
Total projected needle area/shoot silhouette area ratio (TPA/SSA) was most closely related to openness1.5 (R2 = 0.74, SEE = 0.14) (Figure 2); however, a linear model gave only a slightly poorer fit (R2 = 0.73, SEE = 0.15). The ratio TPA/SSA was about twice as great for sun shoots as for shade shoots, but as with leaf mass/area, the difference was less than the differ-ence in openness (Figure 2). Again, there were significant differences between trees in the relationship between openness and TPA/SSA (P < 0.05), with between-tree variation account-ing for about 40% of the residual error and within-tree vari-ation accounting for 60%.
We observed a strong threshold effect in the relationship between openness and SSA per shoot length, with little vari-ation for openness values less than 30% and a strong linear increase with increased openness beyond that point (Figure 3). Maximum values of silhouette area/shoot length were almost four times greater than minimum values.
Shoot and needle morphology
The difference in leaf mass/area between sun needles and shade needles (Figure 1a), combined with a twofold difference in leaf area/silhouette area between sun and shade shoots (Figure 2), resulted in a sixfold difference in leaf mass/silhou-ette area between sun and shade shoots (Figure 4). Unlike
Figure 1. The relationship between canopy openness and (a) leaf mass/projected area and (b) needle thickness. For leaf mass/area, SEE = 1.56 mg cm−2 (root mean square deviation from regression). For thickness, SEE = 0.055 mm. In (a), the dotted line is the relationship that would be expected if leaf mass/area were strictly proportional to openness (y = 39.9x).
either leaf mass/area or leaf area/silhouette area, leaf mass/sil-houette area was almost exactly proportional to openness; a straight line through the origin explained 83% of the variation in the data compared with 87% for the fitted curve (Figure 4).
Discussion
The adaptive significance of sun--shade variation in shoot and needle morphology
Shoot and needle morphology combine multiplicatively to disperse incoming light over the photosynthetic tissue sup-ported by the shoot. Greater leaf area/silhouette area in sun shoots means that intercepted light is spread out over more needle surface than in shade shoots, whereas greater leaf mass/area means that once this light strikes a sun needle, there is more tissue in which photosynthetic reactions can take place. As a result, the dispersal of incoming light over leaf
mass is greater than would be achieved by shoot geometry or needle morphology alone (Figure 4). Moreover, the quantita-tive relationship between openness and leaf mass/silhouette area is close to the pattern predicted by the Farquhar optimiza-tion model if photosynthetic capacity and nitrogen concentra-tion within the canopy are optimized (i.e., made proporconcentra-tional to intercepted light) primarily through variations in leaf mass per unit of light interception, with N and Amax per unit leaf mass remaining constant. (This assumes that maximum silhou-ette area is a good index of intercepted light.)
Morphological responses to high irradiances entail signifi-cant costs. For example, packing large numbers of thick leaves on a single shoot increases the construction costs both for the needles and the sturdier branch needed to carry them, and increases the maintenance costs to support both the needles and the supporting branches over their lifetime (which in A. amabilis often exceeds 10 years). Moreover, these morpho-logical adaptations are not reversible (Brooks et al. 1994). Once a leaf is formed, its structure is essentially fixed until it abscises. Because it would appear to be advantageous for evergreens, in particular, to be able to respond to high irradi-ances solely through biochemical adjustments, the finding that they do not suggests that there may be a fundamental limitation to the flexibility of biochemical responses within a species. In particular, there may be a maximum effective nitrogen concen-tration (per unit mass) for each species, beyond which adding additional nitrogen yields diminishing returns in CO2 fixation, even in high irradiances. Within a species, there may be a limit to how much Rubisco can be packed into a given volume of leaf tissue, or the rate of CO2 diffusion across membranes may limit the rate of CO2 fixation per unit volume of leaf tissue, or energy balance or leaf longevity may present constraints. However, there would be little reason to produce a needle with less than the maximum N concentration, because this would mean spending extra carbon and energy to build a large needle to house a relatively small amount of nitrogen. Once the needle is constructed, though, nitrogen may be removed as the needle becomes shaded (Brooks et al. 1994), because there is no reason to maintain a large photosynthetic capacity in a leaf that is no longer receiving large amounts of light.
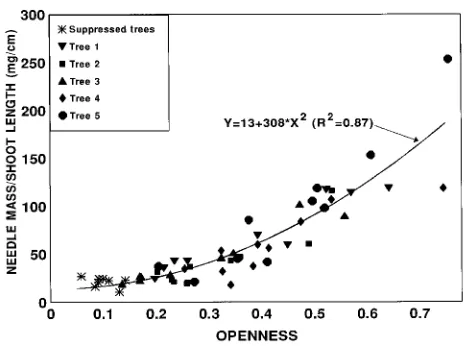
Shade needles in A. amabilis are generally as long as or longer than sun needles, so most of the difference in silhouette area/shoot length between sun and shade needles is due to a closer packing of needles along the shoot in sun shoots and a more complete interception of light impinging on the ‘‘shoot cylinder.’’ The silhouette area/shoot length is closely linked with the increase in total leaf area/silhouette area in sun shoots, because close packing leads to an increased leaf area/silhou-ette area that will almost inevitably lead to a high silhouarea/silhou-ette area/shoot length, and vice versa. Quantitatively, increased leaf area/silhouette area and increased silhouette area/shoot length combine to produce a seven- to eightfold greater in-crease in leaf area/shoot length in sun shoots than in shade shoots, and both combine with the greater leaf mass/area on sun shoots to produce a still greater difference (15- to 25-fold) in leaf mass/shoot length between the most exposed and most shaded shoots (Figure 5).
Figure 3. The relationship between shoot silhouette area/shoot length and canopy openness (SEE = 0.42 cm2 cm−1).
Sun and shade shoots thus represent opposing light harvest-ing strategies. Sun shoots appear adapted to harvestharvest-ing light as completely as possible and spreading it out over the maximum possible volume of leaf tissue. The finding that leaf thickness and leaf display responses are so universal suggests that the importance of minimizing saturation losses consistently out-weighs the cost of producing, supporting and maintaining the extra tissue required. Conversely, shade shoots appear adapted to concentrate incoming light on as small a volume of tissue as possible, as would be expected in an environment where satu-ration is generally irrelevant and the most important considera-tion is maintaining a positive photosynthesis/respiraconsidera-tion balance.
Needle and shoot morphology as an index of light distribution
The close relationship between openness and either thickness or leaf mass/area of current-year needles suggests that either parameter could be used as an index of light distribution within an A. amabilis canopy. Each parameter has some advantages. Leaf mass/area is more widely measured and is perhaps more biologically meaningful, but it also varies through the season (Jurik 1986, Gutschick and Wiegel 1988, Reich et al. 1991, Brooks et al. 1994), whereas thickness tends to be more tem-porally stable (Brooks et al. 1994). Shoot parameters such as SSA/TPA or needle mass/shoot length could also be used to index light distribution, but they are more difficult to measure than needle-level parameters. Moreover, shoot-level parame-ters are likely to change with time (as needles are lost), and the changes may not be obvious.
In evergreen trees, leaf-level and shoot-level morphology reflect the prevailing irradiances at the time of shoot elonga-tion rather than current condielonga-tions. Thus the distribuelonga-tion of thickness among older needles provides a historical record of light distribution in previous years. (Continued growth of sec-ondary phloem in older needles has been reported in a number of conifers (Ewers 1982, Ewers and Aloni 1987), but the annual increase in diameter in needles of Pinus longaeva
Engelm., the most intensively studied species, was only 2 µm year−1 (Ewers 1982). Even if the growth rate in A. amabilis were several times higher, the total increase over the 10--15 year lifetime of an A. amabilis needle would be small com-pared with the 400--600 µm difference in thickness between sun and shade leaves.) We have used this characteristic to examine acclimation of leaves formed in the sun as they become shaded during stand development (Brooks 1993, Brooks et al. 1994), and it could be used to map canopy development or long-term changes in light distribution. Con-versely, because only current-year shoots and needles can be used to map current light distribution, leaf thickness or leaf mass/area can only be used to estimate light distribution in those parts of the canopy where new foliage is being produced. However, in an A. amabilis canopy, there are few parts so dark that no current foliage is produced; suppressed trees can pro-duce foliage at irradiances of only 5--10% of those above the canopy (Figures 1--5). Thus either needle thickness or leaf mass/area could provide valuable means for studying current or past light distributions in A. amabilis canopies.
Acknowledgments
We are indebted to Donna Romain for assistance with the shoot analysis, to Andy Gray for assistance with hemispherical photo analy-sis, and to Olevi Kull, Heikki Smolander, Pola Stenberg and Barbara Yoder for informative discussions. This research was supported by grants from the USDA Competitive Grants Program.
References
Anderson, M.C. 1964. Studies of the woodland light climate. I. The photographic computation of light conditions. J. Ecol. 52:27--41. Björkman, O. 1981. Responses to different quantum flux densities. In
Physiological Plant Ecology I. Responses to the Physical Environ-ment. Encyclopedia of Plant Physiology, Vol. 12A. Eds. O.L. Lange, P.S. Nobel, C.B. Osmund and H. Ziegler. Springer-Verlag, Berlin, pp 57--107.
Boardman, N.K. 1977. Comparative photosynthesis of sun and shade plants. Annu. Rev. Plant. Physiol. 28:355--377.
Brooks, J.R. 1993. Light acclimation in Abies amabilis canopies. Ph.D. Diss. Univ. of Washington, Seattle, WA, 115 p.
Brooks, J.R., T.M. Hinckley and D.G. Sprugel. 1994. Acclimation responses of mature Abies amabilis sun foliage to shading. Oecolo-gia 100:316--324.
Carter, G.A. and W.K. Smith. 1985. Influence of shoot structure on light interception and photosynthesis in conifers. Plant Physiol. 79:1038--1043.
Charles-Edwards, D.S., H. Stutzel, R. Ferraris and D.F. Beech. 1987. An analysis of spatial variation in the nitrogen content of leaves from different horizons within a canopy. Ann. Bot. 60:421--426. Chazdon, R.L. and C.B. Field. 1987. Determinants of photosynthetic
capacity in six rainforest Piper species. Oecologia 73:222--230. Ellsworth, D.S. and P.B. Reich. 1993. Canopy structure and vertical
patterns of photosynthesis and related leaf traits in a deciduous forest. Oecologia 96:169--178.
Evans, J.R. 1993. Photosynthetic acclimation and nitrogen partition-ing within a Lucerne canopy. II. Stability through time and compari-son with a theoretical optimum. Aust. J. Plant Physiol. 20:69--82. Ewers, F.W. 1982. Secondary growth in needle leaves of Pinus
lon-gaeva (bristlecone pine) and other conifers: quantitative data. Am. J. Bot. 69:1552--1559.
Ewers, F.W. and R. Aloni. 1987. Seasonal secondary growth in needle leaves of Pinus strobus and Pinus brutia. Am. J. Bot. 74:980--987. Farquhar, G.D. 1989. Models of integrated photosynthesis of cells and
leaves. Phil. Trans. R. Soc. Lond. 323:357--367.
Field, C.B. 1983. Allocating leaf nitrogen for the maximization of carbon gain: leaf age as a control on the allocation program. Oe-cologia 56:341--347.
Field, C.B. 1991. Ecological scaling of carbon gain to stress and resource availability. In Response of Plants to Multiple Stresses. Eds. H.A. Mooney, W.E. Winner and E.J. Pell. Academic Press, New York, pp 35--65.
Franklin, J.F. and C.T. Dyrness. 1973. Natural vegetation of Oregon and Washington. USDA Forest Service, Portland, OR, Gen. Tech. Rep. PNW-8, 417 p.
Givnish, T. 1988. Adaptation to sun and shade: a whole-plant perspec-tive. Aust. J. Plant Physiol. 15:63--92.
Groom, P. 1909. Trees and their life histories. Cassell and Co., Lon-don, 409 p.
Gutschick, V.P. and F.W. Wiegel. 1988. Optimizing the canopy photo-synthetic rate by patterns of investment in specific leaf mass. Am. Nat. 132:67--86.
Hirose, T. and M.J.A. Werger. 1987. Maximizing daily canopy photo-synthesis with respect to the leaf nitrogen allocation pattern in the canopy. Oecologia 72:520--526.
Hollinger, D.Y. 1989. Canopy organization and foliage photosynthetic capacity in a broad-leaved evergreen montane forest. Funct. Ecol. 3:53--62.
Jurik, T.W. 1986. Temporal and spatial patterns of specific leaf weight in successional northern hardwood tree species. Am. J. Bot. 73:1083--1092.
Kull, O. and U. Niinemets. 1993. Variations in leaf morphometry and nitrogen concentration in Betula pendula Roth., Corylus avellana
L., and Lonicera xylosteum L. Tree Physiol. 12:311--318. Leverenz, J. 1980. Shoot structure and productivity in conifers. In
Understanding and Predicting Tree Growth. Ed. S. Linder. Swed. Conif. For. Proj. Tech. Rep. 25, Swed. Univ. of Agric. Sci., Uppsala, Sweden, pp 135--137.
Leverenz, J.W. and T.M. Hinckley. 1990. Shoot structure, leaf area index, and productivity of evergreen conifer stands. Tree Physiol. 6:135--149.
Leverenz, J.W. and P.G. Jarvis. 1979. Photosynthesis in Sitka spruce. VIII. The effects of light flux density and direction on the rate of net photosynthesis and the stomatal conductance of needles. J. Appl. Ecol. 16:919--932.
Lichtenthaler, H.K. 1985. Differences in morphology and chemical composition of leaves grown at different light intensities and quali-ties. In Control of Leaf Growth. Eds. N.R. Baker, W.J. Davies and C.K. Ong. Soc. Exp. Biol. Seminar Ser. 27, Cambridge Univ. Press, London, pp 201--221.
McMillen, G.G. and J.H. McClenden. 1979. Leaf angle: an adaptive feature of sun and shade plants. Bot. Gaz. 140:437--442.
Miller, P.C. 1967. Leaf temperature, leaf orientation, and energy ex-change in quaking aspen (Populus tremuloides) and Gambell’s oak (Quercus gambellii) in central Colorado. Oecol. Plant. 2:241--270.
Monteith, J.L. 1973. Principles of environmental physics. Edward Arnold, London, 241 p.
Mooney, H.A. and S.L. Gulmon. 1979. Environmental and evolution-ary constraints on the photosynthetic characteristics of higher plants. In Topics in Plant Population Biology. Eds. O.T. Solbrig, S. Jain, G.B. Johnson and P. Raven. Cambridge Univ. Press, New York, pp 316--337.
Mooney, H.A. and S.L. Gulmon. 1982. Constraints on leaf structure and function in relation to herbivory. BioScience 32:198--206. Neter, J., M. Wasserman and M.H. Kutner. 1990. Applied linear
statistical models. Irwin Press, Homewood, IL, 1181 p.
Norman, J.M. and P.G. Jarvis. 1974. Photosynthesis in Sitka spruce (Picea sitchensis (Bong.) Carr.). III. Measurements of canopy struc-ture and interception of radiation. J. Appl. Ecol. 11:375--398. Oker-Blom, P. 1985. The influence of penumbra on the distribution of
direct solar radiation in a canopy of Scots pine. Photosynthetica 19:312--317.
Oker-Blom, P. and H. Smolander. 1988. The ratio of shoot silhouette area to total needle area in Scots pine. For. Sci. 34:894--906. Oker-Blom, P., J. Lappi and H. Smolander. 1991. Radiation regime
and photosynthesis of coniferous stands. In Photon-Vegetation In-teractions: Applications in Optical Remote Sensing and Plant Ecol-ogy. Eds. R.B. Myneni and J. Ross. Springer-Verlag, Berlin, Germany, pp 469--499.
Oren, R., E.-D. Schulze, R. Matyssek and R. Zimmermann. 1986. Estimating photosynthetic rate and annual carbon gain in conifers from specific leaf weight and leaf biomass. Oecologia 70:187--193. Pearcy, R.W. and D.A. Sims. 1994. Photosynthetic acclimation to changing light environments: scaling from the leaf to the whole plant. In Exploitation of Environmental Heterogeneity by Plants. Eds. M.M. Caldwell and R.W. Pearcy. Academic Press, New York, pp 145--174.
Reich, P.B., M.B. Walters and D.S. Ellsworth. 1991. Leaf age and season influence the relationships between leaf nitrogen, leaf mass per area and photosynthesis in maple and oak trees. Plant Cell Environ. 14:251--259.
Rich, P.M. 1989. A manual for analysis of hemispherical canopy photography. Los Alamos National Laboratory, LA-11733-M, Los Alamos, New Mexico, 80 p.
Stenberg, P. 1996. Simulations of the effects of shoot structure and orientation on vertical gradients in intercepted light by conifers canopies. Tree Physiol. 16:99--108.
Stenberg, P., E.H. DeLucia, A.W. Schoettle and H. Smolander. 1995. Photosynthetic light capture and processing from cell to canopy. In
Resource Physiology of Conifers: Acquisition, Allocation, and Utilization. Eds. W.K. Smith and T.M. Hinckley. Academic Press, San Diego, pp 3--38.
Appendix
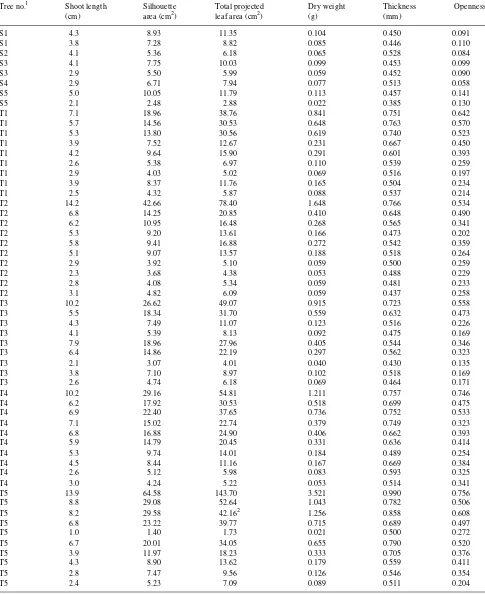
Table 1. Raw data for all shoot measurements.
Tree no.1 Shoot length Silhouette Total projected Dry weight Thickness Openness
(cm) area (cm2) leaf area (cm2) (g) (mm)
S1 4.3 8.93 11.35 0.104 0.450 0.091
S1 3.8 7.28 8.82 0.085 0.446 0.110
S2 4.1 5.36 6.18 0.065 0.528 0.084
S3 4.1 7.75 10.03 0.099 0.453 0.099
S3 2.9 5.50 5.99 0.059 0.452 0.090
S4 2.9 6.71 7.94 0.077 0.513 0.058
S5 5.0 10.05 11.79 0.113 0.457 0.141
S5 2.1 2.48 2.88 0.022 0.385 0.130
T1 7.1 18.96 38.76 0.841 0.751 0.642
T1 5.7 14.56 30.53 0.648 0.763 0.570
T1 5.3 13.80 30.56 0.619 0.740 0.523
T1 3.9 7.52 12.67 0.231 0.667 0.450
T1 4.2 9.64 15.90 0.291 0.601 0.393
T1 2.6 5.38 6.97 0.110 0.539 0.259
T1 2.9 4.03 5.02 0.069 0.516 0.197
T1 3.9 8.37 11.76 0.165 0.504 0.234
T1 2.5 4.32 5.87 0.088 0.537 0.214
T2 14.2 42.66 78.40 1.648 0.766 0.534
T2 6.8 14.25 20.85 0.410 0.648 0.490
T2 6.2 10.95 16.48 0.268 0.565 0.341
T2 5.3 9.20 13.61 0.166 0.473 0.202
T2 5.8 9.41 16.88 0.272 0.542 0.359
T2 5.1 9.07 13.57 0.188 0.518 0.264
T2 2.9 3.92 5.10 0.059 0.500 0.259
T2 2.3 3.68 4.38 0.053 0.488 0.229
T2 2.8 4.08 5.34 0.059 0.481 0.233
T2 3.1 4.82 6.09 0.059 0.437 0.258
T3 10.2 26.62 49.07 0.915 0.723 0.558
T3 5.5 18.34 31.70 0.559 0.632 0.473
T3 4.3 7.49 11.07 0.123 0.516 0.226
T3 4.1 5.39 8.13 0.092 0.475 0.169
T3 7.9 18.96 27.96 0.405 0.544 0.346
T3 6.4 14.86 22.19 0.297 0.562 0.323
T3 2.1 3.07 4.01 0.040 0.430 0.135
T3 3.8 7.10 8.97 0.102 0.518 0.169
T3 2.6 4.74 6.18 0.069 0.464 0.171
T4 10.2 29.16 54.81 1.211 0.757 0.746
T4 6.2 17.92 30.53 0.518 0.699 0.475
T4 6.9 22.40 37.65 0.736 0.752 0.533
T4 7.1 15.02 22.74 0.379 0.749 0.323
T4 6.8 16.88 24.90 0.406 0.662 0.393
T4 5.9 14.79 20.45 0.331 0.636 0.414
T4 5.3 9.74 14.01 0.184 0.489 0.254
T4 4.5 8.44 11.16 0.167 0.669 0.384
T4 2.6 5.12 5.98 0.083 0.593 0.325
T4 3.0 4.24 5.22 0.053 0.514 0.341
T5 13.9 64.58 143.70 3.521 0.990 0.756
T5 8.8 29.08 52.64 1.043 0.782 0.506
T5 8.2 29.58 42.162 1.256 0.858 0.608
T5 6.8 23.22 39.77 0.715 0.689 0.497
T5 1.0 1.40 1.73 0.021 0.500 0.272
T5 6.7 20.01 34.05 0.655 0.790 0.520
T5 3.9 11.97 18.23 0.333 0.705 0.376
T5 4.3 8.90 13.62 0.179 0.559 0.411
T5 2.8 7.47 9.56 0.126 0.546 0.354
T5 2.4 5.23 7.09 0.089 0.511 0.204
1 T1--T5 are five different trees (2.5--3.5 m tall), from each of which samples were collected at 10 different heights. S1--S5 are suppressed trees
(1--1.5 m), from each of which two samples were collected.