Kalena E. Cortes is an assistant professor of public policy at Texas A&M University and a Faculty Re-search Fellow at the National Bureau of Economic ReRe-search. Joshua S. Goodman is an assistant professor of public policy at Harvard University and a Faculty Research Fellow at the National Bureau of Economic Research. Takako Nomi is an assistant professor of education at St. Louis University. Some of this research was conducted while Cortes was a Visiting Scholar at Stanford’s Graduate School of Education. The authors are grateful to the Chicago Public Schools for sharing their data and to Sue Sporte, Director of Re-search Operations, Consortium on Chicago School ReRe-search (CCSR) for facilitating this sharing. They also thank for helpful comments Richard Murnane, Bridget Terry Long, Jeffrey Kubik, Lori Taylor, Jacob Vigdor, Caroline Hoxby, Martin West, Kevin Stange, and Nora Gordon, as well as seminar and conference partici-pants at Harvard’s Program on Education Policy and Governance, the State of Texas Education Research Center at Texas A&M University, the Association for Education Finance and Policy, the NBER Economics of Education Program, UT- Austin’s Economics Department and the Stanford Graduate School of Educa-tion. Colin Sullivan, Heather Sarsons, Shelby Lin, and Napat Jatusripitak provided outstanding research assistance. This research was funded by the Institute of Education Sciences under award R305A120466. Institutional support from Texas A&M University, Stanford’s Center for Education Policy Analysis, and Harvard’s Taubman Center for State and Local Government are also gratefully acknowledged. The data used in this article can be obtained beginning June 2015 through May 2018 from the authors.
[Submitted July 2013; accepted February 2014]
ISSN 0022- 166X E- ISSN 1548- 8004 © 2015 by the Board of Regents of the University of Wisconsin System
T H E J O U R N A L O F H U M A N R E S O U R C E S • 50 • 1
Intensive Math Instruction and
Educational Attainment
Long- Run Impacts of Double- Dose Algebra
Kalena E. Cortes
Joshua S. Goodman
Takako Nomi
Cortes, Goodman, and Nomiabstract
I. Introduction
The high school graduation rate for American students has declined since the 1970s to about 75 percent, with black and Hispanic graduation rates hover-ing around 65 percent (Heckman and LaFontaine 2010). Poor academic preparation of students entering high school is often cited as a major source of such high dropout rates. Results from the 2011 National Assessment of Educational Progress suggest that only 35 percent of students enter high school with math skills that are considered profi cient. Black and Hispanic students’ profi ciency rates are even lower, at 13 and 20 percent, respectively.1 These low academic skills may explain observed high failure rates in ninth grade coursework, particularly in algebra (Herlihy 2007; Horwitz and Snipes 2008).
Such high failure rates are particularly worrying because of their close association with dropout rates in later grades. Early course failures prevent students from pro-gressing to more advanced coursework and from earning the credits needed to gradu-ate (Allensworth and Easton 2007). In the Chicago Public Schools (CPS), the focus of this study, roughly half of high school freshmen fail at least one course, with the highest failure rates in math courses (Allensworth and Easton 2005). Concern about this fact and the apparent failure of remediating students before entering high school led CPS to implement a double- dose algebra policy starting with students entering high school in the Fall of 2003. Under this policy, students scoring below the national median on an eighth grade math test were subsequently assigned to two periods of freshman algebra rather than the usual one period. CPS hoped that this doubling of instructional time, along with an increased emphasis on problem- solving skills and increased instructional support for teachers, would improve algebra passing rates in the short run and high school graduation rates in the long run.
To analyze the effect of the double- dose policy, we employ a regression discontinu-ity design comparing students just above and below the threshold for assignment to additional instructional time. Using longitudinal data that tracks students from eighth grade through college, we fi rst show that the treatment doubled instructional time in math; replaced largely elective courses, such as music and art, so that total coursework was unchanged; increased the homogeneity of algebra classrooms; and exposed stu-dents to lower- skilled peers in algebra class. We then show positive and substantial long- run impacts of double- dose algebra on credits earned, test scores, high school graduation, and college enrollment rates. Attainment effects were larger than test score effects would predict, highlighting the importance of evaluating educational interven-tions on longer- run outcomes. Perhaps because the intervention focused on verbal exposition of mathematical concepts, the impact was largest for students with below average reading skills, emphasizing the need to target interventions toward appropri-ately skilled students. This is the fi rst evidence we know of demonstrating the long- run impacts of such intensive math instruction.
Our study contributes to four strands of the research literature. First, given that the
The Journal of Human Resources 110
intervention studied here doubled the amount of time students were exposed to in their ninth grade algebra class, our study adds to the literature on the importance of in-structional time to student achievement. Some education reformers have pushed U.S. schools to lengthen school days and years, noting that students in many academically successful nations, particularly in Asia, spend substantially more time in school than do American students. Proponents of this view point to evidence on summer learning loss (Cooper et al. 1996), the impact of snow days (Marcotte and Hemelt 2008), the association between charter school effectiveness and instructional time (Dobbie and Fryer 2013; Hoxby and Murarka 2009; Angrist et al. 2013), and other such patterns linking student achievement to hours spent learning (Lavy 2010; Fitzpatrick et al. 2011). Another set of studies suggests this evidence is weaker than it fi rst appears, with Fryer and Levitt (2004) observing little differential summer learning loss, Goodman (2012a) showing little impact of snow days on achievement, and Checkoway et al. (2011) showing little effect of an intervention that substantially increased schools’ instructional times. The emerging consensus from this literature is that increasing in-structional time is no guarantee of better student outcomes if such time is not well spent in the classroom.
Second, this study adds to the literature concerning the short- run impact of cur-ricular interventions, particularly for students struggling in mathematics. Recent years have seen three main curriculum approaches tried by American schools. Remediation, which diverts students into basic courses prior to taking regular courses, has generally had little discernible impact on student achievement, particularly at the college level where it has most often been studied (Jacob and Lefgren 2004; Lavy and Schlosser 2005; Calcagno and Long 2008; Bettinger and Long 2009; Martorell and McFarlin 2011; Boatman and Long 2010; Scott- Clayton and Rodriguez 2012). Algebra “for all,” which pushes students to take algebra courses in earlier grades than they otherwise would have, actually harms student achievement by forcing students into subjects for which they are not suffi ciently prepared (Clotfelter et al. 2012; Allensworth et al. 2009). Double- dosing, which places students in regular courses but supplements those courses with additional instructional time, has generated short- run gains similar to the ones we estimate here in some settings (Nomi and Allensworth 2009; Nomi and Allensworth 2010; Taylor 2012; Dougherty 2013) and no gains in others (Fryer 2011). Perhaps because of perceived effectiveness at raising short- run achievement levels, the double- dose strategy has become increasingly common, with half of large urban districts reporting it as their most common form of support for struggling students.2
Third, we contribute to the literature on the long- run impacts of curriculum on student outcomes. Nearly all such research points to a close association between coursework completed in high school and later outcomes such as college enrollment and labor market earnings (Altonji 1995; Levine and Zimmerman 1995; Rose and Betts 2004; Attewell and Domina 2008; Long et al. 2009; Long et al. 2012). Most such papers attempt to deal with the bias generated by selection into coursework by controlling for a rich set of covariates, either through OLS or propensity score match-ing. Such methods leave open, however, the possibility that the remaining unobserv-ables are still important factors. The few papers that use quasi- experimental methods
to convincingly eliminate such selection bias also fi nd strong associations between completed coursework and long- run outcomes, suggesting that such selection bias is not generating the central fi ndings (Joensen and Nielsen 2009; Goodman 2012b). Our paper is one of the better identifi ed links between high school coursework and educational attainment.
Fourth, and fi nally, our results align with recent evidence that peer effects may mat-ter less than earlier research had suggested and that tracking may have substantial ben-efi ts. We will show that double- dosed students are exposed to a much lower- skilled group of peers in their algebra classes but nonetheless benefi t substantially from the additional instructional time and improved pedagogy. Recent papers on elite exam schools in the United States (Abdulkadiroglu et al. 2011; Dobbie and Fryer 2011) and Kenya (Lucas and Mbiti 2013), as well as gifted and talented programs (Bui et al. 2011), all fi nd surprisingly few positive impacts of being exposed to a very different set of peers because of discontinuities in admissions processes. Our results are also consistent with the fi ndings of Dufl o et al. (2011) that the benefi ts of tracking and the better- targeted pedagogy that results from it may outweigh the impact of being exposed to lower- skilled classmates.
The structure of our paper is as follows. In Section II, we describe in detail the double- dose algebra policy. In Section III, we describe the data and offer descrip-tive statistics about students in our sample. In Section IV, we explain the regression discontinuity underlying our identifi cation strategy. In Sections V and VI, we describe the impact of double- dosing on students’ educational experiences, coursework, test scores, and educational attainment. In Section VII, we discuss the extent to which the policy’s impacts varied by student characteristics or schools’ adherence to implemen-tation guidelines. In Section VIII, we conclude.
II. Implementing Double- Dose Algebra
Since the late 1990s, Chicago Public Schools (CPS) have been at the forefront of curriculum reform designed to increase the rigor of student coursework and prepare students for college entrance. Starting with students entering high school in the fall of 1997, CPS raised its graduation requirements to align with the New Basics Curriculum.3 CPS eliminated lower- level and remedial courses so that all fi rst- time freshmen would enroll in algebra in ninth grade, geometry in tenth grade and algebra II or trigonometry in eleventh grade. Soon after these reforms, CPS of-fi cials realized that students were unable to master the new college- prep curriculum. Passing rates in ninth grade algebra were quite low, largely because students entered high school with such poor math skills (Roderick and Camburn 1999).
The Journal of Human Resources 112
enrollment in two periods of algebra coursework for all fi rst- time ninth graders test-ing below the national median on the math portion of the eighth grade Iowa Tests of Basic Skills (ITBS). Such students enrolled for two math credits, a full- year regular algebra class plus a full- year algebra support class. Double- dose algebra students thus received 90 minutes of math class time every day for a full academic year. The fi rst math course, regular algebra, consisted mostly of class lectures. The second math course, algebra with support or algebra problem solving, focused on building math skills that students lacked. Extended instructional time allowed fl exibility in instruc-tional activities for double- dose teachers. For example, the teachers covered materials in a different order than the textbook and used various instructional activities, such as working in small groups, asking probing and open- ended questions, and using board work (Wenzel et al. 2005; Starkel et al. 2006). Our analysis focuses on the fi rst two cohorts of students because the test score- based assignment rule was not followed closely after the second year. We will refer to these as the 2003 and 2004 cohorts.
Prior to the double- dose policy, algebra curricula had varied considerably across CPS high schools due to the fairly decentralized nature of the district. Conversely, CPS offered teachers of double- dose algebra two specifi c curricula called Agile Mind and Cognitive Tutor, stand- alone lesson plans they could use, and thrice- annual pro-fessional development workshops where teachers were given suggestions about how to use the extra instructional time.4 Though it is dif
fi cult to know precisely what oc-curred in these extra classes, Nomi and Allensworth (2010) analyzed survey data to learn more about the classroom learning environment. They found that students as-signed to double- dose algebra reported much more frequently: writing sentences to explain how they solved a math problem; explaining how they solved a problem to the class; writing math problems for other students to solve; discussing possible solutions with other students; and applying math to situations in life outside of school. Thus, the additional time focused on building verbal and analytical skills in the context of learning algebra and may have conferred benefi ts in subjects other than math.
90 percent. By 2004, schools began to object to the scheduling diffi culties of assign-ing the same teacher to both periods, so CPS removed that recommendation. For the 2004 cohort, only 54 percent of double- dose students had the same teacher for both courses and only 48 percent took the two courses consecutively. Overlap between the rosters remained, however, close to 90 percent. Near the end of our analysis, we also explore whether the program’s impacts vary by cohort in part because of this variation in implementation.
The treatment under consideration here therefore had multiple components. Assign-ment to double- dose algebra doubled the amount of instructional time and exposed students to the curricula and activities discussed above. As we will show, the recom-mendation that students take the two classes with the same set of peers caused tracking by skill to increase, thus reducing classroom heterogeneity. All of these factors were likely, if anything, to improve student outcomes (Dufl o et al. 2011). We will also show, however, that the increased tracking by skill placed double- dosed students among substantially lower skilled peers than non- double- dosed students. This factor is likely, if anything, to hurt student outcomes. Our estimates capture the net impact of all of these components.
III. Data and Descriptive Statistics
We use longitudinal data from CPS that tracks students from eighth grade through college enrollment. These data include demographic information, detailed high school transcripts, numerous standardized test scores, and graduation and college enrollment information. Our main sample consists of students entering ninth grade for the fi rst time in the Fall of 2003 and 2004. We include only students who have valid eighth grade math scores and who enroll in freshman algebra. We include only high schools in which at least one classroom of students was assigned to double- dose algebra. We exclude a small number of selective magnet schools, al-ternative schools, special education schools, and those for older students, as a result of which the fi nal sample includes 73 high schools. For continuous outcomes such as test scores, students leaving CPS are missing those values and are excluded from the relevant regressions.5 For binary outcomes, students who leave the CPS school system for any reason are coded as 0s in some specifi cations and treated as missing in oth-ers. CPS attempts to track students’ reasons for leaving though the accuracy of such measures is unclear. In our sample, students who leave CPS are about evenly divided between those who are known dropouts, those who leave for other schools (private schools or public schools outside of Chicago), and those whose reasons for leaving are unknown. For many of the later outcomes, we will estimate impacts of the policy conditional on students still being present in the school system, in order to test the sensitivity of those estimates to potentially selective attrition.
The summary statistics of the analytic sample are shown in Table 1. The fi rst two columns include the entire sample and the last two include only students in our default regression discontinuity (RD) sample, construction of which we detail further below.
114
Female 0.50 40,151 0.54 9,700
Black 0.58 40,151 0.57 9,700
Hispanic 0.34 40,151 0.36 9,700
Free price lunch 0.81 40,151 0.82 9,700
Reduced price lunch 0.09 40,151 0.10 9,700
Missing lunch status 0.03 40,151 0.03 9,700
Census block poverty measure (z- score)
0.00 40,151 –0.02 9,700
Census block SES measure (z- score)
–0.00 40,151 –0.01 9,700
Special education 0.20 40,151 0.08 9,700
High school start age 14.73 40,151 14.69 9,700
2003 cohort 0.49 40,151 0.50 9,700
2004 cohort 0.51 40,151 0.50 9,700
Eighth grade reading percentile 42.69 40,151 46.14 9,700 (B) Double- dose variables
Eighth grade math percentile 45.06 40,151 49.45 9,700 Double- dose eligible 0.56 40,151 0.50 9,700
Double- dosed 0.45 40,151 0.44 9,700
Freshman math courses 1.40 40,151 1.40 9,700
Consecutive periods 0.62 17,432 0.64 4,096
Same teacher 0.66 17,432 0.70 4,096
Extent of tracking 0.92 17,432 0.92 4,096
(C) Achievement
Passed algebra 0.62 40,151 0.63 9,700
Passed geometry 0.61 40,151 0.64 9,700
Passed trigonometry 0.50 40,151 0.54 9,700
Fall tenth grade math z- score –0.00 27,110 –0.02 6,865 Fall eleventh grade math z- score –0.00 24,698 –0.04 6,209
ACT math z- score –0.00 22,001 –0.20 5,590
(D) Attainment
Graduated from high school in 4 years
0.48 40,151 0.51 9,700
Graduated from high school in 5 years
0.53 40,151 0.56 9,700
Enrolled in any college 0.28 40,151 0.30 9,700 Enrolled in 2- year college 0.16 40,151 0.17 9,700
Notes: Odd- numbered columns show mean values of each variable for the given sample. Even- numbered columns show sample sizes. Columns 1 and 2 contain all students from the 2003 and 2004 cohorts. Columns 3 and 4 limit the sample to students whose eighth grade scores are within nine percentiles of the eligibility threshold, the default regression discontinuity sample.
Panel A shows the full set of available demographic controls, which we include in later regressions. Over 90 percent of CPS students are black or Hispanic, and a similar proportion are low income as indicated by participation in the federal subsidized lunch program. Continuous and standardized measures of socioeconomic and poverty status are constructed based on each student’s residential block group from the 2000 Census. Only 8 percent of students in the RD sample are in special education because such students tend to score far below the 50th percentile in eighth grade math. The average CPS student is nearly 15 on September 1 of the fi rst year of high school. The sample is evenly split between students entering high school in the Fall of 2003 and the Fall of 2004. Finally, the average CPS student scores around the forty- third percentile on the eighth grade ITBS reading exam, or the forty- sixth percentile for students in the RD sample.
The fi rst row of Panel B shows our running variable, each student’s eighth grade score on the math portion of the ITBS, which all CPS eighth graders are required to take. We use each student’s fi rst score on the exam to avoid possible endogeneity of scores due to retesting behavior. Retesting is, however, unlikely to be problem-atic as retesting occurred only for students scoring below the thirty- fi fth percentile, a threshold for grade promotion.6 We also note here that the ITBS exam was taken in April, months after decisions about which Chicago high school to attend are made. The mean CPS eighth grade student scores around the forty- fi fth percentile on this na-tionally normed exam. As also shown in Cortes et al. (2013) and Cortes and Goodman (2014), about 56 percent of CPS students score below the 50th percentile and are thus double- dose eligible. The transcript data reveal, however, that only 45 percent enroll in double- dose algebra, suggesting imperfect compliance with the rule. As a result of double- dosing, the average CPS freshman in our sample takes 1.4 math courses freshman year.
The transcript data also allow for detailed exploration of the treatment itself. We construct variables, shown in the last three rows of Panel B, showing the extent to which schools were complying with CPS’ guidelines for implementing double- dose algebra. Of double- dosed students, 62 percent had their two algebra courses during consecutive periods and 66 percent had the same teacher for both courses, with 92 per-cent of double- dosed students’ regular algebra classmates themselves in double- dose algebra. Though not shown here, compliance with those guidelines was substantially lower in 2004 than in 2003, consistent with schools’ complaints about the diffi culty of scheduling double- dose algebra for consecutive periods and with the same teacher. We focus on two primary sets of outcomes. In Panel C, we measure students’ aca-demic achievement by constructing a variety of variables measuring grades and stan-dardized test scores. Only 62 percent of the sample receive a D or higher and thus pass algebra freshman year. A similar proportion passes geometry in their second year of high school. Only 50 percent pass trigonometry by their third year of high school. This dropoff is due both to the fact that freshman algebra is a prerequisite for such courses and that substantial numbers of students drop out between freshman and junior years. We also use a variety of test scores standardized by cohort to measure students’ mathematical knowledge, including the PLAN exam, which all CPS students take
The Journal of Human Resources 116
in September of both tenth and eleventh grade, and the ACT exam, which all CPS students take in April of eleventh grade and is commonly used in the Midwest for college applications.
In Panel D, we measure educational attainment by constructing measures of high school graduation and college enrollment rates. Students are coded as high school graduates if they received a CPS diploma within four or fi ve years of starting high school. Only 48 percent of CPS students in our sample graduate high school within four years, with another 5 percent graduating in their fi fth year. CPS has matched its data on high school graduates with the National Student Clearinghouse (NSC) data on college enrollment, allowing us to observe initial college enrollment for any CPS student with a high school diploma. The match quality is very high because the vast majority of CPS students who attend college do so at colleges covered by the NSC database. Only 3 percent of CPS high school graduates who enroll in college do so at institutions not covered by NSC.7 We construct indicators for enrollment in college by October 1 of the fi fth year after starting high school. Only 28 percent of the sample both graduate from a CPS high school and enroll in college within this timeframe, more than half of whom enroll in two- year colleges. We cannot explore college completion rates because many of the two- year colleges CPS students attend report only enrollment and not graduation information to NSC.
IV. Empirical Strategy
Comparison of the outcomes of students who are and are not assigned to double- dose algebra would yield biased estimates of the policy’s impacts given large differences in unobserved characteristics between the two groups of students. To eliminate this potential bias, we exploit the fact that students scoring below the 50th percentile on the eighth grade ITBS math test were required to enroll in double- dose algebra. This rule allows us to identify the impact of double- dose algebra using a regression discontinuity design applied to the treated cohorts. We use the assignment rule as an exogenous source of variation in the probability that a given student will be double- dosed.
Our empirical specifi cation implements the regression discontinuity approach using the following student- level equations:
(1)
Yit =␣0+␣1⋅LowScoreit+␣2⋅Math8it
+␣3⋅LowScoreit⋅ Math8it+it
(2)
DoubleDoseit =␥0+␥1⋅LowScoreit+␥2⋅Math8 it
+␥3⋅LowScoreit⋅ Math8 it+it
(3)
Yit =0+1⋅DoubleDoseit+2⋅Math8 it
+3⋅LowScoreit⋅Math8 it+it
where Yit represents an outcome of interest for student i in cohort t and DoubleDoseit is an indicator for assignment to the extra algebra period. Our running variable is
Math8
it, each student’s eighth grade math score recentered around the eligibility threshold. Because eighth grade math scores are measured by thirds of a percentile, we actually recenter the running variable around 49.5, the midway point between the highest- scoring eligible and the lowest- scoring ineligible students. Our instrument is
LowScoreit, an indicator for an eighth grade math score below the 50th percentile.
In Equation 1, the LowScoreit coeffi cient (␣1) estimates the reduced form impact of double- dose eligibility on outcomes. Equation 2 represents a fi rst- stage regression in which the LowScoreit coeffi cient (␥1) estimates the impact of double- dose eligibility on the probability of being assigned to the extra algebra period. Though we present a number of graphical versions of the reduced form equations, our tables focus on esti-mates of the DoubleDoseit coeffi cient (1) from Equation 3, in which assignment to double- dose algebra has been instrumented with eligibility. This approach estimates a local average treatment effect, the impact of double- dose algebra on those students treated as a result of the assignment rule. The validity of these estimates depends in part on the assumption that assignment to the treatment or control group affects only compliers, those whose participation is affected by the assignment rule. This assump-tion would be violated if, for example, the signal of a low eighth grade math score had stigmatizing or other effects on never- takers, those who would not enroll in dose algebra regardless of the assignment rule. We do not think this is a substantial concern in this context and later placebo tests on untreated cohorts confi rm this.
Our default specifi cation runs local linear regressions on either side of the eligibil-ity threshold, as suggested by Imbens and Lemieux (2008). We use an edge kernel of bandwidth determined by the cross- validation method described in Ludwig and Miller (2007). The bandwidth generated by this method for the fi rst- stage equation is nine percentiles, which is always lower than the bandwidth generated by the reduced form equations. We thus use nine percentiles as our default bandwidth in instrumental vari-able specifi cations, but show that our results are robust to other choices of bandwidth, including the slightly larger optimal bandwidth of 12.7 percentiles generated by the method described in Imbens and Kalyanaraman (2012).8 We include controls for gen-der, race and ethnicity, free and reduced price lunch status, special education status, the Census block poverty and socioeconomic status measures described above, eighth grade reading score and cohort, and show later that our results are robust to exclusion of such controls. We show results for the full sample and also explore heterogeneity by reading skill. To do so, we separately analyze impacts on poor and good readers, defi ned as those whose eighth grade reading scores are below and above the 50th percentile. Finally, heteroskedasticity robust standard errors are clustered by the value of the running variable to account for its coarse nature, as suggested by Lee and Card (2008).
Before moving onto our main analysis, we perform checks of the validity of the regression discontinuity strategy, as shown in Table 2. In Column 1, we check whether the double- dose eligibility threshold is associated with a change in the probability that a given student appears in our main analysis sample. To do so, we construct for all
T
Eligible –0.006 –3.336 –0.020 0.022 0.012 0.014 0.003 –0.046** –1.181* –0.008*
(0.011) (6.502) (0.015) (0.016) (0.010) (0.010) (0.020) (0.020) (0.60) (0.004)
Y at threshold 0.85 178.00 0.58 0.35 0.82 0.06 14.67 0.55 47.02 0.58
Observations 11,421 54 9,700 9,700 9,700 9,700 9,700 9,700 9,700 9,700
(B) Poor readers
Eligible 0.007 0.854 –0.034 0.016 0.008 0.016 –0.007 –0.063* –0.749 –0.005
(0.011) (4.142) (0.023) (0.031) (0.016) (0.018) (0.024) (0.036) (0.548) (0.008)
Y at threshold 0.88 101.33 0.58 0.39 0.84 0.09 14.70 0.60 34.71 0.55
Observations 6,465 54 5,625 5,625 5,625 5,625 5,625 5,625 5,625 5,625
(C) Good readers
Eligible –0.024 –4.190 0.004 0.025 0.017 0.009 0.014 –0.028 –0.808 –0.010
(0.023) (4.187) (0.049) (0.030) (0.016) (0.014) (0.026) (0.042) (0.606) (0.008)
Y at threshold 0.82 76.67 0.58 0.30 0.80 0.03 14.61 0.49 63.29 0.61
Observations 4,956 54 4,075 4,075 4,075 4,075 4,075 4,075 4,075 4,075
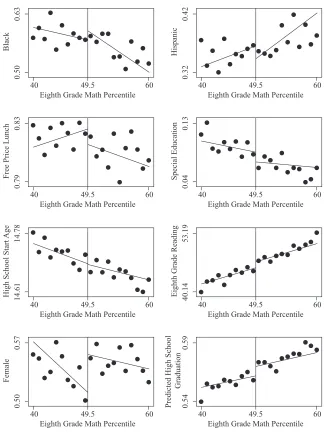
students with valid eighth grade math scores an indicator for appearing in the sample we will use in subsequent analysis. Near the double- dose threshold, 85 percent of students with valid eighth grade math scores appear in our main analysis sample. The remaining 15 percent consist of students who are held back in eighth grade, who leave the CPS system for private schools or other jurisdictions, and who enter the small number of high schools excluded from the sample. The estimates in Column 1 suggest little relationship between double- dose eligibility and the probability of appearing in our main analysis sample, implying that eligibility did not impact student decisions about when and where to attend high school. In Column 2, we check that the density of eighth grade math scores is smooth around the eligibility threshold, as suggested by McCrary (2008). To do so, we estimate discontinuities in the frequency of eighth grade math scores near the threshold in our main analysis sample. The coeffi cient estimates suggest the density is quite smooth, providing further evidence both that the eligibil-ity threshold does not affect decisions about high school attendance and that there is no observable manipulation of these test scores by students, teachers, or schools. A graphical version of the raw data and regressions predictions corresponding to these two columns can be seen in Figure A1.
The remaining columns of Table 2 test for discontinuities in any of the observed student- level covariates, to explore whether the eligibility threshold affected the char-acteristics of students appearing in the main analysis sample. Figure 1 graphs these covariates as a function of eighth grade math scores. The regression estimates and the fi gures suggest no clear differences across the threshold for students’ race and ethnicity, poverty status, special education status, or high school starting age.9 Barely eligible students are, however, 4.6 percentage points less likely to be female and score 1.2 percentiles lower in eighth grade reading than do barely ineligible students. We use the untreated 2001 and 2002 cohorts to estimate the relationship between all of these covariates and high school graduation within fi ve years, then use these estimates to generate a predicted probability of high school graduation for the treated cohorts. Column 10 of Table 2 and the last panel of Figure 1 show a marginally signifi cant discontinuity in this predicted outcome, suggesting that the treatment group is slightly more disadvantaged than their eighth grade math scores alone would predict. This is partially an artifact of the bandwidth being used, with larger bandwidths showing no statistically signifi cant covariate imbalance. Because of this slight imbalance, which would cause slight underestimation of any positive impacts of double- dosing, we choose to include the demographic controls described above in our default regression specifi cation. We show later that our main results are robust to this choice.
V. The Treatment
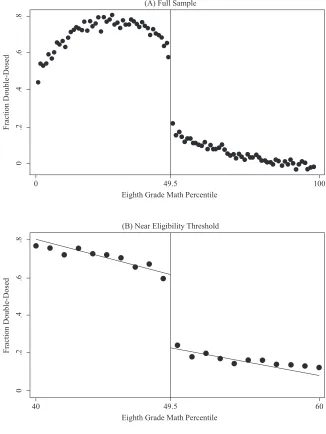
We fi rst explore the treatment itself to learn more about how the double- dose algebra policy changed students’ freshman year experiences. Panel A of Figure 2 shows the fi rst- stage relationship between eighth grade math scores, the running variable, and the probability of being double- dosed, the endogenous treatment. We
The Journal of Human Resources 120
40 49.5 60
0.63
0.50
Black
Eighth Grade Math Percentile
40 49.5 60
0.42
0.32
Hispanic
Eighth Grade Math Percentile
40 49.5 60
0.83
0.79
Free Price Lunch
Eighth Grade Math Percentile
40 49.5 60
0.13
0.04
Special Education
Eighth Grade Math Percentile
40 49.5 60
14.78
14.61
High School Start
Age
Eighth Grade Math Percentile
40 49.5 60
53.19
40.14
Eighth Grade Reading
Eighth Grade Math Percentile
40 49.5 60
0.57
0.50
Female
Eighth Grade Math Percentile
40 49.5 60
0.59
0.54
Predicted High School
Graduation
Eighth Grade Math Percentile
Figure 1
Covariates as a Function of Eighth Grade Math Scores
(A) Full Sample
0 49.5
Eighth Grade Math Percentile
100
.8
.6
.4
.2
0
.8
.6
.4
.2
0
Fraction Double-Dosed
Fraction Double-Dosed
(B) Near Eligibility Threshold
40 49.5
Eighth Grade Math Percentile
60
Figure 2
The Probability of Being Double- Dosed
122
Table 3
Double- Dose Algebra, Freshman Course- Taking and Peers
First
Double- dosed 0.384*** 0.961*** –0.141** –0.415*** –0.205*** –0.090** –0.006 0.143 –19.230*** –3.381***
(0.024) (0.027) (0.064) (0.046) (0.062) (0.035) (0.026) (0.096) (0.904) (0.428)
Y at threshold 0.24 1.21 3.51 0.54 0.52 0.20 0.95 6.98 51.48 15.73
Observations 9,700 9,700 9,700 9,700 9,700 9,700 9,700 9,700 9,700 9,700
(B) Poor readers
Double- dosed 0.389*** 0.968*** –0.309*** –0.335*** –0.194** –0.032 0.000 0.156 –20.229*** –3.342***
(0.026) (0.028) (0.074) (0.057) (0.086) (0.046) (0.037) (0.118) (1.124) (0.598)
Y at threshold 0.30 1.26 3.68 0.49 0.43 0.14 0.94 6.95 49.47 15.79
Observations 5,625 5,625 5,625 5,625 5,625 5,625 5,625 5,625 5,625 5,625
(C) Good readers
Double- dosed 0.371*** 0.944*** 0.102 –0.549*** –0.221*** –0.172*** –0.017 0.106 –18.153*** –3.284***
(0.029) (0.037) (0.080) (0.094) (0.069) (0.054) (0.022) (0.114) (1.612) (0.533)
Y at threshold 0.17 1.16 3.30 0.62 0.64 0.29 0.97 7.01 54.13 15.64
Observations 4,075 4,075 4,075 4,075 4,075 4,075 4,075 4,075 4,075 4,075
see a large but fuzzy discontinuity, suggesting strong but imperfect compliance, with assignment rates reaching a maximum of about 80 percent for students in the 20–40th percentiles. Students in the lowest percentiles had lower double- dose rates because they were more likely to be supported through other, special education programs.10 Students in the 40–49th percentiles had slightly lower compliance rates, likely be-cause some were determined to be close enough to the threshold as to not require such intervention. Some students above the threshold were double- dosed, likely because teachers thought they would benefi t from the course or because schools could not perfectly divide students into appropriately sized classes by the assignment rule.
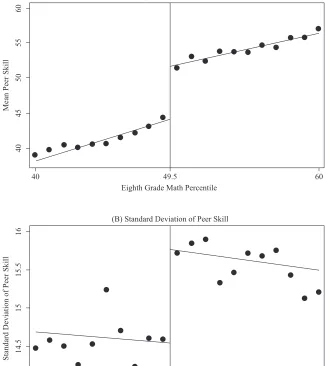
Column 1 of Table 3 shows the regression estimate of that fi rst- stage discontinuity, with a graphical version in Panel B of Figure 2. Students just below the eligibility threshold are 38.4 percentage points more likely to be double- dosed than students just above the threshold. The F- test of the excluded instrument exceeds 250, well above the threshold needed for a strong instrument. The magnitude of the discontinuity is nearly identical for poor and good readers.11 The remaining columns of the Table 3 show instrumental variables estimates of various aspects of the double- dose treat-ment itself. Column 2 shows the most obvious impact, namely that double- dosed students took one additional math course as a result of the policy.12 Columns 3–8 show that this additional course came at the expense of other coursework. Relatively few of those replaced courses were in the core subjects of science, English, and social studies. Many more were in music and art courses and, to a lesser extent, vocational education and foreign language courses. Double- dose algebra did not replace physical education or health courses. As a result, double- dosing did not signifi cantly change the total number of courses taken by students. Columns 9 and 10, as well as Figure 3, show how the requirement that double- dosed students have the same classmates in both their double- dose and regular algebra periods substantially increased tracking by math skill, where skill is measured by peers’ eighth grade math scores. Double- dosing lowered the mean math skill of students’ regular algebra peers by nearly 20 percentiles and reduced the standard deviation of peers’ math skills by over 3 percentiles. These changes in peer composition were quite similar for poor and good readers.
In summary, double- dosing doubled instructional time in math, replaced largely elective courses so that total coursework was unchanged, increased the homogeneity of algebra classrooms, and exposed students to lower- skilled peers in algebra class. The net effect of these changes is theoretically unclear, given prior evidence that in-creased instructional time and peer homogeneity may be helpful while dein-creased peer quality may be harmful. Students may also be discouraged by the replacement of
elec-10. Our central results are unchanged if special education students are excluded from the regression discon-tinuity analysis, in part because such students tend to be far below the eligibility threshold.
11. Table A1 shows first- stage results for various subsamples of students. The discontinuity in assignment to double- dose algebra is 50.8 percentage points in Fall 2003, about twice as large as the 25.8 percentage point discontinuity in Fall 2004, suggesting that the assignment rule was followed more strictly in the first year of the policy than in the second. The remainder of the table shows no apparent first- stage heterogeneity by gender or income. Black and Hispanic students show similar first stages, though the small number of white students in CPS are about half as likely to be double- dosed as a result of the assignment rule. We later show that, though the first- stage estimates vary by cohort and for white students, instrumental variables estimates of the program’s effect on various outcomes do not.
The Journal of Human Resources 124
(A) Mean Peer Skill
40 49.5
Eighth Grade Math Percentile
60
60
55
50
45
40
16
15.5
15
14.5
14
Mean Peer Skill
Standard Deviation of Peer Skill
(B) Standard Deviation of Peer Skill
40 49.5
Eighth Grade Math Percentile
60
Figure 3
Peer Composition of Freshman Algebra Class
tive courses that some enjoy more than traditional academic courses. We now turn to empirical analysis of the overall impact of these various channels on coursework, test scores, and educational attainment.
VI. Educational Outcomes
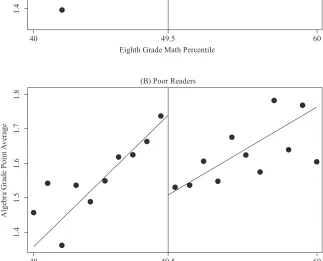
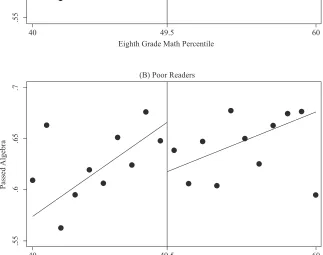
A. CourseworkThe theory behind the double- dose policy is that additional instructional time and other aspects of the treatment should improve students’ performance in their freshman algebra classes, with the hope that such improvement leads to success in later coursework. We explore this in Table 4, which presents estimates of the impact of double- dosing on a variety of freshman coursework measures. The estimates from Column 1 suggest that double- dosing improved students’ grades in their regular freshman algebra classes by over 0.4 grade points on a 4.0 scale. Nearly all of this improvement was driven by poor readers, who experienced more than 0.6 grade point rise in algebra GPA. The reduced form versions of these estimates are presented graphically in Figure 4. This improve-ment in algebra grades occurred across the grade distribution, as shown in Columns 2–5. Perhaps most importantly, double- dosed students were a marginally signifi cant 9.3 percentage points more likely to pass freshman algebra. Poor readers’ pass rates increased by an even larger and statistically signifi cant 13.2 percentage points. The re-duced form versions of these estimates are presented graphically in Figure 5. Given an overall 62 percent algebra pass rate for barely ineligible students, these estimates sug-gest that double- dosing reduced failure rates by about one- fourth (9.3/38), or more than one- third among poor readers (13.2/36). Double- dosing also substantially improved the fraction of students receiving Bs and Cs, though had little effect on the receipt of As.
Though it is diffi cult to measure spillover effects onto other subjects because the composition of non- math coursework changed as a result of the policy, Columns 6 and 7 show little evidence that assignment to double- dose algebra either increased or de-creased grade point averages in other types of classes. Perhaps most relevant to the ulti-mate outcome of high school graduation is the number of credits students earned, shown in Columns 8 and 9. Double- dosed students, unsurprisingly, earned nearly a full addi-tional math credit, most of which is due to the addiaddi-tional double- dose period and some of which is due to the increased pass rates in regular algebra. Poor readers’ math credits increased more than did good readers’, in part because good readers’ pass rates in regular algebra were not improved by the intervention and because good readers were more likely than poor readers to have earned credits in the classes replaced by double- dose algebra. The net result is that poor readers earned a marginally signifi cant additional 0.6 total credits during freshman year while good readers earned 0.4 fewer credits.
T
First Year Grades and Credits Earned
Freshman
Double- dosed 0.434*** 0.093* 0.121*** 0.125*** 0.033 –0.038 0.025 0.848*** 0.204
(0.079) (0.050) (0.038) (0.031) (0.021) (0.095) (0.080) (0.041) (0.218)
Y at threshold 1.51 0.62 0.35 0.14 0.05 1.82 2.10 0.92 5.62
Observations 9,700 9,700 9,700 9,700 9,700 9,698 9,690 9,700 9,700
(B) Poor readers
Double- dosed 0.648*** 0.132** 0.185*** 0.165*** 0.048* 0.022 0.176 0.994*** 0.590*
(0.148) (0.066) (0.058) (0.045) (0.029) (0.130) (0.139) (0.074) (0.340)
Y at threshold 1.53 0.64 0.35 0.16 0.05 1.80 2.08 0.95 5.51
Observations 5,625 5,625 5,625 5,625 5,625 5,624 5,618 5,625 5,625
(C) Good readers
Double- dosed 0.116 0.028 0.027 0.063 0.015 –0.122 –0.200 0.626*** –0.375**
(0.120) (0.068) (0.055) (0.053) (0.028) (0.115) (0.162) (0.065) (0.189)
Y at threshold 1.48 0.60 0.35 0.11 0.05 1.86 2.13 0.88 5.77
Observations 4,075 4,075 4,075 4,075 4,075 4,074 4,072 4,075 4,075
(A) All Students
40 49.5
Eighth Grade Math Percentile
60
1.8
1.7
1.6
1.5
1.4
1.8
1.7
1.6
1.5
1.4
Algebra Grade Point
A
v
erage
Algebra Grade Point
A
v
erage
(B) Poor Readers
40 49.5
Eighth Grade Math Percentile
60
Figure 4
Freshman Algebra GPA
The Journal of Human Resources 128
(A) All Students
40 49.5
Eighth Grade Math Percentile
60
.7
.65
.6
Passed Algebra
.55
.7
.65
.6
Passed Algebra
.55
(B) Poor Readers
40 49.5
Eighth Grade Math Percentile
60
Figure 5
Freshman Algebra Pass Rates
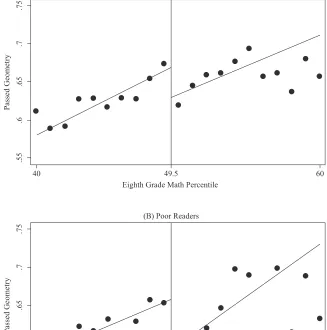
Table 5 examines outcomes in the second year of high school. In Column 1, we see no evidence that double- dosing changed the probability that a student would be present in the second year of high school, where presence is defi ned by enrolling in at least one credit of coursework.13 This implies little scope for selective attrition with respect to outcomes measured in the second year of high school. Columns 2 and 3 estimate the impact of double- dosing on the probability of taking geometry in the second year, which indicates a student is on track to graduate. Column 2 assigns 0s to students no longer present in CPS, whereas Column 3 conditions the sample on being present. Both sets of estimates tell a consistent story that double- dosed students were seven to nine percentage points more likely to take geometry in their second year of high school, a result driven entirely by a 13–16 percentage point increase for poor readers. These magnitudes are nearly identical to the improved pass rates in freshman algebra, suggesting that students prevented from freshman failure by the double- dose policy continued to be on track to graduate in their second year of high school.
Columns 4–6 estimate the impact of double- dosing on the probability of passing geometry in a student’s second year of high school. We assign 0s to all students not present in CPS or who are in CPS but not taking geometry, usually because they are being required to repeat algebra. Column 4 thus includes all students, Column 5 condi-tions the sample on being present in CPS, and Column 6 condicondi-tions the sample on be-ing present in CPS and takbe-ing geometry. Columns 4 and 5 indicate the double- dosbe-ing increased the geometry pass rate by a substantial and signifi cant 12–14 percentage points, driven largely by an 18–21 percentage point increase for poor readers. Figure 6 shows this clear discontinuity, graphing the reduced form version of Column 4. The estimates in Column 6 are roughly two- thirds the size of Column 4, suggesting that about one- third of the improvement is due to the increase in the fraction of students taking geometry, while the remaining two- thirds comes from students who, in the absence of the double- dose policy, would have taken but failed geometry.
As a result of these increased geometry pass rates, students who were double- dosed in their fi rst year of high school earn 0.07–0.09 additional math credits in their second year, as seen in Columns 7 and 8. All of this increase is driven by poor readers, who earned 0.15–0.18 additional second- year math credits as a result of double- dosing. There also seem to be positive spillovers into nonmath subjects. Columns 9 and 10 suggest that double- dosed students earn a total of 0.43–0.57 additional total credits, all of which is driven by poor readers earning more than one full additional second- year credit. These magnitudes are roughly six times the size of the impacts on math credits, suggesting that double- dosing had substantial positive spillover effects onto other subjects.
Table 6 summarizes the impact of double- dosing in the third and fourth years of high school. Double- dosing increases the probability of being present in the third year by a large but statistically insignifi cant 5.9 percentage points, or 7.9 percentage points for poor readers.14 There is no statistically signi
fi cant indication of increased math credit earning. The magnitude of the impact on poor readers’ overall credits earned is, however, a fairly large 0.65 credits. Fourth year results are similar, with double- dosing increasing the prob-ability of being present in the fourth year by 6.8 percentage points, or 10.3 percentage
130
Double- dosed –0.015 0.072 0.091** 0.117** 0.140** 0.084* 0.070* 0.088** 0.428* 0.566**
(0.026) (0.050) (0.045) (0.052) (0.055) (0.045) (0.041) (0.043) (0.255) (0.222)
Y at threshold 0.91 0.74 0.82 0.62 0.68 0.81 0.61 0.68 5.20 5.74
Observations 9,700 9,700 8,719 9,700 8,719 7,231 9,700 8,719 9,700 8,719
(B) Poor readers
Double- dosed –0.008 0.133* 0.155** 0.183*** 0.208*** 0.123** 0.154** 0.179*** 1.052** 1.239***
(0.039) (0.078) (0.072) (0.069) (0.075) (0.055) (0.062) (0.058) (0.439) (0.381)
Y at threshold 0.90 0.71 0.79 0.61 0.67 0.81 0.60 0.66 4.89 5.45
Observations 5,625 5,625 5,036 5,625 5,036 4,138 5,625 5,036 5,625 5,036
(C) Good readers
Double- dosed –0.025 –0.015 –0.001 0.036 0.057 0.049 –0.043 –0.034 –0.441 –0.370
(0.036) (0.064) (0.069) (0.072) (0.084) (0.068) (0.047) (0.062) (0.283) (0.347)
Y at threshold 0.92 0.77 0.84 0.64 0.70 0.80 0.64 0.70 5.61 6.11
Observations 4,075 4,075 3,683 4,075 3,683 3,093 4,075 3,683 4,075 3,683
(A) All Students
40 49.5
Eighth Grade Math Percentile
60
.75
.7
.65
.6
.55
.75
.7
.65
.6
.55
Passed Geometry
Passed Geometry
(B) Poor Readers
40 49.5
Eighth Grade Math Percentile
60
Figure 6
Second Year Geometry Pass Rates
132
Table 6
Third and Fourth Year Credits Earned
Third Year of High School Fourth Year of High School
Present,
Double- dosed 0.059 0.044 0.001 0.242 –0.088 0.068 0.061 0.057 0.600* 0.319
(0.038) (0.045) (0.061) (0.275) (0.214) (0.052) (0.047) (0.072) (0.317) (0.250)
Y at threshold 0.76 0.61 0.79 4.09 5.36 0.63 0.23 0.37 3.61 5.77
Observations 9,700 9,700 7,441 9,700 7,441 9,700 9,700 6,251 9,700 6,251
(B) Poor readers
Double- dosed 0.079 0.011 –0.059 0.649 0.336 0.103 0.088 0.081 0.780** 0.318
(0.054) (0.076) (0.086) (0.413) (0.301) (0.065) (0.063) (0.090) (0.345) (0.256)
Y at threshold 0.73 0.59 0.81 3.87 5.28 0.60 0.21 0.35 3.46 5.78
Observations 5,625 5,625 4,253 5,625 4,253 5,625 5,625 3,524 5,625 3,524
(C) Good readers
Double- dosed 0.039 0.097 0.084 –0.286 –0.654* 0.022 0.019 0.017 0.364 0.338
(0.053) (0.087) (0.098) (0.441) (0.369) (0.073) (0.086) (0.141) (0.605) (0.564)
Y at threshold 0.80 0.62 0.78 4.37 5.46 0.66 0.26 0.39 3.81 5.76
Observations 4,075 4,075 3,188 4,075 3,188 4,075 4,075 2,727 4,075 2,727
points for poor readers.15 Double- dosed students earn a marginally signifi cant 0.6 more credits in their fourth year or a signifi cant 0.78 credits for poor readers, relatively little of which consists of additional math credits. In both the third and the fourth years, roughly half of the increase in credits earned stems from the increased probability of being present at all, as can be seen by comparing Column 4 to Column 5 and Column 9 to Column 10.
In summary, double- dose algebra had large and positive impacts on a variety of coursework measures. Double- dosed students, and particularly poor readers, performed substantially better in freshman algebra and were more likely to pass that course. There is little evidence that the policy affected performance in freshman nonmath courses. Second- year performance also improved substantially, with double- dosed students more likely to take and pass geometry, as well as earn more total credits. The magnitude of the estimates also suggests that double- dosing increased the probability that a student was present in CPS in their third and fourth year of high school, though those estimates are not statistically signifi cant.
B. Test Scores
Further evidence of the benefi ts of the treatment comes from Table 7, which explores the impact of double- dosing on math test scores, as measured by the PLAN exams taken in October of tenth and eleventh grades and the ACT exam taken in April of eleventh grade. Each of these exams tests a variety of algebra and geometry concepts. For each exam, we explore three outcomes: the probability that a student took the math portion of the exam (a noisy indicator of being on track to graduate), standardized math exam scores conditional on taking the exam, and standardized scores on the verbal portion of the exam. Column 1 shows that double- dosed students were a statistically insignifi cant 4.5 percentage points more likely to take the Fall tenth grade exam, driven by a margin-ally signifi cant 10.2 percentage point increase for poor readers. For those who took the exam, double- dosing raised math scores by a statistically insignifi cant 0.09 standard deviations, driven by a marginally signifi cant 0.18 standard deviation increase for poor readers.16 Verbal scores rose by a statistically insigni
fi cant 0.11 standard deviations. Larger positive impacts are seen in the Fall eleventh grade and Spring eleventh grade exams, perhaps consistent with the dramatically improved second- year coursework performance previously discussed. Double- dosed students were a marginally signifi -cant 6.5 percentage points more likely to take the Fall eleventh grade exam (consistent with the magnitude of the increased probability of being present in the third year), and those who took the exam improved by a signifi cant 0.24 standard deviations. Poor read-ers improved by 0.32 standard deviations. The reduced form vread-ersions of these estimates are presented graphically in Figure 7. ACT math scores improved by a similar and highly signifi cant 0.18 standard deviations.17 Interestingly, improvements on the ACT math exam were quite similar for poor and good readers. ACT verbal scores increased by a highly signifi cant 0.27 standard deviations, driven largely by a 0.45 standard de-viation improvement for good readers. The ACT exam is one measure of achievement that, unlike coursework, double- dosing greatly improved for good readers.
T
Double- Dose Algebra and Math Test Scores
PLAN, Fall Tenth Grade PLAN, Fall Eleventh Grade ACT, Spring Eleventh Grade
Took
Double- dosed 0.045 0.086 0.109 0.065* 0.235** 0.075 0.009 0.180*** 0.273***
(0.053) (0.094) (0.067) (0.035) (0.101) (0.101) (0.031) (0.065) (0.078)
Y at threshold 0.69 0.00 –0.05 0.64 –0.05 0.02 0.57 –0.19 –0.10
Observations 9,700 6,865 6,882 9,700 6,209 6,219 9,700 5,590 5,590
(B) Poor readers
Double- dosed 0.102* 0.180* 0.102 0.088* 0.316** 0.083 0.051 0.156* 0.154
(0.060) (0.105) (0.089) (0.048) (0.135) (0.117) (0.047) (0.083) (0.109)
Y at threshold 0.66 –0.11 –0.31 0.60 –0.17 –0.27 0.55 –0.28 –0.40
Observations 5,625 3,911 3,925 5,625 3,530 3,538 5,625 3,120 3,120
(C) Good readers
Double- dosed –0.042 –0.060 0.099 0.045 0.143 0.052 –0.044 0.206* 0.454***
(0.076) (0.125) (0.105) (0.066) (0.144) (0.100) (0.054) (0.119) (0.155)
Y at threshold 0.74 0.14 0.27 0.68 0.10 0.35 0.60 –0.08 0.26
Observations 4,075 2,954 2,957 4,075 2,679 2,681 4,075 2,470 2,470
(A) All Students
40 49.5
Eighth Grade Math Percentile
60
.2
.1
0
–.1
–.2
Fall Eleventh Grade, Math z-Score
–.3
.2
.1
0
–.1
–.2
–.3
Fall Eleventh Grade, Math z-Score
(B) Poor Readers
40 49.5
Eighth Grade Math Percentile
60
Figure 7
Math Test Scores, Fall Eleventh Grade
The Journal of Human Resources 136
One potential concern with these estimates is that differential selection into test- taking caused by double- dosing might generate bias in these results. We check this possibility in Table A2 by re- estimating the effects of double- dose algebra on all three math scores, under three different assumptions about attrition. Under the fi rst assumption, we assign each student missing a test score to the z- score equivalent of their eighth grade math per-centile score, assuming no change in their overall place in the distribution. Under the sec-ond assumption, we assign those missing scores a 40th percentile score, equivalent to the bottom end of the RD sample used here. Under the third assumption, we assign those miss-ing scores a 60th percentile score, equivalent to the top end of the RD sample used here. We thus test the sensitivity of our estimates to different assumptions about the achievement of attriting students. These assumptions tend to lower the magnitude of the estimated im-pacts. The Fall eleventh grade PLAN and ACT exam scores improvements, for example, now fall into the 0.08–0.14 range, about half of the previous estimates. Nonetheless, all but one of these estimates are statistically signifi cant, which we take as strong evidence of small improvements in math achievement as measured by these exams.
C. Educational Attainment
We have seen clear evidence that double- dosing substantially improves freshman and sophomore course performance and credits earned and has small positive effects on stan-dardized exam performance. We have also seen suggestive evidence that double- dosing increases the probability of students being present in their third and fourth years of high school, as measured by rates of credit- taking and test- taking. We now turn to evidence about the impact of double- dose algebra on educational attainment.
Cort
es
, G
oodm
an, a
nd N
om
i
137
Math Credits Earned
1
Total Credits Earned
2
Earned More Than 24 Credits
3
Graduated High School Within
Four Years 4
Graduated High School Within
Five Years 5
Graduated High School Within Five
Years, if Present 6
(A) Full sample
Double- dosed 1.023*** 1.474 0.085*** 0.098* 0.121** 0.042
(0.116) (0.905) (0.033) (0.054) (0.047) (0.047)
Y at threshold 2.37 18.52 0.46 0.51 0.56 0.84
Observations 9,700 9,700 9,700 9,700 9,700 6,251
(B) Poor readers
Double- dosed 1.246*** 3.072** 0.129** 0.137** 0.179*** 0.072
(0.197) (1.350) (0.052) (0.063) (0.053) (0.051)
Y at threshold 2.35 17.73 0.44 0.50 0.54 0.84
Observations 5,625 5,625 5,625 5,625 5,625 3,524
(C) Good readers
Double- dosed 0.699*** –0.739 0.024 0.044 0.043 0.001
(0.142) (1.298) (0.080) (0.075) (0.073) (0.070)
Y at threshold 2.40 19.56 0.48 0.52 0.58 0.85
Observations 4,075 4,075 4,075 4,075 4,075 2,727
The Journal of Human Resources 138
(A) All Students
40 49.5
Eighth Grade Math Percentile
60
20
19
18
17
16
20
19
18
17
16
Credits Earned,
Y
ears 1–4
Credits Earned,
Y
ears 1–4
(B) Poor Readers
40 49.5
Eighth Grade Math Percentile
60
Figure 8
Credits Earned through Fourth Year of High School
estimates are presented graphically in Figure 9. Finally, estimates in Column 6 are about one- third the magnitude of those in Column 5. This suggests that most of the impact on high school graduation comes not from helping fourth- year students earn their fi nal credits but instead from helping students reach their third and fourth year at all.
Because CPS has linked its high school graduates with records from the National Stu-dent Clearinghouse (NSC), we can also observe the impact of double- dose algebra on college enrollment. The fi rst four columns of Table 9 treat any student not enrolling in college as a 0, including students who fail to graduate from CPS and are thus not linked to NSC records. Double- dosing increases by 10.8 percentage points the probability that stu-dents enroll in any type of college within fi ve years of starting high school (that is, within one year of on- time high school graduation). The reduced form version of this estimate is presented graphically in Figure 10. Columns 2 and 3 show that most of this effect comes from enrollment in two- year community colleges, particularly part- time enrollment, an expected result given the relatively low academic skills and high poverty rates of CPS stu-dents near the double- dose threshold. Within eight years of entering high school (that is, within four years of on- time high school graduation), double- dosing increases by a mar-ginally signifi cant 0.63 the number of semesters students have been enrolled in college.18 This observed college enrollment increase is, unlike most of the prior credit- earning measures, driven fairly equally by both poor and good readers. If anything, good read-ers’ college enrollment is more dramatically affected, with double- dosing increasing the number of semesters enrolled by nearly one. This may be related to the observed increase in good readers’ ACT scores. Double- dose algebra may have helped poor read-ers largely through the credit- earning and high school graduation channel while good readers’ benefi ted more through the achievement channel. Conditioning the sample on high school graduation in Columns 5–8, rather than assigning 0s to those who fail to graduate, has relatively little effect on the overall point estimates, with those of poor readers falling but those of good readers rising.
D. Heterogeneity, Robustness, and Implementation
Our primary results suggest that double- dose algebra improved a variety of student outcomes. Most of this improvement was driven by the subgroup of students we have identifi ed as poor readers, perhaps because of the emphasis on building verbal and analytical skills in the context of learning freshman algebra. We focus on this particular dimension of heterogeneity, namely students’ reading skills, in part because the double- dose algebra policy was designed to target students’ math skills and not specifi c stu-dent demographics (for example, race and ethnicity, gender, or socioeconomic status). Nonetheless, in Table A3 we explore heterogeneity by other student characteristics by taking our default specifi cation and interacting both the instrument (double- dose eligi-bility) and the endogenous regressor (double- dose assignment) with indicators for three types of students. The top panel divides students by gender, the second divides them by those living above and below the median Census block poverty level within CPS, and the third divides students by race and ethnicity, with the white category includ-ing a small number of Asian students and those listinclud-ing race as “other.” At the bottom
The Journal of Human Resources 140
(A) All Students
40 49.5
Eighth Grade Math Percentile
60
.65
.6
.55
.5
.45
.65
.6
.55
.5
.45
Graduated High School in 5
Y
ears
Graduated High School in 5
Y
ears
(B) Poor Readers
40 49.5
Eighth Grade Math Percentile
60
Figure 9
High School Graduation, Within Five Years
Cort
(0.048) (0.033) (0.031) (0.328) (0.071) (0.054) (0.053) (0.547)
Y at threshold 0.28 0.16 0.08 1.76 0.51 0.29 0.14 3.14
Observations 9,700 9,700 9,700 9,700 5,415 5,415 5,415 5,415
(B) Poor readers
Double- dosed 0.111 0.030 0.072 0.367 0.041 –0.051 0.075 –0.315
(0.087) (0.072) (0.056) (0.498) (0.138) (0.124) (0.101) (0.859)
Y at threshold 0.26 0.16 0.08 1.59 0.48 0.30 0.15 2.93
Observations 5,625 5,625 5,625 5,625 3,021 3,021 3,021 3,021
(C) Good readers
Double- dosed 0.098 0.111 0.096* 0.989*** 0.130 0.170 0.160* 1.414**
(0.071) (0.075) (0.053) (0.377) (0.089) (0.124) (0.096) (0.698)
Y at threshold 0.32 0.15 0.07 1.98 0.54 0.26 0.13 3.40
Observations 4,075 4,075 4,075 4,075 2,394 2,394 2,394 2,394
The Journal of Human Resources 142
(A) All Students
40 49.5
Eighth Grade Math Percentile
60
.4
.35
.3
.25
.2
.4
.35
.3
.25
.2
Enrolled in
Any College
Enrolled in
Any College
(B) Poor Readers
40 49.5
Eighth Grade Math Percentile
60
Figure 10
College Enrollment, Within Five Years of Starting High School
of each column is a p- value from a test of the equality of the coeffi cients. There is no evidence of heterogeneity by gender or income across any of the six major outcomes examined here, nor across many other outcomes explored but not shown here.
There is no evidence of differential effects on algebra- passing rates by race and ethnic-ity, with nearly identical point estimates for black, Hispanic, and white students. There is evidence that black students’ geometry pass rates increased more than those of Hispanic and white students, though no evidence that total credits earned were differentially af-fected by race. Double- dosing improved black students’ high school graduation rates by 12.6 percentage points, a magnitude marginally signifi cantly different from the 7.6 percentage point increase seen for Hispanic students. Black students’ college enrollment rates increased by a highly signifi cant 15.3 percentage points, a magnitude signifi cantly different from Hispanic students who saw no increase, but statistically indistinguishable from white students. Overall, these results suggest that black students benefi ted more from double- dosing than did other students but only with respect to some outcomes.
Table A4 tests the robustness of our main results to a variety of changes in regres-sion specifi cation, with Panel A showing results for all students and Panel B focusing on poor readers. The top row of each panel repeats our estimates from the default spec-ifi cation using the cross- validation (CV) bandwidth of nine percentiles and including demographic controls. The second row uses the same specifi cation but removes the de-mographic controls. The third row repeats the default specifi cation but expands the band-width to 12.7 percentiles, which was suggested as the optimal bandband-width by the Imbens- Kalyanaraman (IK) procedure applied to the fi rst stage. The fourth row shows a bandwidth of fi ve percentiles, roughly 50 percent of the cross- validation bandwidth. The magnitude and statistical signifi cance of our main results is largely robust to this variety of specifi cations. The fi fth and fi nal row of each panel shows reduced form versions of our default specifi cation using the untreated 2001 and 2002 cohorts who entered CPS prior the double- dose policy’s enactment. None of those estimates are statistically signifi cant. This placebo test reassures us that the observed discontinuities in outcomes start appearing only in the years after the policy was enacted.