47
INDEPENDENCE TEST OF GAMELAN INSTRUMENTS SIGNAL
IN TIME DOMAIN AND FREQUENCY DOMAIN
a
Atik Wintarti, bYoyon K. Suprapto, cWirawan
a,b,c
Electrical Engineering Dept., Faculty of Industrial Technology, Institut Teknologi Sepuluh Nopember, Surabaya 60111
a
Mathematics Dept., Faculty of Mathematics and Sains, The State University of Surabaya, Surabaya 60231
E-mail: [email protected]
Abstrak
Gamelan merupakan salah satu warisan budaya Indonesia yang sudah diakui dunia sehingga perlu dilestarikan di antaranya dengan melakukan penelitian terhadapnya. Untuk menganalisa gamelan yang merupakan suatu orkestra dari beberapa instrumen diperlukan pemisahan di antara sinyal-sinyal instrumen gamelan tersebut. Salah satu metode pemisahan yang cukup handal adalah Independent Component Analysis (ICA) yang mensyaratkan komponen-komponennya independen secara statistik. Pada penelitian ini uji independensi pada sinyal gamelan dilakukan dengan menggunakan metode statistik non-parametrik yaitu Least-Square Independence Test (LSIT). Pada pengolahan sinyal digital terdapat dua domain yaitu domain waktu dan domain frekuensi. Uji independensi dilakukan pada setiap pasang sinyal instrumen gamelan dari keluarga balungan yaitu Demung, Saron, dan Peking tidak hanya dalam domain waktu namun juga domain frekuensi. Hasil penelitian menunjukkan nilai Squared-Loss Mutual Information (SMI) hasil LSIT pada domain waktu lebih rendah daripada nilai SMI hasil LSIT pada domain frekuensi. Hal ini mungkin disebabkan oleh pengaruh dari Fast Fourier Transform (FFT) dimana tidak semua hasil transformasi pada domain frekuensi digunakan namun hanya meliputi frekuensi dasarnya saja.
Kata kunci: uji independensi, gamelan, LSIT, domain waktu, domain frekuensi .
Abstract
Gamelan is one of Indonesian cultural heritage that has been recognized worlwide that need to be preserved such as doing some researches. Analyzing gamelan that plays like an orchestra of several instruments is needed separation between them. One of powerful separation method is Independent Component Analysis (ICA) that has prerequisite independent statistically for its components. In this research we use non-parametric statistical independence test, i. e. Least-Square Independence Test (LSIT). In digital signal processing there are two domain, e.g. time domain and frequency domain. The independence test is held for balungan group that consists of Demung, Saron, and Peking signals not only in time-domain but also frequency-domain. The results show that the Squared-Loss Mutual Information (SMI) value of LSIT in time-domain is lower than that in frequency domain. This may be due to the influence of Fast Fourier Transform (FFT) where not all of the results in the frequency domain transformations used but only just covering the fundamental frequency.
INTRODUCTION
Identifying the statistical independence of random variables depends on their distribution [1]. A classic independence test is the Pearson correlation coefficient that is useful for Gaussian data. In practice, data in Gaussian distribution is rarely found. Therefore, the independence of such non-Gaussian data is well-evaluated by using a non-parametric statistical independene test. There are many researches of distribution-free independence test, for example: Chiu, et. al. [2] use multivariate uniformity for speech signals, Ihler, et. al. [3] use machine learning approach for image signals, Ku and Fine [4] use Bayesian procedure for sample data, Geenens, et. al.[5] use two-way contingency tables for insurance data, and, Sugiyama and Suzuki [6] use Least-Square Independence Test (LSIT) for toy datasets.
We focus our research on the signals produced by instruments of gamelan, i.e. Balungan group, which are Saron Demung (Demung), Saron Bonang (Saron), and Saron Penerus (Peking) (see Figure 1.). Demung is one octave below Saron, while Peking is an octave above Saron. We have detected that the signals of these instruments have non-Gaussian distribution [7]. Also, we have done independent test by using LSIT on that signals but only in time-domain from one gamelan set [8]. Musical signal as sinusoidal complex is suitable to be analyzed on frequency-domain [9]. It motivates us to test independence of gamelan instruments signals not only in time-domain but also in frequency-domain.
Meanwhile, gamelan is hand-made and constructed manually based on the gamelan masters’s feeling and experience. On the other hand, the player style e.g. the strength of the hit and the location of attack area, also contributes some variations in produced gamelan signals. These conditions cause the frequency of signals, signal envelope and harmonic contents of instrument’s sound in one gamelan can be different from that in other gamelan (see Table 1.)
Although gamelan is played like an orchestra but each instrument produces monophonic audio signals which every tone has a fundamental frequency [10]. Due to these facts, it has been an important issue
Figure 1. The Balungan Group
Table 1. Fundamental Frequency of Saron from Several Gamelan Sets [10] Notation Fundamental Frequency (Hz)
Set 1 Set 2 Set 3 Set 4
Saron1 528 528 504 539
Saron2 610 610 574 610
Saron3 703 703 688 703
Saron5 797 762 792 799
Saron6 915 922 879 926
to detect the statistical independence between signals of gamelan instruments not only in time domain but also in frequency domain from Demung, Saron, and Peking signals using LSIT.
RESEARCH METHODS
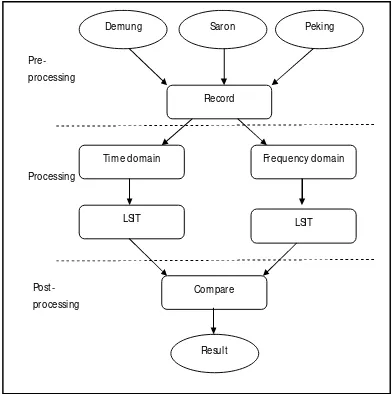
In this section we describe theories for independent test of gamelan instruments signal based on LSIT in time domain and frequency domain. The stages of the research are depicted in Figure 2.
Figure 2. The Stages of The Research
For pre-processing we recorded gamelan instruments from a gamelan sets that consist of Demung, Saron, and Peking. In processing, there are two parts, which are
Demung Saron Peking
Record
Frequency domain Time domain
LSIT LSIT
Compare
Result
Pre-processing
Processing
independence test using LSIT in time domain and frequency domain. The last is comparing the value of SMI to get the performance of the method.
Time Domain
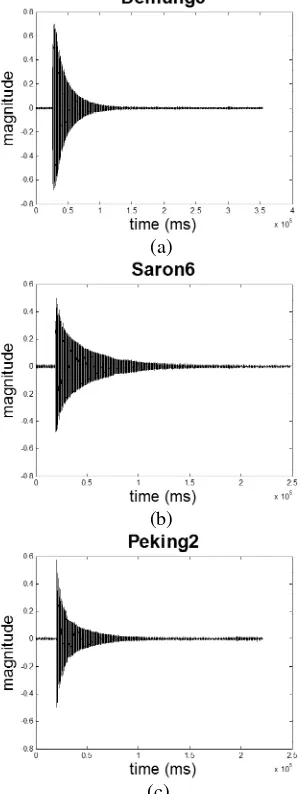
Signal can be represented through the spectral representation. The most common way is in the form of gray scale image which represents the magnitude value at any given time. The higher value of magnitude is the higher deviation of wave at that time. Figure 3 represents signals of gamelan instruments in time domain. The appearance of each signal in time domain is looks similar to each other.
(a)
(b)
(c)
Figure 3. Gamelan Signals in Time Domain
Frequency Domain
One way to transform the signal from time domain to frequency domain is using the Discrete Fourier Transform (DFT) [9]. DFT can be expressed in Equation (1).
1 , , 2 , 1 , 0 , 0
N k
W x X
n
kn N n
k (1)
where
N j N e
W jN
N
2 sin 2
cos 2
with
1
j and N is number of data.
Figure 4 represents signals from Figure 3. In frequency domain using Equation (1).
(a)
(b)
(c)
The advantage of using frequency domain is the number of sample lower than time domain, but the data is in complex number.
Definition of Independence
and y are said to be independent if and only if the joint pdf of x and y can be factored in Eq.Computing Equation (2) directly from data is a hard task, so we need a method to estimate the independence of signals. In this paper we use least-square.
Least-Squares Independence Test
Least-Square is a statistical method that can be used to determine the relationship or correlation between the two variables using the regression equation. Least-Squares Independence Test (LSIT) is an independence test based on the Squared-Loss Mutual Information (SMI) and the estimation of Least-Squares Mutual Information (LSMI) [6]. SMI is defined in Equation (3). For unknown, approximate the density ratio using Equation (5).
RESULT AND DISCUSSION
Our data in this research are instrument signals of Demung, Saron, and Peking that are recorded form Gamelan Elektro Budoyo from Department of Electrical Engineering, Institut Teknologi Sepuluh Nopember, Surabaya (ITS). The gamelan was held on an open stage, so we assume that the recorded signals have no echoes and free from noise.
There are two tuning system in gamelan: Pelog and Slendro. In Slendro tuning system every instrument of Balungan has five tones: 1 ('Ji'), 2 ('Ro'), 3 ('Lu'), 5 ('Mo'), and 6 ('Nem'). In our experiments we use pattern [abrreviation instrument][tone number], e.g., ‘d3’ means signal of Demung tone 3 (‘Lu’), ‘s6’ means signal of Saron tone 6 (‘Nem’), and ‘p2’ means signal of Peking tone 2 (‘Ro’).
The fundamental frequency range of Demung, Saron, and Peking is about 250
Figure 5. The Stability of SMI from Demung tone 2 and Peking tone 2
Table 2. The value of SMI from Demung, Saron, and Peking Signals
Signals Time domian Frequency domain Different Same Different Same Mean 0.06316 2.06291 0.28954 10.16853 Min 0.00001 1.36881 0.03826 4.68128 Max 0.23663 3.59578 0.77557 20.46387
For example, Figure 5. indicates the stability of SMI value from Demung2 and Peking2 in time-domain and frequency-domain.
The value of SMI in time domain is lower than in frequency domain. But the varian of time domain is higher than frequency domain.
However, the all value of SMI indicated that the signal pair of Demung tone 2 (d2) and Peking tone 2 (p2) is mutually independent.
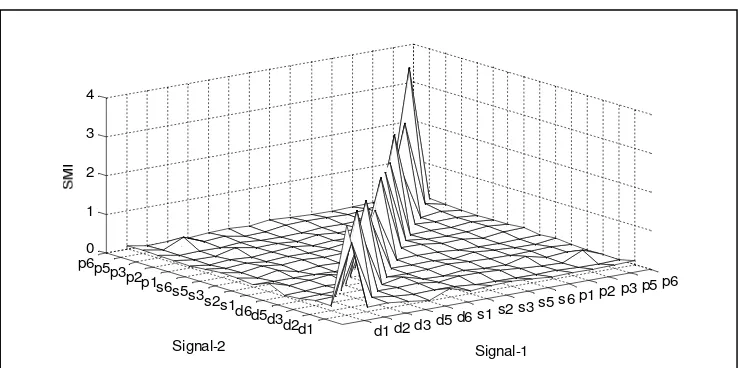
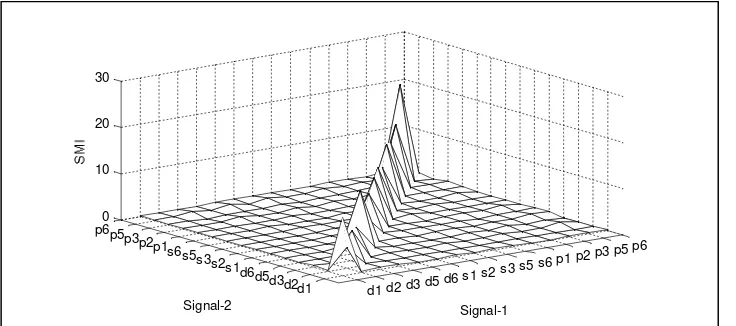
Further more we test independence between two signals of Demung, Saron and Peking in time domain and frequency domain as shown in Figure 6 and Figure 7.
Figure 6 shows the value of SMI in time domain based on Table 3 while Figure 7 shows the value of SMI in frequency domain based on Table 4.
The value of SMI in time domain and frequency domain from different signals proves that they are independent statistically. While signal with itself that dependent definitely (grey-shading in the table) has value of SMI more than 1.
The Table 2. shows the value of SMI in time domain is lower than in frequency domain. This may be due to the influence of FFT where not all of the results in the frequency domain transformations used but only just covering the fundamental frequency.
CONCLUSION
We could test the independence between two signals of Balungan group in time domain and frequency domain using LSIT. The value of SMI in time domain usually lower than that in frequency domain.
In future works, it should be detected the independence of gamelan instruments signals that have same fundamental frequency like Saron and Bonang. The experiment not only be conducted on various kind of instruments but also in other gamelan sets.
Figure 6. The Value of SMI in Time Domain
0 20 40 60 80 100
0 0.05 0.1 0.15 0.2 0.25 0.3
Pair of d2-p2
Frequency domain Time domain
d1 d2 d3d5 d6
s1 s2s3 s5
s6 p1p2 p3 p5 p6
d1 d2 d3 d5 d6 s1 s2 s3 s5 s6 p1 p2 p3 p5 p6
0 1 2 3 4
Figure 7. The Value of SMI in Frequency Domain.
ACKNOWLEDGEMENTS
This research was supported by Post Graduate Programme Scholarship (BPPS)
from Indonesian Ministry of Education and Culture.
REFERENCES
[1] S.M. Kay, Fundamental of Statistical Signal Processing: Estimation Theory, New Jersey : Prentice-Hall International Editions, 1993.
[2] K.C. Chiu, Z.Y. Liu, and L. Xu, “A statistical Approach to Testing Mutual Independence of ICA Recovered Sources,” in Proceedings of 4th International Symposium on Independent Component Analysis and Blind Signal Separation (ICA), Nara, 2003.
[3] A.T. Ihler, J.W. Fisher, and A.S. Willsky, “Nonparametric Hypotesis Tests for Statistical Dependency,” IEEE Transaction on Signal Processing, vol. 54, no. 10, pp. 766-779, 2006.
[4] C.J. Ku and T.L. Fine, “A Bayesian Independence Test for Small Datasets,” Transaction on Signal Processing, vol. 54, no. 10, pp. 4026-4031, 2006.
[5] T. G. Geenens and L. Simar, “Nonparametric Test for Conditional Independence in two-way contingency tables,” Journal of Multivariate Analysis, vol. 101, no. 4, pp. 765–788, 2010.
[6] M. Sugiyama and T. Suzuki, “Least-Square Independence Test,” IEICE Transactions on Information and Systems, vol. E94-D, no. 6, pp. 1333– 1336. 2011.
[7] A . Wintarti dan Y.K. Suprapto, “Deteksi Non-Gaussian pada Sinyal Gamelan untuk Independent Component Analysis (ICA) ,” in Proceedings of 13th Seminar on Intelligent Technology and Its Application,Surabaya, 2012.
[8] A. Wintarti, A. Tjahjanto, Y. Triwidyastuti, and Y.K. Suprapto, “Independence Detection of Gamelan Signals Using Least Square for ICA,” in Proceedings of 3rd MICEEI, Makassar, 2012.
[9] A.V. Oppenheim and A.S. Willsky, Signals and Systems, Prentice Hall, 1983 (Transl. : in N.R. Poespawati dan A.S. Tamsir, Sinyal dan System, Jakarta : Erlangga, 1997).
[10] Y.K. Suprapto, “Ekstraksi Suara Saron Berbasis Time-Frequency Model Menggunakan Filter Multidimensi,” Ph.D. Dissertation, ITS, Surabaya, 2010. d1 d2 d3d5 d6
s1 s2 s3s5 s6
p1 p2 p3p5 p6
d1 d2 d3 d5 d6 s1 s2 s3 s5 s6 p1 p2 p3 p5 p60 10 20 30