IJNMT, Vol. IV, No. 1 | June 2017 59
Implementation of Sales Executive Dashboard
for A Multistore Company in Yogyakarta
Halim Budi Santoso
1, Priyanka Ayu Sonia Putri
2, Budi Sutedjo Dharma Oetomo
21
Department of Information System, Faculty of Information Technology, Duta Wacana Christian University [email protected]
2 Department of Information System, Faculty of Information Technology, Duta Wacana Christian University
[email protected] Accepted on May 30th, 2017 Approved on June 14th, 2017
Abstract— Information Technology is a part of strategic
part for enterprise strategic planning. Information Technology can help the enterprise to determine its strategic planning. Through data from the past, the company can learn something and help to decide some strategic issue. A Multistore Company in Yogyakarta has more than five stores. The problem raises to generate real-time sales reporting. Sales manager and owner do not have access to real-time sales condition.
To ease management analyzing and reporting sales condition, dimension model of the sales data needs to be built. This dimension model will help to make executive report from some dimensions mentioned in data warehouse. Sales data will pass through some processes: Extract, Transform, and Load (ETL) in order to prepare the data warehouse. This process is pre-processing data before dimensional model is built. In this research multi-dimensional modelling by taking data from 3 stores ranging from 1 February 2014 to 31 January 2015.
By implementing sales executive dashboard, it helps to monitor and analyze sales condition. Dashboard shows graphic which ease user, especially sales manager and owner to learn current and updated sales condition based on dimensions: time, outlet / store, and product. Report gives detail information and multidimensional helps to analyze data from different perspective.
Index Terms—Dashboard, Multi Dimentional Model,
ETL, Executive Reporting
I. INTRODUCTION
Development of Information Technology has been switched from operational to strategical issue. Information Technology helps company to make better decision by providing data analysis. Management takes benefits from this strategic information technology. One of the issues of strategic information technology is Business Intelligence. Business Intelligence brings a new horizon for company and bring real-time processing and analyzing data. Business Intelligence brings data processing into one step ahead. Business Intelligence providing information from the enterprise data.
Processing data from database needs three processes: extract, transform, and load (ETL). These three processes combine data from different and many data sources. It pull these data and store it into another database, which is called a data warehouse. Data Warehouse is built by using multidimensional model. Multidimensional model contains fact as a subject analysis and dimensions as perspectives to analyze the fact. This multidimensional model will be a baseline to build dashboard reporting.
Report visualization is a process to bring enterprise data into a meaningful information fast and easy to understand [1]. This visualization is called dashboard. Dashboard is a visualization result for data processing and has a purpose to be used for company’s executive or manager (stakeholder) to measure company performance real time [1]. A system in the dashboard can handle and process big data and show it into short pages, show trends and information needed by company’s manager or executive. Dashboard also gives manager a responsive user interface comparing with traditional reporting. Dashboard also give more information comparing with traditional reporting [1]. Designing the dashboard will help management and executive to identify trend, pattern, and / or data anomaly. Dashboard also can be used to help data analysis.
A retail company in Yogyakarta with more than one store has obstacles for management to manage and monitor sales condition. Sales data from outlet only save in local computer. It raises a problem if management want to monitor real time sales reporting. It takes much time to analyze the sales condition and needs to take strategic decision.
60 IJNMT, Vol. IV, No. 1 | June 2017
multistore retail company; (2) How to implement dashboard to visualize transaction data and bring information to management. In order to solve the research questions, researchers took data from 3 outlets as samples ranging from 1 February 2014 to 31 January 2015.
II. LITERATURE REVIEW
A. Data Warehouse and Dimensional Model
Data warehouse system were conceived to support decision making within organizations. These systems homogenize and integrate data of organizations in a huge repository of data in order to exploit this single and detailed representation of the organization’s decision making [2]. Data warehouse is a system to extract, clean, transform, and send data source into a dimensional model and support to implement query and analysis to support decision making [3].
Therefore, considering that the very survival of the organizations frequently depends on the correct management, security and confidentiality of information [4], and the extreme importance of the information that users can discover by using these kinds of applications, it is crucial to specify confidentiality measures in the MD modeling process, and enforce them [4].
The data warehouse is a huge repository of data that does not tell us much by itself; like in the operational databases, we need auxiliary tools to query and analyze data stored [5]. Without the appropriate exploitation tools, we will not be able to extract valuable knowledge of the organization from the data warehouse, and the whole system will fail in its aim of providing information for giving support to decision making.
The usage of data warehouse will bring a good analysis of data. It will bring a good information to the business user. This information will support to make decision. Although as a decision support, information security is also a serious requirement which must be carefully considered as a element in the development lifecycle, from requirement analysis to implementation and maintenance [6].
Building data warehouse, the data should follow these three steps: extract, transform, and Load [7]. Extract is the first step. In this step, data is extracted. In this step, what information will be retrieved is also defined. The purpose of this step is to take data from its source. The next step is transform. In data transformation, some processes can be done: (1) data filtering; (2) data modification; (3) calculate measure and other new values; (4) Generate surrogate key value; (5) Creating summary from data. The last step is load. In this phase, data is loaded into data warehouse. In this phase, loading time interval is also be released.
The multidimensional conceptual view of data is distinguished by the fact / dimension.
Multidimensional modelling is the process of the data modelling in the universe of discourse with the modelling structure to provide a multidimensional data model [8]. Multidimensional models categorize data, either as facts associated with numerical measure or as dimensions that characterize the facts and generally in plain text.
All multidimensional model contains fact and dimension tables with the variant of star schema or snowflake models. Fact is a term of the subject of analysis [2]. While, dimension shows different perspective or point of views where a subject can be analyzed from [2].
Multidimensional model is stored in a data structure called cube [2]. Cube can be generalized interpreted as a basic logical structure to describe multidimensional database. Cube operation is based on the most straight forward way to model multidimensional data. Each cube has a quantitative data that can be analyzed. This kind of data is called measures [2]
Building multidimensional model follows some phases / steps [5]: (1) Identify business process requirements; (2) Identify the grain; (3) Identify the dimensions; (4) Identify the facts; (5) Verify model; (6) Physical design considerations.
B. Business Intelligence
Business Intelligence is a term that covers data warehousing, data integration technology, query, report, and analysis tools [3]. Business intelligence gives business user independent access to information. One of the Business Intelligence implementation examples is implementation of Business Intelligence in multi-channel service delivery capability [9].
Business intelligence as IT application that helps organizations make decisions by using technology for reporting, data access, and also analytical applications [10]. Business Intelligence application also help to retrieve information that is hiding in database [10]. This hiding information are able to help worker formulate decisions by analyzing data [11]. A thorough formulation of business objectives and information technology must be established for an enterprise to obtain value from a BI implementation [12].
IJNMT, Vol. IV, No. 1 | June 2017 61 III. RESEARCH METHODOLOGY
A. Building Data Warehouse
This research takes data from 3 stores ranging from 1 February 2014 to 31 January 2015. This data is used as a sample data. Researchers takes 3 stores as example. Those are: (1) Store at Jalan Magelang; (2) Store at Jl. KS Tubun (Kuncen); (3) Store at Jl. KS Tubun (MInang). To build the data warehouse, researchers adopt Johnson and Jones [7] methodology: (1) Data Extraction; (2) Data Transformation; (3) Data Loading.
1) Data Extraction (Extract)
Data from 3 stores are generated from different transaction detail data from this outlet. 2. Outlet in Kuncen
There are 6825 transaction data and 19019 transaction detail data from this outlet. 3. Outlet in Minang
There are 9521 transaction data and 31751 transaction detail data from this outlet. Researchers drop some unnecessary columns. Those columns are in the some tables:
1. Table M_Data_Harga_Jual
This table contains master data for product. In this table, columns for product code [Kode
Barang], product name [Nama Barang],
selling price [Harga Jual], and net selling price [Harga Net] is used. Other columns will be dropped since it is not needed in dashboard reporting. After the cleaning process, the table structure as shown in table 1 below:
TABLE I. TABLE STRUCTURE M_DATA_HARGA_JUAL
AFTER DELETE SOME COLUMNS have important information: Product id, product name, selling price, and net price.
The other columns are deleted since have null values or 0.
Pembayaran Float Yes
From table II, it is shown that there are 3 columns that have data about transaction number, transaction date, and total transaction. 3. Table Dt_Nota_D
This table contains detail transaction data. Columns which have null values or 0 will be deleted. The remaining columns can be seen in table III:
TABLE III. TABLE STRUCTURE DT_NOTA_D AFTER DELETE SOME COLUMNS
From the table III, it is shown that there are 7 columns are used in this table. These 7 columns have information of transaction number, product code, product name, quantity, price per item, gross total, net price.
2) Data Transformation
Transformation is a process where extracted raw data is filtered and coded. This transformation will change data into specific value or add new columns.
There are some transformation processes that are done:
62 IJNMT, Vol. IV, No. 1 | June 2017
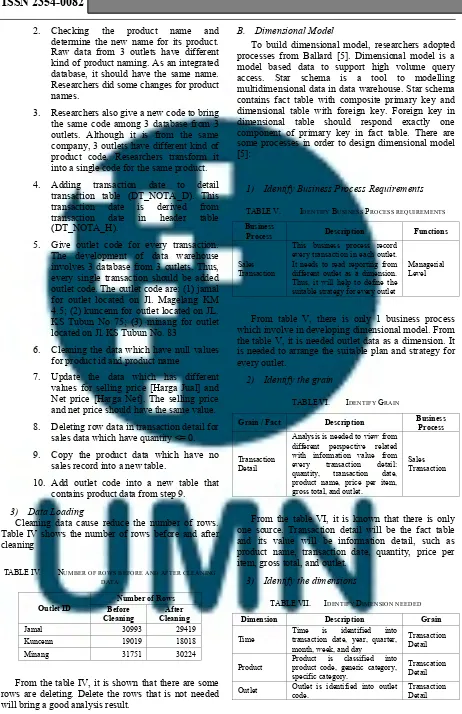
2. Checking the product name and determine the new name for its product. Raw data from 3 outlets have different kind of product naming. As an integrated database, it should have the same name. Researchers did some changes for product names.
3. Researchers also give a new code to bring the same code among 3 database from 3 outlets. Although it is from the same company, 3 outlets have different kind of product code. Researchers transform it into a single code for the same product. 4. Adding transaction date to detail
transaction table (DT_NOTA_D). This transaction date is derived from transaction date in header table (DT_NOTA_H).
5. Give outlet code for every transaction. The development of data warehouse involves 3 database from 3 outlets. Thus, every single transaction should be added outlet code. The outlet code are: (1) jamal for outlet located on Jl. Magelang KM 4.5; (2) kuncenn for outlet located on JL. KS Tubun No 75; (3) minang for outlet located on Jl. KS Tubun No. 83
6. Cleaning the data which have null values for product id and product name
7. Update the data which has different values for selling price [Harga Jual] and Net price [Harga Net]. The selling price and net price should have the same value. 8. Deleting row data in transaction detail for
sales data which have quantity <= 0. 9. Copy the product data which have no
sales record into a new table.
10. Add outlet code into a new table that contains product data from step 9.
3) Data Loading
Cleaning data cause reduce the number of rows. Table IV shows the number of rows before and after cleaning
TABLE IV. NUMBER OF ROWS BEFORE AND AFTER CLEANING DATA
From the table IV, it is shown that there are some rows are deleting. Delete the rows that is not needed will bring a good analysis result.
B. Dimensional Model
To build dimensional model, researchers adopted processes from Ballard [5]. Dimensional model is a model based data to support high volume query access. Star schema is a tool to modelling multidimensional data in data warehouse. Star schema contains fact table with composite primary key and dimensional table with foreign key. Foreign key in dimensional table should respond exactly one component of primary key in fact table. There are some processes in order to design dimensional model [5]:
1) Identify Business Process Requirements
TABLE V. IDENTIFY BUSINESS PROCESS REQUIREMENTS
Business
Process Description Functions
Sales Transaction
This business process record every transaction in each outlet. It needs to read reporting from different outlet as a dimension. Thus, it will help to define the suitable strategy for every outlet
Managerial Level
From table V, there is only 1 business process which involve in developing dimensional model. From the table V, it is needed outlet data as a dimension. It is needed to arrange the suitable plan and strategy for every outlet.
2) Identify the grain
TABLE VI. IDENTIFY GRAIN
Grain / Fact Description Business
Process
Transaction Detail
Analysis is needed to view from different perspective related with information value from every transaction detail: quantity, transaction date, product name, price per item, product name, transaction date, quantity, price per item, gross total, and outlet.
3) Identify the dimensions
TABLE VII. IDENTIFY DIMENSION NEEDED
Dimension Description Grain
Time
Time is identified into transaction date, year, quarter, month, week, and day
Transaction Detail
Product
IJNMT, Vol. IV, No. 1 | June 2017 63 From the table VII, it is shown that there are 3
dimensions are needed in dimensional model. Those are time, product, and outlet. Every dimension is categorized into subcategory.
4) Identify the Facts
TABLE VIII. IDENTIFY FACT TABLE
Fact Description Dimension
Transaction Detail
Fact table of Transaction Detail is a collection of information and analysis with dimensions. Fact table contains transaction code, product id, product name, Fact table (transaction detail) already contains data which is needed for analysis process.
5) Verify the model
In this process, model is verified and some columns are recalculated as a formula.
Fact table: Transaction Detail Model:
• SalesTotal = sum(detail_nota.Jumlah)
• GrossRevenueTotal =
sum(detail_nota.totalgross)
In this process, there are two columns as a model. SalesTotal is the sum of quantity of sold product. GrossRevenueTotal is the sum of total gross.
6) Physical Design Consideration
The last step is physical step, especially data sorting and searching through indexing. Data in data warehouse already sorted based on primary key.
Fig. 1. Dimensional Model (Detail)
From figure 1, it is shown that there are 1 fact table with 3 dimensions. It is based on the design step. As a fact table is transaction detail with 2 added columns: sales total and total revenue. These 2 columns will be facts.
Table IX shows the dimensional model. Dimension time is divided into: Days in Week, Week, Month, and Quarter. While product is divided into: Generic Category, Spesific Category (Sub Category), and Product ID. Outlet dimension only has one dimension, which is outlet ID. As facts in this dimensional model are: Sales Total (Total penjualan produk) dan Revenue Total (Total pendapatan).
TABLE IX. DIMENSIONAL MODEL
Time Product Outlet
Quarter Generic Category Outlet ID Month Spesific Category dimension table will be presented using graphics.
1. Line Chart will be used to present sales transaction trend from specific period. Line chart will help user to read the trend of the data
2. Bar Chart will be used to compare between sales conditions among specific time.
64 IJNMT, Vol. IV, No. 1 | June 2017
IV. IMPLEMENTATION AND ANALYSIS
A. System Implementation
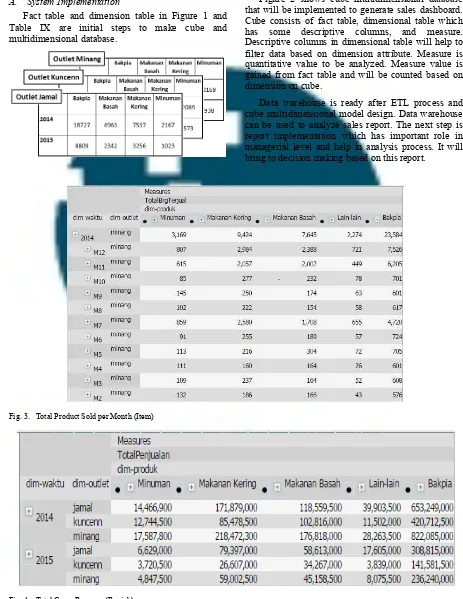
Fact table and dimension table in Figure 1 and Table IX are initial steps to make cube and multidimensional database.
Fig. 2. Cube Multidimensional Model
Figure 2 shows cube multidimensional database that will be implemented to generate sales dashboard. Cube consists of fact table, dimensional table which has some descriptive columns, and measure. Descriptive columns in dimensional table will help to filter data based on dimension attribute. Measure is quantitative value to be analyzed. Measure value is gained from fact table and will be counted based on dimension on cube.
Data warehouse is ready after ETL process and cube multidimensional model design. Data warehouse can be used to analyze sales report. The next step is report implementation which has important role in managerial level and help in analysis process. It will bring to decision making based on this report.
Fig. 3. Total Product Sold per Month (Item)
Fig. 4. Total Gross Revenue (Rupiah)
Figure 3 and 4 show the total product sold per month and total gross revenue. This report is generated based on dimensional model. Management is able to make and analyze sales report and gross revenue from
IJNMT, Vol. IV, No. 1 | June 2017 65
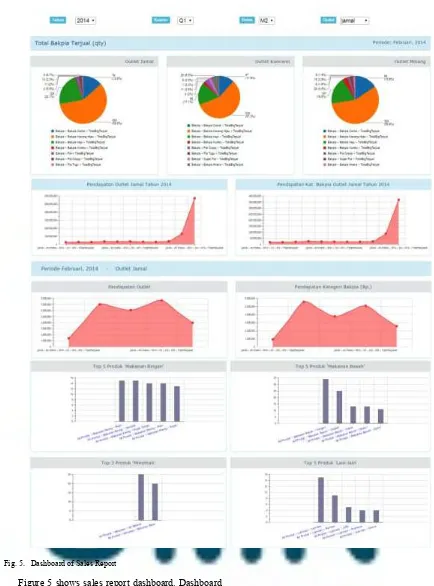
Fig. 5. Dashboard of Sales Report
Figure 5 shows sales report dashboard. Dashboard has feature to show graphics interactive based on chosen dimension value. Dashboard is also designed to capture information based on filter parameter. Filter parameter is defined based on dimension in cube.
B. System Analysis
66 IJNMT, Vol. IV, No. 1 | June 2017
management and operational [1]. Sales transaction data will be visualized into 3 dimensions: time, outlet,
and product. Using these 3 dimensions will help user to generate report based on its need.
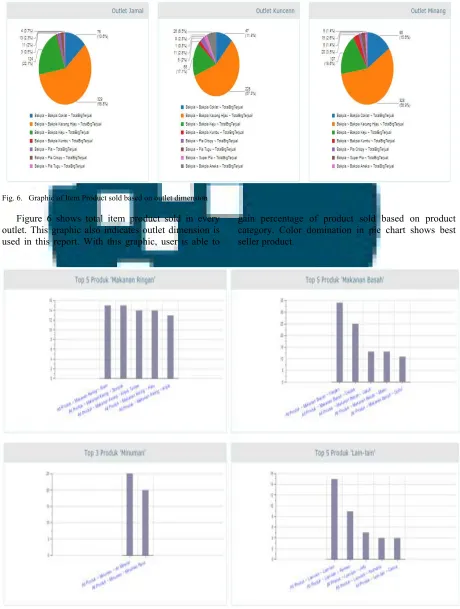
Fig. 6. Graphic of Item Product sold based on outlet dimension
Figure 6 shows total item product sold in every outlet. This graphic also indicates outlet dimension is used in this report. With this graphic, user is able to
gain percentage of product sold based on product category. Color domination in pie chart shows best seller product.
IJNMT, Vol. IV, No. 1 | June 2017 67 Figure 7 shows top 5 product. Bar chart shows top
5 product of generic category. Available generic category: Snacks, Food, Drinks / Beverages, and
Others. Diagram in figure 7 shows information of item product sold for specific period and outlet.
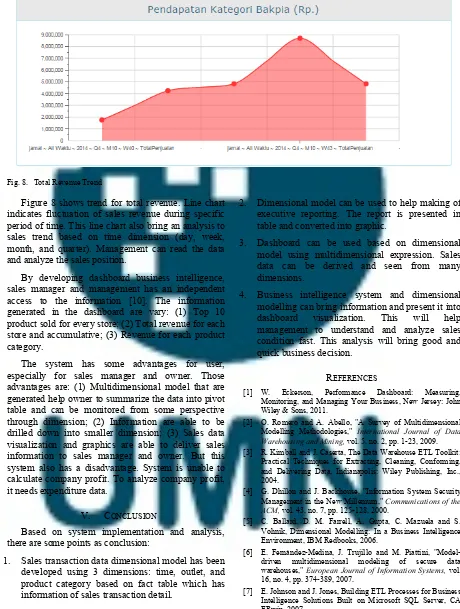
Fig. 8. Total Revenue Trend
Figure 8 shows trend for total revenue. Line chart indicates fluctuation of sales revenue during specific period of time. This line chart also bring an analysis to sales trend based on time dimension (day, week, month, and quarter). Management can read the data and analyze the sales position.
By developing dashboard business intelligence, sales manager and management has an independent access to the information [10]. The information generated in the dashboard are vary: (1) Top 10 product sold for every store; (2) Total revenue for each store and accumulative; (3) Revenue for each product category.
The system has some advantages for user, especially for sales manager and owner. Those advantages are: (1) Multidimensional model that are generated help owner to summarize the data into pivot table and can be monitored from some perspective through dimension; (2) Information are able to be drilled down into smaller dimension; (3) Sales data visualization and graphics are able to deliver sales information to sales manager and owner. But this system also has a disadvantage. System is unable to calculate company profit. To analyze company profit, it needs expenditure data.
V. CONCLUSION
Based on system implementation and analysis, there are some points as conclusion:
1. Sales transaction data dimensional model has been developed using 3 dimensions: time, outlet, and product category based on fact table which has information of sales transaction detail.
2. Dimensional model can be used to help making of executive reporting. The report is presented in table and converted into graphic.
3. Dashboard can be used based on dimensional model using multidimensional expression. Sales data can be derived and seen from many dimensions.
4. Business intelligence system and dimensional modelling can bring information and present it into dashboard visualization. This will help management to understand and analyze sales condition fast. This analysis will bring good and quick business decision.
REFERENCES
[1] W. Eckerson, Performance Dashboard: Measuring, Monitoring, and Managing Your Business, New Jersey: John Wiley & Sons, 2011.
[2] O. Romero and A. Abello, "A Survey of Multidimensional Modelling Methodologies," International Journal of Data Warehousing and Mining, vol. 5, no. 2, pp. 1-23, 2009. [3] R. Kimball and J. Caserta, The Data Warehouse ETL Toolkit:
Practical Techniques for Extracting, Cleaning, Conforming, and Delivering Data, Indianapolis: Wiley Publishing, Inc., 2004.
[4] G. Dhillon and J. Backhouse, "Information System Security Management in the New Millenium," Communications of the ACM, vol. 43, no. 7, pp. 125-128, 2000.
[5] C. Ballard, D. M. Farrell, A. Gupta, C. Mazuela and S. Vohnik, Dimensional Modelling: In a Business Intelligence Environment, IBM Redbooks, 2006.
[6] E. Fernández-Medina, J. Trujillo and M. Piattini, "Model-driven multidimensional modeling of secure data warehouses," European Journal of Information Systems, vol. 16, no. 4, pp. 374-389, 2007.
68 IJNMT, Vol. IV, No. 1 | June 2017
[8] J. Mylopoulos, L. Liu and M. T. Owen, "Database Design," in Ensyclopedia of Database System, United States, Springer, 2009, pp. 708 - 710.
[9] K. R. Gadda and S. Dey, "Business Intelligence for Public Sector Banks in India: A Case study. Design, Development, and Deployment," Journal of Finance, Accounting and Management, vol. 5, no. 2, pp. 37-58, 2014.
[10] D. J. Power, "DSS Resources," 6 June 2007. [Online]. Available: http://dssresources.com/. [Accessed 29 May 2017].
[11] D. Hedgebeth, "Data-driven decision making for the enterprise: an overview of business intelligence applications," The Journal of Information and Knowledge Management System, vol. 37, no. 4, pp. 414-420, 2007.
[12] S. Williams and N. Williams, The Profit Impact of Business Intelligence, San Fransisco: Elsevier, 2007.
[13] Imelda, "Business Intelligence," in Majalah Ilmiah Unikom, Bandung, UNIKOM, 2013, pp. 111-112.