Determination on Yellow Fin Tuna Stock (
Thunnus albacares
)
In South Java Sea Based on Genetic Variation by
Restriction Fragment Length Polymorphism (RFLP) Method
Feni Iranawati1), Lazimatun Nazifah2), Ledhyane Ika H.2), Syarifah Hikmah Julinda S., Diana Arfiati3) 1)Departement of Marine Science, Faculty of Fisheries & Marine Science, University of Brawijaya 2)Departement of Fisheries Resources Utilization, Faculty of Fisheries and Marine Science, University of
Brawijaya
3)Departement of Aquatic Resources Management, Faculty of Fisheries and Marine Science, University of Brawijaya
E-mail : [email protected]
ABSTRACT
Indonesia is known as a country with the highest potential production of tuna, however, Tuna fishery have several challenges, as can be identify by the declining in productivity and an average length fish had been caught, and also tuna fishing grounds are getting farther. This apparently appears as a result of inaccurate determination of fish stock especially in yellow fin tuna (YFT). This study aims to define population stocks of YFT in South Java Sea based on genetic information. Samples were taken from three fish landing ports (Muara Baru, Cilacap and Benoa). Restriction Fragment Length Polymorphism (RFLP) technique were applied for Cytochrome Oxidase I genes, using restriction enzymes; HaeIII, RsaI, BamHI, XhoI, and AluI. Genetic variation in populations were evaluated with POPGENE 32 software. Result indicate that finer scale of stocks present YFT and should be managed differently for effective management purpose and to maintain sustainability of this species.
Keyword: Cyrochrome oxidase, genes, popgene, RFLP, Tuna.
INTRODUCTION
Yellow Fin Tuna (Thunnus albacares) is oneof pelagic fish that own high demand by the export market widely. As highly commercial fish, there always increasing of Yellow Fin Tuna catching around the world including in Indonesia;s waters. Therefore, it
is necessary to manage sustainability of Yellow Fin Tuna resources. However, Sibagariang et al. (2011), in they study stated that the status of Yellow Fin Tuna fisheries in the waters of Cilacap, Central Java, Indonesia was in overfished condition (over fishing) with a utilization rate reached 85.12%. Basically utilization limits allowed byagreed Code of Conduct for Responsible Fisheries (CCRF) is approximately 80%.
Fisheries management may fail due to neglecting the importance of determination the status of the stock (management unit) of a species of fish (Hart and Reynolds, 2004). Inaccuracy in managing sustainable fisheries may cause the depletion of fish resources in their nature habitat. This occurrence has been observed recently that some fishery management in the world have fail to maintain the presence of fish resources in the wild (Beaumont et al., 2010). As a basis of fisheries management, determining of fish stock (management unit) is necessary to ascertain the future sustainability of fisheries (Welch et al., 2015)
been performed to determine stock of some fish populations. Generally, morphological approach or physical characteristics have been performed to determine stock of some fish populations. However, inability to assess gene flow of two or more individuals with morphological similarity is a weakness of this approach (De Queiroz and Gauthier, 1992). Thus, information of genetic structure will have significant consequences in determining management unit Yellow Fin Tuna (Thunnus albacares) in South of Java Sea.
One method can be used todetermine genetic structure of fish populations is Restriction Fragment Length Polymorphism (RFLP). Asmanik (2003) have been revealed the genetic variation and population structure of Metapenaeus monoceros shrimps from three populations (Jember, Tuban and Makassar) this method. Previous genetic study on Big Eye Tuna fish has been done by Nugraha and Barata (2011). They suggested that there was an admixture of two stocks of Big Eye Tuna fish in the Indian Ocean, that may indicate the potential admixture stock is present for yellow fin tuna in the same geographical area.
This study aims to determine the population structure of yellow fin tuna (Thunnus albacares) of three populations (Jakarta, Cilacap and Bali) in South Java Sea and to reveal whether the population being observed can be managed as a single unit management based on their genetic variation. This genetic information is important for management purposes and for conservation of tuna fisheries resources (Beaumont et al., 2010).
METHODS 1. Sampling Method.
Samples of yellow fin tuna fish were taken from three locations along the South
Java Sea. Fish were collected from fish especially Yellow Fin Tuna, the Indian Ocean become has significant contribution to industrial-scale of tuna fisheries in Indonesia. Samples were collected from fish market in each ports, twenties individual per sites. Tissue samples (caudal fin or muscle) were taken using appropriate protocols. Tissue samples stored alcohol 96% in labeled vials and were kept in refrigerator temperature at -80oC for further genetic analysis. Sampling locations of Yellow Fin Tuna is presented in Figure 1.
2. DNA Extraction
Figure 1. Sampling Sites Location.
3. Polymorphism Chain Reaction (PCR).
PCR primer used for DNA amplification is universal primer Fish-BCH (5’ -TCAACYAATCAYAAAGATATYGGCAC-3’) and Fish-BCL (5’-ACTTCYGGGTGRCCRAARAATCA3’) to amplify 700 bp of COI (Cytochore Oxidase I) gene of mitochondrial DNA (Baldwin et.al., 2008). The COI were selected because previous genetic study in tuna was successfully amplified this gene (Chiang et.al, 2008). PCR Amplification was performed in a total of 12 µl PCR volume contained of be 5 µl Dream Taq master mixed, 1 µl of forward primer (FBCH), 1 µl of reverse primer (FBCL), 1 µl of ddH2O and 4 µl of DNA template. PCR condition were initial denaturation at 95oC for 5 minutes, proceeded by 30 cycles comprising 1 minutes denaturation at 95oC, 1 minutes annealing at 55oC and 1 minutes elongation at 72oC. Success of PCR amplification was confirmed in a 150% agarose gel with 1x TBE (Trish buffer EDTA) and run for 120 minutes at 50 Volts and subsequently visualized under UV light.
4. Restriction Fragment Length Polymorphism (RFLP).
Single Band obtained from mtDNA PCR were cut with four types of restriction enzyme which are HaeIII, RsaI, BamHI, XhoI, and AluI (Lin et.al., 2005; Kunal et.al., 2015). RFLP was performed in a total mixture volume of 32 µl contained of 10 µl of products PCR, 18 µl of ddH2O, 2 µl of 10X buffer and 2 µl of enzymes restriction. The mixture was incubated in
incubator for 150 minutes at 37oC. Restriction result was confirmed in a 1.5% agarose gel in 1x TBE (Trish buffer EDTA) and run for 120 minutes at 50 Volts, with control was uncut of PCR products and subsequently visualized under UV light.
5. Data Analysis.
The target amplification product (COI gene) that has been cut with restriction enzymes then be coded or scored based on the presence or absence of restriction sites. Chow (1998) suggests that a single gene locus of amplification can be used to infer the number of alleles at each restriction enzyme profiles. Fragment that has no restriction site (uncut) can be confirmed as an A allele, while having one site can be confirmed as B alleles and so on (Ciftci and Okumus, 2002). Scored data used to calculate the population genetic structure of yellow fin tuna fish was performed by software popgene32 (Yeh et.al., 1999).
RESULT AND DISCUSSION 1. mtDNA Amplification
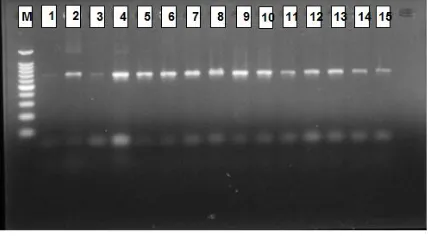
mtDNA COI amplification applied Fish BCL and Fish BCH primer at 50oC annealing temperature generated single band (780 bp) for all samples as shown in Figure 2. The results of PCR showed that some of smear bands were appeared on sample 1, 3, and 15. This might be influenced by limited concentration of DNA templates (Tumanduk, 2014).
The RFLP results performed that restriction enzyme Haelll, Alul, and Rsal succesfully cut COI gene of mtDNA, while BamHI and XhoI could not recognized the restriction sites of COI gene. The results also showed that the polymorphic pattern was only identified by Rsal enzyme, while two other enzymes (Haelll and Alul) had a monomorphic pattern. Below are shown restriction pattern of Rsal enzyme (Figure 3).
Figure 3. Restriction results of COI gene by Rsal enzyme (M: marker DNA ladder 100 bp; 1-5: samples from Jakarta; 6-10: samples from Cilacap; 11 -15: samples from Bali).
This figure illustrated that Rsal enzyme had two to three polymorphic patterns on 705 bp, 676 bp, and 165 bp. The restriction patterns on sample 1, 2, 4, 6, 8, 13, and 15 were characterized as allele B while sample 3, 5, 7, 9, 10, 12, and 14 were confirmed as allele C and only one sample (sample 11) was identified as allele D (Çiftci and Okumuş, 2002). The further analysis applied POPGEN software version 1.32 to asses several population parameters.
2. Population structure of Thunnus albacares.
Several genetic parameters were taken into account to assess the population structure of Thunnus albacaresin Southern Java Sea. They were allele frequency, heterozygocity, and F-statistic (Fst, Fis dan Fit) and genetic distance. Allele frequency is a proportion of each allele appeared in a population, which is shown in Table 1.
Table 1. Allele frequency of Thunnus albacares in five locus.
Allele Locus
HaeIII RsaI BamHI XhoI AluI
A 1.00 1.00 1.00
B 1.00 0.467
C 0.467
D 0.07
According to Çiftci dan Okumuş, (2002) a polimorphic locus is a locus with allele frequency less than 0.99. Therefore, Rsal enzyme was appropriate as a genetic marker than other enzymes (HaeIII, BamHI, XhoI, and AluI) since it can detect polymorphism in Thunnus albacares. The average heterozygocity of Thunnus albacares from all loci was 0.1067 which indicated that all population observed (Jakarta, Cilacap and Bali) had a closed genetic distance. The low value of heterozygocity might be caused by inbreeding in population of Thunnus albacares in South Java Sea (Mulliadi and Arifin, 2010).
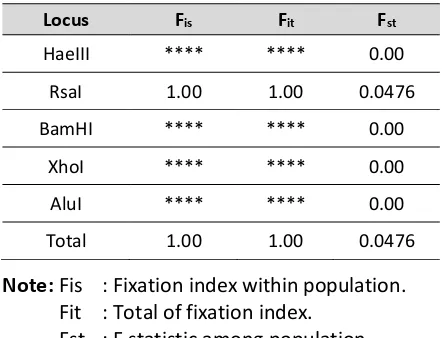
Below is F-statistic of Thunnus albacares from all loci.
Table 2. F-statisticof Thunnus albacares
Locus Fis Fit Fst
HaeIII **** **** 0.00
RsaI 1.00 1.00 0.0476
BamHI **** **** 0.00
XhoI **** **** 0.00
AluI **** **** 0.00
Total 1.00 1.00 0.0476
Note: Fis : Fixation index within population. Fit : Total of fixation index.
Fst : F statistic among population.
that the Fst of Thunnus albacares in three observed populations was 0.0476. This indicated high levels of gene flow are present in YFT that minimize the differentiation between population and the populations can be assumed as single unit management (Hellberg, 2009).
Fixation indexes (Fis and Fit) are determined by the total observed heterozygocity (Hobs) and expected heterozygocity (Hexp) following Hardy Weinberg equilibrium. In this study, the Fis was about 1.00 which indicated that there was a limited heterozygocity in the observed populations Holsinger dan Weir (2009). The Fit indicated that alelle distribution is not equal for all populationn. As a consequence, the low genetic variation of Thunnus albacares in South Java Sea might diminish adaptation ability of this species to environmental changes (Çiftci dan Okumuş, 2002).
Regarding the population structure estimation, the genetic distance value of Thunnus albacares landed in Jakarta and those in Cilacap was about 0.0075. This value is higher than the genetic distance value of Thunnus albacares landed Jakarta and Bali which was only 0.0073. This indicated that Thunnus albacares landed in Jakarta has a closer relationship to those landed in Bali than those landed in Cilacap.
Generally, the genetic distance value of Thunnus albacares landed in the observed locations is lower than those in western Pacific Ocean and western Indian Ocean which was 0.423 Wu et.al. (2010). This implied that the observed populations might be originally from the same genetic pool.
The genetic distance of Thunnus albacares in South Java Sea (landed in Jakarta, Cilacap, and Bali) are performed in Table 3.
Table 3. The genetic distance of Thunnus albacores in South Java Sea.
Population Jakarta Cilacap Bali
Jakarta -
Cilacap 0.0075 -
Bali 0.0073 0.0073 -
From table 3 population structures were clustered by population tree applied Unweighted Pair Group Method with Arithmetic Mean (UPGMA). Even though the genetic difference of Thunnus albacares landed in Jakarta – Cilacap (0.0075) and those landed in Jakarta – Bali (0.0073) is relatively low, it might be possible to classify those as two different management unit (Figure 4). The first management unit is Thunnus albacares landed in Jakarta and Bali, while the second one is those landed in Cilacap.
However, genetic analysis using nuclear DNA might produce different results. This analysis will perform genetic characteristic inherited from both male and female parents, while the mtDNA analysis will only expose maternal inheritance. Previous research by Palumbi dan Baker (1994), showed that both analysis gave different results of population structure of Megaptera novaengliae in North Atlantic, Antartic Ocean, Hawai, Alaska, California, and Mexico.
Figure 4. Genetic Distance of Thunnus albacares.
3. The environmental variability towards genetic variation of Thunnus albacares.
Thunnus albacores landed in Jakarta and Cilacap is relatively closer (519 km) compared to those landed in Bali (1080 km). This indicated that Thunnus albacares landed in Jakarta and Bali have a close genetic distance.
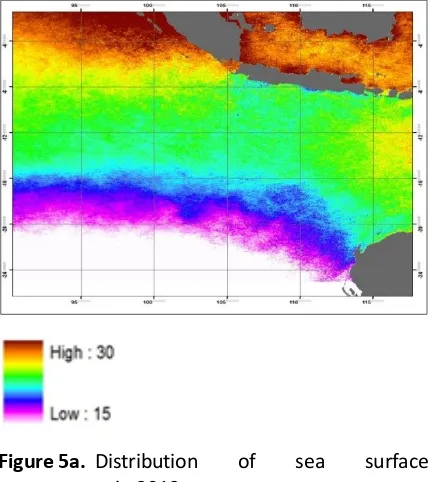
Sea surface temperature highly influence tuna distribution since temperature will directly affect water mass along with nutrient transportation (Sukresno et.al., 2015). According to Holland (1990), as a pelagic species, Thunnus albacares tend to swim in sea surface (at depth 50-90 m). Therefore, the difference of sea surface temperature can produce several genetic structures in the observed populations.
Regarding environmental variability such as distribution of sea surface temperature and klorofil-a (Figure 5), distribution of Thunnus albacares in Jakarta and Bali has some similarities. On the other hand, the environmental variabilities of Thunnus albacares fishing ground in Cilacap (around Central Java Province) changed more rapidly than those in Jakarta and Bali.
Figure 5a. Distribution of sea surface temperature in 2012.
Figure 5b. Distribution of Chlorophyl-a in Indian Ocean 2011 (Ghafiky, 2016).
Genetic similarity of Thunnus albacares landed in Jakarta and Bali might possibly happen since their fishing grounds have similar environmental condition (Ghafiky, 2016). Regarding sea surface temperature condition, it has fluctuated more rapidly in Cilacap than those in Jakarta and Bali. In addition, distribution of klorofil-a in the observed areas were slightly different where the distribution of this nutrient in Jakarta and Bali than those in Cilacap. This might be caused by the existence of estuaries around fishing ground of Thunnus albacares in Jakarta and Bali which transport nutrients. Environmental changes results in local adaptation of population that genetically generate some differences compared to other populations.
close geographical locations. Therefore, it might be possible if Thunnus albacares landed in Cilacap which is geographically close to those in Jakarta determined as two different management units.
The results of genetic variation successfully performed population structure of Thunnus albacares landed in the observed populations (Jakarta, Cilacap, and Bali). This will be applied to manage the tunas fisheries in those locations. As stated by Carvalho and Hauser (1994) and Beaumont et.al. (2010), genetic information of a management unit will be beneficial for making fishery policies.
However, for fisheries management purposes, Thunnus albacares landed in Jakarta and Bali which classified as one management unit, it would be better if the stock managements are performed separately. It is because geographically and administratively, those populations are impracticable to be combined. Therefore, the fisheries management of Thunnus albacares landed in the observed areas determined as three different management units and their managements will be adapted to each area. If those Thunnus albacares populations suffer of overfishing in either Jakarta or Bali, those will respectively do restocking.
CONCLUSION AND SUGGESTION
1. The average of heterozigocity value of Thunnus albacares landed in Jakarta, Cilacap, and Bali is 0.1067 (inbreeding). The genetic distance value of Thunnus albacares landed in Jakarta-Bali (0.0073) is lower than those in either Jakarta-Cilacap or Bali-Cilacap (0.0075).
2. Based on genetic distances, it was determined that Thunnus albacares landed in Jakarta and Bali defined as a management unit, while those in Cilacap marked as a different management unit.
REFFERENCES
Akbar, N., Zamani, N.P., Madduppa, H. H., 2014. Keragaman Genetik Ikan Tuna Sirip Kuning (Thunnus albacares) dari Dua Populasi di Laut Maluku, Indonesia. DEPIK 3. doi: 10.13170/depik.3.1.1304
Asmanik, 2003. Variasi Genetik Udang Api-Api (Metapenaeus monoceros. Fab) di Perairan Jawa Timur (Jember dan Tuban) dan Sulawesi Selatan (Selat Makasar) Melalui Analisis Restriction Fragment Length Polymorphism (RFLP) pada Mitokondrial DNA. Universitas Brawijaya, Malang.
Baldwin C.C., Mounts J.H., Smith DG, Weigt LA. 2009. Genetic identification and color descriptions of early life-history stages of Belizean Phaeoptyxand Astrapogon (Teleostei: Apogonidae) with comments on identification of adult Phaeoptyx. Zootaxa 2008: 1–22. Beaumont, A.R., Boudry, P., Hoare, K., 2010.
Biotechnology and Genetics in Fisheries and Aquaculture, 2nd ed. Blackwell, Chichester; Ames, Iowa. Carvalho, G.R., Hauser, L., 1994. Molecular Fisheries Science, 64 (4): 999-1000. Çiftci, Y., Okumuş, İ., 2002. Fish Population
Genetics and Applications of Molecular Markers to Fisheries and Aquaculture: I- Basic Principles of Fish Population Genetics. Turk. J. Fish. Aquat. Sci. 2.
catalogue. United Nations Development Programme: Food and Agriculture Organization of the United Nations, Rome.
Coyle, T., 1998. Stock Identification and Fisheries Management: The Importance of Using Several Methods in A Stock Identification Study [WWW
Document]. URL: Fatchiyah, Arumningtyas, E.L., Widyarti, S.,
Rahayu, S., 2011. Biologi Molekular. Erlangga.
Gaffiky, M.F. 2016. Variasi Faktor Oseanografi Daerah Penangkapan Big Eye Tuna (Thunnus obessus di Samudera Hindia Bagian Barat. Universitas Brawijaya. Skripsi (Tidak dipublikasikan).
Handoyo, D., Rudiretna, A., 2000. Prinsip Umum dan Pelaksanaan Polymerase Chain Reaction (PCR) [General Principles and Implementation of Polymerase Chain Reaction]. Unitas 9, 17-29.
Hart, P.J.B., Reynolds, J.D. (Eds.), 2004. Handbook of Fish Biology and Fisheries. Blackwell Pub, Malden, MA. Holsinger, K.E., Weir, B.S., 2009. Genetics in
Geographically Structured
Populations: Defining, Estimating and Interpreting Fst. Nat Rev Genet 10, 639-650. doi: 10.1038/nrg2611. Iranawati, F., 2014. An Assessment of A
Geographical Scale of Recurrent Gene Flow in Wild Populations of Two Species of Mekong River Carps (Henucorhyncus, spp). Queensland University and Technology, Australia.
ISSF, 2015. ISSF Tuna Stock Status Update - 2015 [WWW Document]. URL: Meena, R.M., 2013. Mitochondrial DNA Analysis Reveals Three Stocks of Yellowfin Tuna Thunnus albacares (Bonnaterre, 1788) in Indian Waters. Conserv. Genet. 14, 205-213. doi: 10.1007/s10592-013-0445-3
Lin, Wen-Feng, C. Y. Shiau, D.F. Hwang. 2005. Identification of Four Thunnus Tuna Species Using Mitochondrial Cytochrome b Gene Sequence and PCR-RFLP Analysis. Journal of Food and Drug Analysis. Volume XIII No 4 : 382-387.
Miazwir, 2012. Analisis Aspek Biologi ProduksiIkan Tuna Sirip Kunung (Thunnus albacares) yang Tertangkap di Samudera Hindia. Universitas Indonesia, Depok.
Mulliadi, D., Arifin, J., 2010. Pendugaan Keseimbangan Populasi dan Heterozigositas Menggunakan Pola Protein Albumin Darah pada Populasi Domba Ekor Tipis (Javanese Thin Tailed) di Daerah Indramayu (Prediction Equilibrium of Population Used Blood Albumin Pattern of Thin Tailed Sheep Pop. J. IlmuTernak 10. Nobel, A., 2000. Chelex® 100 and Chelex 20
Chelating Ion Exchange Resin
Instruction Manual [WWW
Document]. URL:
truction+Manual&btnG=&hl=en&as_s dt=0%2C5&sciodt=0%2C5&cites=http %3A%2F%2Fwww.bioone.org%2Fdoi %2Fabs%2F10.1643%2FCG-11-035&scipsc=# (accessed 2.19.16). Nugraha, B., Barata, D.N., 2011. Keragaman
Genetik Ikan Tuna Mata Besar
Perikanan Rawai Tuna di Benoa (Studi Kasus: Pt. Perikanan Nusantara) Technical Efficiency of Tuna Longline Fish [WWW Document]. URL:
Palumbi, S.R., Baker, C.S., 1994. Contrasting population structure from nuclear intron sequences and mtDNA of humpback whales. Mol. Biol. Evol. 11, 426-435.
Pavel, A.B., Vasile, C.I., 2012. Pyelph - A Software Tool for Gel Images Analysis
and Phylogenetics. BMC
Bioinformatics 13, 1–6. doi: 10.1186/1471-2105-13-9
Saitou, N., Nei, M., 1987. The Neighbor-Joining Method: A New Method for Reconstructing Phylogenetic Trees. Mol. Biol. Evol. 4.
Sibagariang, O., Fauziyah, F., Agustriani, F., 2011. Analisis Potensi Lestari
Sumberdaya Perikanan Tuna Longline di Kabupaten Cilacap, Jawa Tengah. Maspari J. 3, 24–29.
Sukresno, B., Hartoko, A., Sulistyo, B., Subiyanto, 2015. Empirical Cumulative Distribution Function (ECDF) Analysis of Thunnus.sp Using ARGO Float Sub-surface Multilayer Temperature Data in Indian Ocean South of Java. Procedia Environ. Sci., Basic Researches in The Tropical and Coastal Region Eco Developments 23, 358-367. doi: 10.1016/j.proenv.2015.01.052.
Toha, A.H.A., 2011. Ensiklopedia Biokimia & Biologi Molekuler. Penerbit Buku Kedokteran EGC.
Tumanduk, P.C.I., 2014. Deteksi Gen Natural Resistance Associated Macrophage Protein-1 (Nramp-1) dengan Metode Polymerase Chain Reaction (PCR) Dari Ekstrak Saliva.
Walsh, P. Sean, D. A. Metzger, R. Higuchi. 1991. Chelex 100 as a Medium for Simple Extraction of DNA for PCR-Based Typing from Forensic Material. Biotechniques. Volume LIV No 3: 134-139.
Welch, D.J., Newman, S.J., Buckworth, R.C., Ovenden, J.R., Broderick, D., Lester, R.J.G., Gribble, N.A., Ballagh, A.C., Charters, R.A., Stapley, J., Street, R., Garrett, R.N., Begg, G.A., 2015. Integrating Different Approaches in The Definition of Biological Stocks: A Northern Australian Multi-Jurisdictional Fisheries Example Using Grey Mackerel, Scomberomorus Semifasciatus. Mar. Policy 55, 73–80. doi: 10.1016/j.marpol.2015.01.010. Williams, M.N.V., Pande, N., Nair, S., Mohan,
of Rice (Oryza Sativa L.) Genomic DNA. Theor. Appl. Genet. 82, 489–498. doi:10.1007/BF00588604
Wu, G.C.-C., Chiang, H.-C., Chou, Y.-W., Wong, Z.-R., Hsu, C.-C., Chen, C.-Y., Yang, H.-Y., 2010. Phylogeography of Yellowfin Tuna (Thunnus albacares) in The Western Pacific and The Western Indian Oceans Inferred from Mitochondrial DNA. Fish. Res. 105,
248–253. doi:
10.1016/j.fishres.2010.03.015
Yeh F.C., Yang R.C., and Boyle T. 1999. POPGENE version 1.31: Microsoft Window-based Freeware for
Population Genetic Analysis. Edmonton, AB. Canada: University of Alberta Canada.
Zudaire, I., Murua, H., Grandea, M., Bodin, N., 2013. Reproductive Biology of Yellowfin Tuna (Thunnus albacares) in The Western and Central Indian Ocean
[WWW Document]. URL:
http://webcache.googleusercontent.c om/search?q=cache:EfKwB19cPwgJ:io tc.org/sites/default/files/documents/ proceedings/2010/wptt/IOTC-2010-