The Effect of Corporate Social Responsibility on Cost of Equity and
Capital Constraint
An Empirical Analysis on Listed Manufacturing Companies in
Indonesia Stock Exchange Market
ABSTRACT
Purpose of this research is to find out the effect of Corporate Social Responsibility (CSR) on cost of equity and capital constraint, as well as the effect of the cost of equity itself to capital constraint. Subject of this research is the listed manufacturing companies in Indonesia Stock Exchange, and the objects are Corporate Social Responsibility as the exogenous variable that consist of stakeholder engagement and CSR Disclosure as proxy, and cost of equity as the endogenous variable as well as the capital constraint. Moreover, this research attempts to see the relationship effect of the exogenous variables towards the endogenous variables, and to test the position of the cost of equity variable as an intervener.
The research result proves that the first structural model with cost of equity as an intervening variable is not significant. Instead, second model which is the splitting of the first model is used to test the effect of CSR on cost of equity and capital constraint. CSR is proven has no significant relationship on cost of equity, nevertheless, it has significant relationship on capital constraint. Furthermore, the cost of equity itself has no significant relationship with capital constraint.
Keywords : corporate social responsibility, capital constraint, cost of equity, stakeholder engagement, disclosure
A. PRELIMINARY
1. Background
Concern from business people towards their environment has been a must when they plan to construct a business strategy. To be able to make a good strategic plan, business people and executives have to have broad knowledge about business environment and economics. One of many concepts that are growing fast in the current global business environment is the concept about Corporate Social Responsibility.
Corporate Social Responsibility (CSR) is a concept about company or entity to be able to behave ethically towards its inside and outside stakeholders, so they may give feedback contributions whether it is directly or indirectly to the company or entity. The stakeholders consist of: supplier, government, social community, surrounding environment, and many others. If CSR is well maintained, the company value may increase and provide better subsistence level for the surrounding people.
Nowadays, CSR is getting more concerned. People start to understand the importance of CSR because there are more and more scandals arise from various companies in the world, and some of them give huge effect to the going concern of the companies themselves. For example, the disaster that came from the gas explosion in Union Carbide, Bophal, India on December 3, 1984. This incident has caused many deaths for more than 15,000 people in the surrounding area. Another incident was the leaking pipes of BP oil exploration that also caused many deaths around the Mexican bay, United States. In Indonesia, one of the biggest environmental disasters is Lapindo Brantas case in Sidoarjo, east Java. There are still many other cases, and all of them give impact to the society and environment where in the end will give great losses to the
company more than the company’s overall benefit. From the finance side, disasters caused by a
company could increase the difficulty to obtain funds, lower profit, reduction in customers, and many others.
In these recent decades, CSR has been a warm conversation in many areas in the world. It is triggered by the understanding from many businessmen and executives about the importance of performing CSR for a company or entity. According to UN Global Compact – Accenture CEO Study (2010), 93% of the 766 participants, which consist of CEOs from all over the world, stated that CSR is an important factor and even very important for the company’s going concern in the future. Surveys done by Edelman to 5,000 customers, stated that 2/3 of the participants agree
with the importance of transparency and honest business to build company’s reputation.
In Indonesia, CSR implementation has become a topic that is often discussed among many businessmen and executives. The importance of CSR in Indonesia is proven with the endorsement of Indonesian corporate law no. 40, 2007. This law has been applied in many companies, especially the listed companies.
of time to make general reporting standards, and establishment of competent workforce, including an increase in the field of assurance.
Nevertheless, Indonesia is still trying to conduct more CSR implementation development and improvement from time to time, such as adopting the General Reporting Index (GRI) as a guide to make CSR reporting standard and corporate law in Indonesia. Moreover, many rewards from various CSR related organization (e.g: Indonesian Accounting Organization) keeps popping out to enhance the implementation of CSR in Indonesia.
According to the result of previous researches about CSR, CSR function is not merely to
maintain the company’s going concern, but there are also many other effects resulted from the
CSR implementation. Various researches conclude that CSR is a compulsory for every business entity. Even so, many also stated that CSR is not a compulsory and the portion depends on each entity. In order to gain more knowledge, researchers in the world are not stop for only searching
the relationship of CSR with company’s going concern and profitability, but they also started to
find more and more knowledge, such as trying to find out about the effects of CSR toward certain aspects, especially those with important role in a company or entity (e.g: value creation, sustainable growth, investment, cost of capital, etc).
Investment aspect is very important because it could affect company’s performance and
growth. To do the investment, company needs funds. Normally, capital constraint is caused by
the lack of profit resulted from the company’s inefficiency. Importance of the availability of
funds for a company or entity made some researchers conducting a study to find out the relationship between CSR and access to finance. They also try to search for the effect of CSR to cost of equity which also affected the capital constraint. In order to develop the existing researches, this research is done to find a more advanced knowledge about THE EFFECT OF CORPORATE SOCIAL RESPONSIBILITY ON COST OF EQUITY AND CAPITAL CONSTRAINT.
2. Research Problems
The scope of this research is about finding the effect of Corporate Social Responsibility towards cost of equity and capital constraint, as well as the effect of cost of equity towards the capital constraint itself. In this research, CSR variable is divided into two sub variables, which are: stakeholders engagement and CSR disclosure. Stakeholders engagement is related with agency cost and CSR disclosure is related with asymmetry information. In detail, the problems in this research could be formulated as follows:
a. Does stakeholders engagement affect cost of equity. b. Does CSR disclosure affect cost of equity.
c. Does stakeholders engagement and CSR disclosure affect cost of equity simultaneously. d. Does stakeholders engagement affect capital constraint.
e. Does CSR disclosure affect capital constraint. f. Does cost of equity affect capital constraint.
h. Does cost of equity mediate indirect relationship between stakeholders engagement and CSR disclosure toward capital constraint.
3. Research Purpose and Benefit
Purpose of this research is to know the effect of CSR from two sub variables (stakeholders engagement and CSR disclosure) toward the cost of equity and capital constraint which are parts of the access to finance, as well as the effect of the cost of equity towards the capital constraint itself.
This research is expected to bring benefit for science and practice development. Theoretical benefit from this research is to be a more advanced source for the academics and also people in this world, so they may have a new vision about CSR, especially for the management knowledge in Indonesia. Practical benefit from this research is to give more understanding to companies or entities in how they reduce their opportunity risk caused by the lack of funds to do investment. By doing CSR, the opportunity risk can be reduced.
B. LITERATURE REVIEW
1. Grand Theory
Barako, Hancock, and Izan (2006) disclosed that the main issue of agency relationship in a company is about asymmetry information between the management and shareholders. Management has more superior information than the shareholders which led to the emergence of dilemma for the shareholders because they cannot be fast enough to evaluate and determine the value from the decision making done by the management. Segregation between management and shareholders, and the need to reduce asymmetry information and agency cost have been the main concern for a good reporting (Jaffar, Jamaluddin, and Rahman, 2007). A good reporting practice is not only limited in disclosing financial information, because the non-financial information are also useful for the decision making (Deegan and Rankin, 1997 in Jaffar, Jamaluddin, and Rahman, 2007).
Legitimacy theory provides a broader view about CSR disclosure. This theory states that a company or entity is bounded with social contract to do various social actions as a reward of
the agreement about company’s purpose. Deegan (2002) explained the focus of legitimacy
theory is social legitimacy that leads to the company’s income resulted from its social environment and external constituents. Braco and Rodrigues (2008) explained about the importance of social legitimacy from theoretical assumption that a company is part of its environment, and its performance and expectation are affected by the environment. The sustainability of a company depends on its interface.
Deegan (2002) explicitly explained the stakeholders theory by focusing on the effect of
various stakeholders’ hopes about how good CSR policies should be. In this theory, disclosure
supports for its business. One of many business supports that a company could get is the matter of simplicity to get financing sources from external.
2. Theory About Variables
a. Corporate Social Responsibility
Corporate Social Responsibility (CSR) has been one thing that become very important since Carson (1962) told the world about the environmental damage caused by deadly pesticide
gases. This statement has changed many people’s mind that corporate’s behavior should be fixed
prior to the mass destruction of the world (Carson, 2000).
John Elkington (1997) stated that a company should concern about 3P to be a sustainable
company. The 3P consists of: profit, people (stakeholders’ wealth), and planet (environmental
preservation). Chih Hung Chen (2011) also added that there are four main components of CSR, which are: accountability, transparency, competency, and responsibility. If a company has fulfilled these four components, that means the company has implemented a good CSR. Jones (1995) said that a company with good CSR performance must also have a good stakeholders engagement. Good CSR implementation is identic with strong stakeholders engagement that based on a belief to get mutual benefit.
Related to transparency that becomes one of the four main components of CSR, Dhaliwal et al (2011) in his new coming research stated that a company with a good CSR performance tends to disclose its CSR practices to the public. Based on many CSR theories, Beiting Cheng et al (2011) divided CSR variables into two sub variables which are: stakeholders engagement and CSR disclosure.
1). Stakehoders Engagement
According to Freeman (1984:46) in Sadorsky (1996), stakeholder is an individual or group of people that have an ability to affect or influence the common goal of an organization. Steiner and Steiners (2003) mentioned that stakeholder is a group of people whom feel the benefit and burden from company’s activities. Moreover, Ann (1998) in Word Business Council for Sustainable Development ( 2002) quoted by Budimanta from Indonesia Centre for Sustainable Development (ICSD) stated that stakeholder is an individual or group of people that could affect or influence corporate activities. Based on those statements, can be understood that
stakeholder is a picture of company’s relationship with its surroundings, individual, or a group of
people that have interest, affect, or influence toward the achievement of company’s common
goal.
2). CSR Disclosure
Henriksen and Van Breda (2000) stated that CSR disclosure is an explanation of financial report from the accounting process in the form of information to be used as accountability tool. Broader, CSR disclosure is a delivery of mandatory and voluntary financial information. Mathew (1997:483) defined CSR disclosure as a voluntary information disclosure qualitatively and quantitatively made by an organization to inform its activities. The quantitative disclosure consists of financial and non-financial information.
Full disclosure principle in disclosing financial report by providing the summary of financial transaction needs to be mentioned by a company. This is stated in the statement of Indonesian accounting standard called PSAK No. 1 paragraph 9 which is:
“A company may also provide additional reports such as a report about environment and value
added report, particularly for the industries where the environment have important role and also for the industries that assuming its employees as the report users has important role.”
b. Capital Constraint
Capital constraint is company’s constraint to get capital from the available sources of
funding to do investment (Riskin Hidayat, 2010:460). Capital constraint consists of: inability to owe, inability to issue stocks, dependency to bank’s loan, and illiquid assets (Lamont et al,
2001).
Mankiw (2009) said that marginal productivity of capital is one of many factors that affect investment. Sri Sofyaningsih (2011) stated that investment decision implementation is greatly affected by company’s availability of funds which could come from internal and external
financing. Companies that experiencing capital constraint tend to lose the investment chance in strategic activities (Hubbard, 1998 in Campello et al, 2010), including investment in inventory (Carpenter et al, 1998), and investment in research and development activity (Himmelberg and Petersan, 1994; Hall and Lerner, 2010). From the commentaries about capital constraint relationship with investment capability, can be concluded that capital constraint could reduce and even erase the chance to do investment.
Nowadays, some researchers were able to find many evidences showing that CSR could overcome the capital constraint. One of them is from Beiting Cheng et al (2011), which stated that the implementation of CSR with two sub variables, stakeholders engagement and CSR disclosure could reduce capital constraint.
Kaplan and Zingales (1997) disclosed that capital constraint could be calculated from: cash flow ratio, dividend ratio, Tobin’s Q ratio, cash holding ratio, and leverage ratio. High cash flow and cash holding ratio indicates that a company has a lot of funds to pay many new investment projects. Thus, both cash flow and cash holding ratio have negative effect on capital constraint.
Tobin’s Q is a market value ratio of a company towards its equity. A company that have
investment and development anymore, which means this company does not need lots of funds (Lamont et al, 2001). Low market to book ratio shows that the market value is lower than the book value of a company. If the market value is higher than book value, the value of the
company’s stocks would be undervalued. In this undervalued condition, many investors usually
tend to buy the company’s stocks (Sukamulja, 2005). Moreover, high dividend payment
indicates that a company has a lot of incomes (Chan et al, 1996). Therefore, company that has
low market to book value and high dividend ratio tends to have a lot of funds. Thus, Tobin’s Q
has a positive effect on the capital constraint, and in the opposite, dividend payment has a negative effect on the capital constraint.
Leverage is the usage level of debt that could be calculated with debt to total capital ratio (total debt divided by total asset). Companies that have high debt to total capital ratio tend to be in a difficult condition to get debt because its probability of default is already high (Baker et al, 2003). This condition makes the access to finance becomes limited. Thus, leverage have positive effect on capital constraint.
Lamont, Polk, and Saa (2001) have been succeed in finding an equation to measure capital constraint based on the theory from Kaplan and Zingales (2007). This equation is known as KZ (Kaplan-Zingales) Index.
c. Cost of Equity
Dhaliwal, Tsang, and Yang (2009) stated that a company tends to want low costs of equity. Related with that, CSR implementation can help to reduce the cost of equity. Botosan (1997) found that the cost equity may be reduced by lowering the agency cost and asymmetry information. The statement about the effect of CSR on cost of equity is clarified in the research done by Ghoul et al (2011). In his research, Ghoul found that a good CSR implementation can reduce the cost of equity.
3. Relationship Between Variables
a. Relationship Between Stakeholders Engagement and Capital Constraint
In relation to company’s access to finance, Foo (2007) said that the stakeholders
engagement can reduce the agency cost. Halim (2007) added the explanation about agency cost which is the cost that came to make managers work in accordance with the owner’s purpose.
Agency cost consists of five things, which are:
- Audit fee to monitor managers’ authorities.
- Various agreements and contracts which stated that managers will not misuse their authorities.
- Incentive expense as a compensation certain managers as the result of their achievements - Contract between a company and the third party, where this third party will pay the
- Contract between the owner of a company and the managers, where the owner ensure that the managers will get a certain amount of compensation.
Agency cost could also arise because of the conflict of interest between manager and the owner. In some cases, there were managers who tend to use high amount of debt for their opportunistic chance, not for maximizing the shareholder value (Christianti, 2006). If the agency cost could be reduced, the efficiency to earn profit may rise. Therefore, indirectly, the stakeholders engagement could also increase profitability.
Choi and Wang (2009) stated that a strong stakeholders engagement can increase
company’s profit and income. Lukas (2003) also said that the high level of profit enable a
company to get the access to finance from retained earnings. Thus, according to many theories, stakeholders engagement could decrease the agency cost and increase profit.
b. Relationship Between Stakeholders Engagement and Cost of Equity
Agency cost usually appears because of the conflict of interest between the company’s
management and its shareholders. Conflict of interest occurred because managers tend to concern more on their own interest (for example: managers try to make high profit by manipulating the company’s financial report to get more bonuses). Otherwise, shareholders do
not like what is done by the managers because it could reduce the company’s long term profit as
well as the dividend that will be received by the shareholders. Thus, the effect of the agency cost itself can reduce the corporate value. (Rozeff, 1982).
The reduction of corporate value may cause investors tend to offer the company’s stocks
at a low price. The low offer of the company’s stocks implies a high company’s cost of equity
because the cost that should be paid would be over the low price of the company’s stocks, and
thus it would be high (Setyawan and Sutapa, 2006). Therefore, if the stakeholders engagement
could be done well, the agency cost would be reduced as well as the company’s cost of equity.
c. Relationship Between CSR Disclosure and Capital Constraint
In general, companies that have good CSR performance tend to disclose their CSR. The CSR issues are disclosed to give a good effect to the company sustainability (Dhaliwal et al., 2011), as well as reduce the asymmetry information between the company and public (Hubbard, 1998).
The asymmetric information could affect the company’s external source of finance.
Myers and Majluf (1984) in Leary and Roberts (2008) show that with the asymmetry information, investors usually would interpret it as a bad news. Thus, the external investors
would give a low value to the company’s stocks, and even do not want to buy. Furthermore,
In order to reduce the asymmetry information, one of several ways that could be done is by increasing the company’s CSR disclosure. The reduction of asymmetry information would
affect the investors’ desire to buy the stocks of the company. With that, the company’s chance to
get more access to finance is higher.
d. Relationship Between CSR Disclosure and Cost of Equity
The asymmetry information cause investors unable to get complete information about the company where the investors would want to place their money. This condition may affect the investors to interpret negative things (Myers and Majluf, 1984). Moreover, Merton (1987:489) also adds that an investor would invest to the stocks of a company if he/she had known the company well. One of much information that is important to be disclosed is about CSR, because CSR disclosure tends to give positive thinking to the investors.
Nowadays, many investors have started to concern about company’s going concern. They
would prefer to buy stocks from companies with good CSR implementation because it is believed to have low risk. On the contrary, companies with bad CSR implementation tend to be questioned about its going concern and thus have a very high risk. Investors usually do not want to buy stocks from companies with very high risk. Even though they want, they would ask for a high expected rate of return (Hong and Kacperczyk, 2009). That means the cost of equity would be high.
The more a company discloses its CSR information, the less its cost of equity will be (Botosan, 1997). Furthermore, the reduction of asymmetry information shows effect toward the reduction of the cost of equity (Lundholm, 1996).
e. Relationship Between Cost of Equity and Capital Constraint
Kartini and Arianto (2008) stated that a high cost of equity could reduce the company’s
profitability. On the contrary, a low cost of equity could increase the company’s profitability
(Susilawati, 2004). Lukas (2003) said that the high rate of profitability may give a company to be able to gain access to finance from the retained earnings. Thus, cost of equity has a positive
impact on capital constraint, which means if the cost of equity decrease, the company’s
profitability will increase, and thus the capital constraint will decrease too.
Furthermore, Hong and Kacperczyk (2009) have stated that a company with low cost of equity implies that the investors do not expect a high rate of return, which means the investors
would want to buy the company’s stocks with high price. Thus, the access to get more funds is
higher, and the capital constraint would be low.
4. Hypothesis
a. Stakeholders engagement has negative effect toward cost of equity. b. CSR disclosure has negative effect toward cost of equity.
c. Stakeholders engagement and CSR disclosure affect cost of equity simultaneously. d. Stakeholders engagement has negative effect toward capital constraint.
e. CSR disclosure has negative effect toward capital constraint. f. Cost of equity has positive effect toward capital constraint.
g. Stakeholders engagement, CSR disclosure, and cost of equity affect capital constraint simultaneously.
h. Cost of equity mediates the relationship between stakeholders engagement and CSR disclosure toward capital constraint.
C. RESEARCH METHODOLOGY
1. Research Object and Subject
Subject of this research is the manufacturing industry companies that are listed in the Indonesian Stock Exchange (IDX). The choice goes for this manufacturing industry because this industry has done many production processes that give direct and indirect effect to the physical and social environment.
Object of this research is the CSR implementation with two proxies, which are: stakeholders engagement and CSR disclosure, cost of equity, and capital constraint.
2. Research Design
The research design that is used in this research is verification analysis and descriptive research design. The verification analysis is usually used to test the truth of a hypothesis that explains a relationship between variables. The type of data of this research is pooled data based on the data of each company within the period of 2010 and 2011. Sampling technique that is used in this research is purposive sampling based on some data criteria. The analysis method of this research is the method of Two Stage Least Square (2SLS) and One Least Square (OLS) to test the hypothesis about the mediation and the relationship between variables in this research.
3. Variables Operationalization
a. Endogenous Variable
1) Capital Constraint
KZ Index = –1.001909 x CF/K + 0.282638 Q + 3.139193Lev– 39.3678Div/K – 1.314759 Cash/K
(Lamont, 2001)
Description:
CF = Net profit before extraordinary accounts + Total depreciations and amortizations
K = PP&Et-1 (Properties, Plants, and Equipment of one year before)
Q (Tobin’s Q) = (Market capitalization + Total preferred stocks – Deferred Tax Asset) / Total
Equities
Leverage = Long term liabilities + Long term liabilities with period less than 1 year + Notes payable) / Total assets
Div = Dividend (Total Dividend from common and preferred stocks) Cash = Cash and short term investments
2) Cost of Equity
Sartono (2000) stated that cost of equity is an expected rate of return from the stocks owned by investors. One of many ways to calculate cost of equity is by using Capital Asset Pricing Model (CAPM) method (Damodaran, 2006). The formula of CAPM is:
R = Rf + β (Rm - Rf)
Rm = (IHSGt - IHSGt-1)/IHSGt-1
β = Regression coefficient between Ri and Rm
Description:
R = Expected return on a given risky security Rf = Risk free rate
Rm = Expected return on the stock market as a whole t = Period (daily)
β = Specific risk from a certain stock
b. Exogenous Variable
1) Stakeholders Engagement
Stakeholder is an individual or group that able to influence or even very influencing the goal of an organization (Freeman, 1984:46 in Sadorsky, 1996). Stakeholders could also be
defined as a group of people that received benefits or expenses because of a company’s activities
(Steiner and Steiners, 2003).
Regarding with an entity or company, stakeholders of a company certainly have engagement with the company directly or indirectly. Stakeholders engagement is a portrait of
company’s relationship with its environment where each individual or group have their own
Waddock (2002) said that stakeholders engagement is a collaboration based on belief between individual and/or social institution with different objectives that can only be achieved with togetherness.
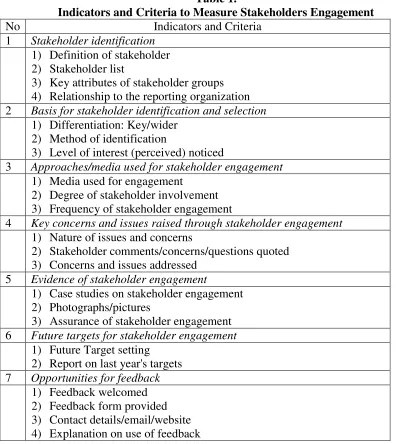
Stakeholders engagement variable is measured with seven indicators used by The Environment Council (TEC). Each of the indicators consists of several criteria that should be
disclosed on the company’s annual report. Total of all the criteria is 22 items. If there was/were
criterion/criteria of an indicator disclosed, no matter how many criteria are disclosed, it will give one score to the indicator. The score applicable for each indicator is only one. Value of the variable is total score from the disclosed indicators divided by seven (total indicators).
Table 1.
Indicators and Criteria to Measure Stakeholders Engagement
No Indicators and Criteria 2 Basis for stakeholder identification and selection
1) Differentiation: Key/wider
4 Key concerns and issues raised through stakeholder engagement
1) Nature of issues and concerns
2) Stakeholder comments/concerns/questions quoted 3) Concerns and issues addressed
5 Evidence of stakeholder engagement
1) Case studies on stakeholder engagement 2) Photographs/pictures
3) Assurance of stakeholder engagement 6 Future targets for stakeholder engagement
1) Future Target setting 2) Report on last year's targets 7 Opportunities for feedback
1) Feedback welcomed 2) Feedback form provided 3) Contact details/email/website 4) Explanation on use of feedback
2) CSR Disclosure
CSR disclosure happened when a company disclosed its CSR to public. In this research, CSR disclosure is measured based on whether the CSR activities are disclosed or not in the
company’s annual report. Indicators used by this CSR disclosure variable are taken from
Thomson Reuters ASSET4 Categories which classified into three dimensions. Each dimension consists of several indicators that should be disclosed in the annual report. Total indicators of this variable are 15 items. For every disclosed indicator will get one score. Value of the variable is total score from the disclosed indicators divided by 15 (total indicators). The dimensions and indicators are as follows:
A. Environmental Performance
1. Resource Reduction
The resource reduction category measures a company‘s management commitment and
effectiveness towards achieving an efficient use of natural resources in the production
process. It reflects a company‘s capacity to reduce the use of materials, energy or water,
and to find more eco-efficient solutions by improving supply chain management.
2. Emission Reduction
The emission reduction category measures a company‘s management commitment and
effectiveness towards reducing environmental emission in the production and operational
processes. It reflects a company‘s capacity to reduce air emissions (greenhouse gases, F
-gases, ozone-depleting substances, NOx and SOx, etc.), waste, hazardous waste, water discharges, spills or its impacts on biodiversity and to partner with environmental organizations to reduce the environmental impact of the company in the local or broader community.
3. Product Innovation
The product innovation category measures a company‘s management commitment and
effectiveness towards supporting the research and development of eco-efficient products
or services. It reflects a company‘s capacity to reduce the environmental costs and
burdens for its customers, and thereby creating new market opportunities through new environmental technologies and processes or eco-designed, dematerialized products with extended durability.
B. Social Performance
1. Employment Quality
The workforce / employment quality category measures a company‘s management
commitment and effectiveness towards providing high-quality employment benefits and
job conditions. It reflects a company‘s capacity to increase its workforce loyalty and
productivity by distributing rewarding and fair employment benefits, and by focusing on long-term employment growth and stability by promoting from within, avoiding lay-offs and maintaining relations with trade unions.
2. Health and Safety
The workforce / health and safety category measures a company‘s management commitment and effectiveness towards providing a healthy and safe workplace. It reflects
into its day-to-day operations a concern for the physical and mental health, well being and stress level of all employees.
3. Training and Development
The workforce / training and development category measures a company‘s management
commitment and effectiveness towards providing training and development (education)
for its workforce. It reflects a company‘s capacity to increase its intellectual capital, workforce loyalty and productivity by developing the workforce‘s skills, competences,
employability and careers in an entrepreneurial environment.
4. Diversity and Opportunity
The workforce / diversity and opportunity category measures a company‘s management
commitment and effectiveness towards maintaining diversity and equal opportunities in
its workforce. It reflects a company‘s capacity to increase its workforce loyalty and
productivity by promoting an effective life-work balance, a family friendly environment and equal opportunities regardless of gender, age, ethnicity, religion or sexual orientation.
5. Human Rights
The society / human rights category measures a company‘s management commitment
and effectiveness towards respecting the fundamental human rights conventions. It
reflects a company‘s capacity to maintain its license to operate by guaranteeing the
freedom of association and excluding child, forced or compulsory labor.
6. Community
The society / community category measures a company‘s management commitment and effectiveness towards maintaining the company‘s reputation within the general
community (local, national and global). It reflects a company‘s capacity to maintain its
license to operate by being a good citizen (donations of cash, goods or staff time, etc.), protecting public health (avoidance of industrial accidents, etc.) and respecting business ethics (avoiding bribery and corruption, etc.).
7. Customer / Product Responsibility
The customer / product responsibility category measures a company‘s management
commitment and effectiveness towards creating value-added products and services
upholding the customer‘s security. It reflects a company‘s capacity to maintain its license to operate by producing quality goods and services integrating the customer‘s health and
safety, and preserving its integrity and privacy also through accurate product information and labeling.
C. Corporate Governance
1. Board Structure
The board of directors / board structure category measures a company‘s management
commitment and effectiveness towards following best practice corporate governance principles related to a well-balanced membership of the board. It reflects a company‘s
capacity to ensure a critical exchange of ideas and an independent decision-making process through an experienced, diverse and independent board.
2. Compensation Policy
The board of directors / compensation policy category measures a company‘s
management commitment and effectiveness towards following best practice corporate governance principles related to competitive and proportionate management
members with the necessary skills by linking their compensation to individual or company-wide financial or extra-financial targets.
3. Board Functions
The board of directors / board functions category measures a company‘s management
commitment and effectiveness towards following best practice corporate governance
principles related to board activities and functions. It reflects a company‘s capacity to
have an effective board by setting up the essential board committees with allocated tasks and responsibilities.
4. Shareholder Rights
The shareholders / shareholder rights category measures a company‘s management
commitment and effectiveness towards following best practice corporate governance principles related to a shareholder policy and equal treatment of shareholders. It reflects a
company‘s capacity to be attractive to minority shareholders by ensuring them equal
rights and privileges and by limiting the use of anti-takeover devices.
5. Vision and Strategy
The integration / vision and strategy category measures a company‘s management
commitment and effectiveness towards the creation of an overarching vision and strategy integrating financial and extra-financial aspects. It reflects a company‘s capacity to
convincingly show and communicate that it integrates the economic (financial), social and environmental dimensions into its day-to-day decision-making processes.
4. Statistical Equations and Model
Based on the literature review, previous relevant researches, and research hypotheses, the research model is as follows:
Picture 1.
Research Model With CE as An Intervening Variable
Description:
SE = Stakeholders Engagement
CD = CSR Disclosure
CE = Cost of Equity (Intervening Variable)
CC = Capital Constraint
SE
CE
CC
From picture 1, there are two statistic equations that could be gotten, which are:
Structural Equation 1:
CE it+1= β01 + β1 SE it + β2 CD it + e it
Variable CE it+1 in the first equation is a dependent variable. In the second equation, it will be a
dependent variable. Therefore, in the second equation, CE it+1 is transformed into CÊ it+1
(intervening variable). The second equation is formulated as follows:
Structural Equation 2:
CC it+1 = β02 + β3 SE it + β4 CD it+ β5 CÊ it+1 + e it
5. Statistical Analysis
Statistical analysis is conducted to test the model validation, statistical model, and research hypotheses. Model validation test will be done with classical assumption test which consist of multicollinearity and heteroscedasticity test. Hypotheses test will be done by t-test and F-test.
To test whether the cost of equity variable (CE) is an intervening variable of stakeholders engagement and CSR disclosure toward capital constraint, it will be tested with Pearson test. If the result supports CE as an intervening variable, the research model in Picture 1 is right and it will be tested with Two Stage Least Square Method (TwoSLS). If the result does not support CE as an intervening variable or only mediating either SE or CD toward capital constraint, the research model will be disparted as follows:
(Trihendradi, 2012)
Research Model 1:
SE
CE
Research Model 2:
Picture 2.
Research Model If CE Is Not an Intervening Variable
Structural equations of the research models in Picture 2 are as follows:
Model 1 : CE it+1= β01 + β1 SE it +β2CD it + e it
Model 2 : CC it+1= β02 + β3 SE it + β4 CD it + β5 CE it+1 + e it
D. ANALYSIS AND DISCUSSION
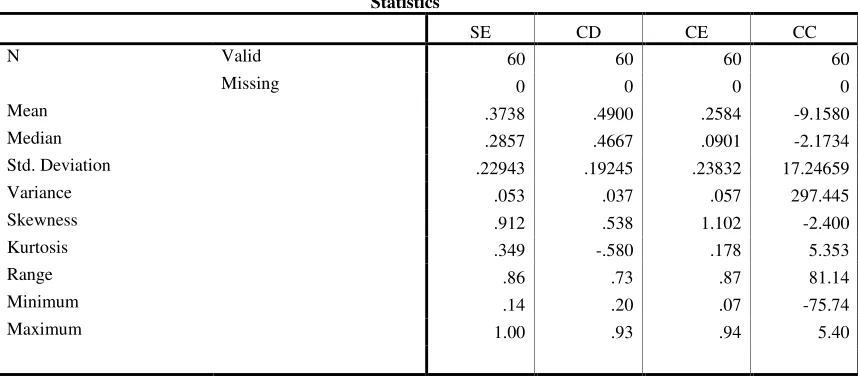
1. Descriptive Statistic
Descriptive statistic variable for this research is presented in Table 2. There are four research variables used for the research, which are: SE, CD, CE, and CC. The total of valid data that are used in this research is 60 data for each variable, and there are no missing data. Looking at the table 2, data for SE, CE, and CC variable have abnormal distribution, whereas the distribution of CD variable is normal.
Tabel 2. Descriptive Statistic of Research Variables
Statistics
SE CD CE CC
N Valid 60 60 60 60
Missing 0 0 0 0
Mean .3738 .4900 .2584 -9.1580
Median .2857 .4667 .0901 -2.1734
Std. Deviation .22943 .19245 .23832 17.24659
Variance .053 .037 .057 297.445
Skewness .912 .538 1.102 -2.400
Kurtosis .349 -.580 .178 5.353
Range .86 .73 .87 81.14
Minimum .14 .20 .07 -75.74
Maximum 1.00 .93 .94 5.40
SE
CE
CC
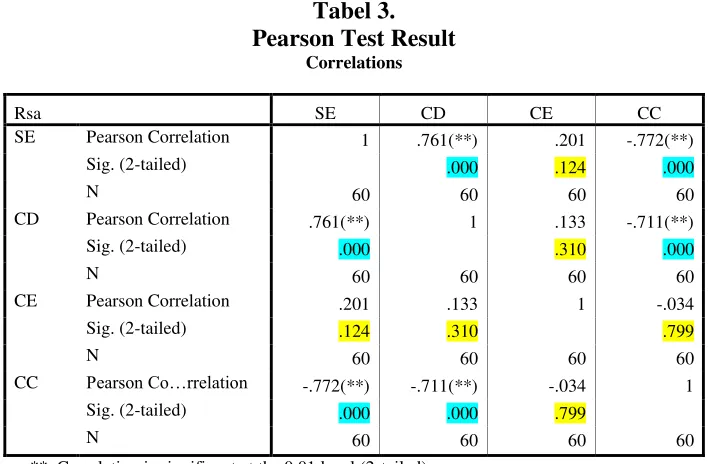
2. Test The Existence of CE As An Intervening Variable
To test the existence of CE as an intervening variable, Pearson test is used to test the correlation between variables. In this research, the Pearson test is conducted in order to test whether CE really mediates the exogenous variables SE and CD toward the endogenous variable CC or not. The result of the Pearson test for this research is as follows:
Tabel 3. Pearson Test Result
Correlations
Rsa SE CD CE CC
SE Pearson Correlation 1 .761(**) .201 -.772(**)
Sig. (2-tailed) .000 .124 .000
N 60 60 60 60
CD Pearson Correlation .761(**) 1 .133 -.711(**)
Sig. (2-tailed) .000 .310 .000
N 60 60 60 60
CE Pearson Correlation .201 .133 1 -.034
Sig. (2-tailed) .124 .310 .799
N 60 60 60 60
CC Pearson Co…rrelation -.772(**) -.711(**) -.034 1
Sig. (2-tailed) .000 .000 .799
N 60 60 60 60
** Correlation is significant at the 0.01 level (2-tailed).
From the correlation analysis result in table 3, could be seen that almost all of the correlation between variables shows result below 0.01 except for those that are correlated with CE variable. Each variable that are connected with CE have correlation test result above 0.01. This result gives conclusion that CE is not an intervening variable for SE and CD toward CC, which means hypothesis (h) is rejected. Therefore, the regression model in this research will use OLS method with two separated models.
3. Classical Assumption Test
The test for normality in this research is done by Kolmogorov-Smirnov test. The result of the test shows that the first research model is not normally distributed (Table 4 Panel A), and the second research model is normally distributed ( Table 4 Panel B).
Tabel 4. Test For Normality
One-Sample Test
N 60
Kolmogorov-Smirnov Z 1.970
Asymp. Sig. (2-tailed) .001
Panel B (Model 2) Unstandardized Residual
N 60
Kolmogorov-Smirnov Z .882
Asymp. Sig. (2-tailed) .418
Result of the multicollinearity test toward the independent variables for the first research model (SE and CD) and the second research model (SE, CD, and CE) shows no multicollinearity occurred, because all of the research variables have VIF value between 1.043 – 2.431 (VIF < 10.00).
In this research, Spearman’s rho test is used to test the heteroscedasticity. The test result
of the first and the second research model shows no heteroscedasticity problem. The significance level of all variables is more 0.05 (p > 0.005).
4. Statistical Hypotheses Test
The statistic hypotheses test is done by OLS method with results as follows:
First Structural Equation Model:
CE it+1 = 0.199+0.236 SE it –0.056 CD it
t. sig : 0,255 0,823 F. Sig = 0,312
R2 = 4,1%
Second Structural Equation Model:
CC it+1 = 16.820 – 40.770SE it– 26.754 CD it + 8.427 CE it+1
t. sig : 0,000** 0,022* 0,164 F. Sig = 0,000**
R2 = 64,7%
Regression result of the first model shows that SE variable and CD variable have significance level (t sig.) equal to 0.255 and 0.823. These values reflect that the relationship between variables is not significant, because the p value of each variable is more than 5%. With this condition, that means there are still not enough evidence to show if there is a relationship between stakeholders engagement and CSR disclosure toward capital constraint.
between stakeholders engagement and CSR disclosure toward capital constraint is significant. On the contrary, CE variable toward CC variable is not significant. Thus, the conclusion is:
- Stakeholders engagement has negative effect towards capital constraint. - CSR disclosure has negative effect towards capital constraint.
- Cost of equity has no effect toward capital constraint.
Simultaneous significance test (F-test) for the first research model also shows that the relationship between variables is not significant, because the F sig. = 0.312 (> 0.05). Whereas for the second model, the test shows that the relationship between variables is significant.
Determination coefficient (R2) from the first model regression is equal to 0.040, and for the second model, the R2 is equal to 0.634. This condition happened because the first model is not significant, thus the R2 is very low, describes nothing. In the second model, the R2 is significant. Therefore, it could be said that the independent variables describe the dependent variables with percentage equal to 63.4%.
5. Discussion
This research is a verification research that is conducted to see the causal relationship between the independent and dependent variables in this research. The purpose of this research is to find the truth of the hypotheses that are formed by theories and previous researches, and to re-test whether the theories can be implemented in the manufacturing companies in Indonesia.
The hypotheses test result of the first research model, which is the relationship of stakeholders engagement and CSR disclosure toward capital constraint, shows no significant relationship for both in each specific case and simultaneously. One of the reasons that the relationship is not significant is because the data used for the first research model is not normally distributed. Therefore, the result of this research rejects hypothesis 1, 2, and 3.
Stakeholders engagement (SE) has no significant effect toward cost of equity (CE). Thus, the increment of stakeholders engagement (SE) cannot decrease the cost of equity. This thing is contradict with the research conducted by Rozeff (1982) and Sutapa (2006) which stated that stakeholders engagement has negative effect towards cost of equity. In addition, CSR disclosure (CD) has also no significant effect toward cost of equity (CE). Stakeholders engagement (SE) and CSR disclosure (CD) are the sub variables of Corporate Social Responsibility (CSR). Simultaneously, both stakeholders engagement and CSR disclosure are proven have no significant effect toward the cost of equity (CE). This finding proves that Corporate Social
Responsibility (CSR) is not an important variable that becomes the investors’ consideration
when they want to invest in stocks.
In 2009, Hong and Kacperczyk conducted a research to find the effect of CSR towards cost of equity with research subject focused on sin stock companies which mostly engaged with alcohol, tobacco, and the like. Relating with this research, the subjects of this research is manufacturing companies which mostly are not sin stock or environmental vandal. Therefore, the result of this research could be different from Hong and Kacperczyk’s. Furthermore, the reason
stock price in Indonesia is much fluctuated. The result of this research shows that the cost of equity of every company from year to year has a very distance gap. That means, there are still much other things aside of CSR that affect the cost of equity of manufacturing companies in Indonesia. This is equal with the determination coefficient (R2) of the first research model, which is only 4%.
From the second research model, the effect of stakeholders engagement (SE), CSR disclosure (CD), and cost of equity (CE) toward capital constraint (CC); only SE variable and CD variable that have significant effect. On the contrary, CE has no significant effect toward the capital constraint.
Stakeholders engagement has negative effect towards capital constraint, means that it is an important sub variable of CSR to reduce the capital constraint. Theories in this research explain that stakeholders engagement is able to reduce the capital constraint because of the reduction of agency cost. This finding supports the research conducted by Foo (2007), Abdul Halim (2007), and Cheng et al (2011).
This research finds that CSR disclosure has negative effect towards capital constraint. Theories of this research explain that CSR disclosure is able to reduce asymmetry information of
a company. This thing leads to the increment of investors’ desire to buy stocks from the
company, which could reduce the capital constraint. Myers and Majluf (1984) in Leary and Roberts (2008) stated that with asymmetry information, investors usually would interpret it as a bad news. Thus, the external investors would give a low value to the company’s stocks, and even do not want to buy. Furthermore, asymmetry information would also make investors hesitate to believe if the company has a good sustainability. Therefore, the investors tend not to buy stocks from the companies that have high asymmetry information.
Based on theories, cost of equity supposed to have positive effect towards the capital constraint. When the profitability of a company increase, then its capital constraint could be reduced with the access to finance from the retained earnings. Kartini and Arianto (2008) stated
that a high cost of equity could reduce the company’s profitability. On the contrary, a low cost of equity could increase the company’s profitability (Susilawati, 2004). Another finding from this
research shows that the cost of equity has no significant effect towards capital constraint. This means that retained earnings is not the main source to gain funds for manufacturing companies in Indonesia. From the KZ Index calculation result, it could be seen that the highest source of funds is from Initial Public Offering (IPO) and leverage, not the profitability.
6. Research Findings
After all of the research processes have been completed, there are several findings related with stakeholders engagement found. The findings consist of:
a. Based on some references used in this research, the data for stakeholders engagement variable supposed to use primary data which could be gotten from sending questionnaires
that consist of stakeholders engagement’s indicators to the sample companies. But in
This event can be an indication that many companies in Indonesia still do not concern and care about stakeholders engagement.
b. Based on the annual report and statistical descriptive analysis, could be seen that the implementation of stakeholders engagement in Indonesia manufacturing companies is still low. This is proven by the graph below:
In the graph could be seen that only stakeholder identification indicator have been implemented in almost all of the sample companies, and only few companies implement the other indicators. Another evidence is from the result of the statistical descriptive that shows the mean of the stakeholders engagement variable which is only 0.3738. Thus, these evidence support the statement in point a.
E. CONCLUSION AND SUGGESTION
1. Conclusion
Based on the relevant model that was created based on the literature review, and supported by the research analysis, then the research result can be concluded as follows:
From the first research model:
a. Stakeholders engagement has no effect toward cost of equity. b. CSR disclosure has no effect toward cost of equity.
c. Stakeholders engagement and CSR disclosure do not affect cost of equity simultaneously. d. Stakeholders engagement has negative effect toward capital constraint.
From the second research model:
e. CSR disclosure has negative effect toward capital constraint. f. Cost of equity has no effect toward capital constraint.
0 5 10 15 20 25 30
2010
g. Stakeholders engagement, CSR disclosure, and cost of equity affect capital constraint simultaneously.
h. Cost of equity mediates the relationship between stakeholders engagement and CSR disclosure toward capital constraint.
2. Suggestion
After completing the research and seeing its results and findings, the writer would like to give suggestions as follows:
a. For Indonesia government, it would be nice if strict sanctions could be made to support the CSR regulation which is part of the Indonesian corporate law.
b. For Indonesia capital market regulator, it would be nice if the capital market regulator could encourage the issuers to implement more CSR practices, because CSR implementation is able to reduce asymmetry information and make the capital market more efficient.
DAFTAR PUSTAKA
Andriof, J & Waddock, S., 2002.Unfolding stakeholder thinking: Theory, responsibility and engagement, Greenleaf Publishing, Sheffield, UK, pp. 19-42.
Ardini, L., 2009. Analisis Perbandingan Pengaruh Langsung dan Tak Langsung Faktor Budaya Organisasi dan Komitmen Terhadap Kinerja Karyawan Pada UPTD Parkir Kota Surabaya.Jurnal Ekuitas, 13(2): 238-258.
Arikunto, S., 2005. Manajemen Penelitian. Jakarta : Rineka Cipta.
Baker, M., Stein, J.C., and Wurgler, J., 2003. When does the market matter? Stockprices and the investment of equity-dependent firms.The Quarterly Journal of Economics 118:
969-1005.
Berlingeri, H. O., 2006. Yes, After All, In an MM World, Dividends are Irrelevant.Working Paper, Pontificia Universidad Católica Argentina.
Blowfield, M., 2005.Corporate Social Responsibility: reinventing the meaning ofdevelopment?International Affairs, 81(3): 515-524.
Botosan, C., 1997. Disclosure Level and the Cost of Equity Capital.The Accounting Review, 72:
323-349.
Budimanta.Arif., 2004, Corporate Social Responsilbility, Jawaban Bagi Model Pembangunan Indonesia Masa Kini, Indonesia Center Sustainable Development, Jakarta.
Campello, M., Graham, J.R., and Harvey, C.R., 2010. The real effects of financial constraints: Evidence from a financial crisis. Journal of Financial Economics, 97(3): 470-487.
Carpenter, R.E., Fazzari, S.M., and Petersen, B.C., 1998.Financing constraints and inventory investment: A comparative study with high-frequency panel data.Review of Economicsand Statistics, 80: 513-519.
Carson, R., 2000. Silent Spring (New Edition). London: Penguin Modern Classics.
Chan, L., Jegadeesh, N., Lakonishok, J., 1996. Momentum strategies.Journal of Finance, 51:
1681–1713.
Chen, C. H., 2011. The Major Components of Corporate Social Responsibility.Journal of Global Responsibility, 5(1): 85-99.
Choi, J., and Wang, H., 2009. Stakeholder relations and the persistence of corporate financial performance.Strategic Management Journal, 30: 895-907.
Christianti, A., 2008. Pengujian POT:Pengaruh Leverage terhadap Pendanaan Surplus dan Defisit Pada Industri Manufaktur Di BEI. The 2nd National Conference, UKWMS.
Clement, M., & Tse, S.Y., 2005.Financial Analyst Characteristics and Herding Behavior in forecasting.The Journal of Finance, 60: 307-341.
Collins, J. and Porras, J. I. Built to Last – Successful Habits of Visionary Companies. Century,
1994.
Damodaran, A., 2006. Damodaran on Valuation 2nd edition: Security Analysis For Investment And Corporate Finance. New jersey: John Wiley & Sons.
Darwin, A. (2006). Akuntabilitas, kebutuhan, pelaporan dan pengungkapan CSR bagi perusahaan di Indonesia. Economics Business Accounting Review, 3, 83-95.
Da, Z., Guo, R. J., and Jagannathan, R., 2012. CAPM for estimating the cost of equity capital: Interpreting the empirical evidence. Journal of Financial Economics, 103: 204-220.
Dhaliwal, D., Li, O.Z., Tsang, A.H., and Yang, Y.G., 2011. Voluntary non-financial disclosure and the cost of equity capital: The case of corporate social responsibility reporting.The Accounting Review, 86(1): 59-100.
El Ghoul, S., Guedhami, O., Kwok, C.C.Y., and Mishra, D.R., 2011. Does corporate social responsibility affect the cost of capital? Journal of Banking and Finance, 35 (9):
2388-2406.
Elkington, J., 1997. Cannibal With Forks: The Triple Bottom Line of 21st Century.Oxford.
Foo, L.M., 2007. Stakeholder engagement in emerging economies: considering the strategic benefits of stakeholder engagement in a cross-cultural and geopolitical context.
Corporate Governance, 7(4):379-387.
Gay, L.R. dan Diehl, P.L., 1992.Research Methods for Business and. Management, MacMillan
Publishing Company, New York.
Vintila, G., 2013. A Study of the Relationship between Corporate Social Responsibility - Financial Performance - Firm Size.Revista Română de Statistică. Trim I, 62–67.
Ghozali, I. 2001. Aplikasi Analisis dengan Program SPSS, Undip: Semarang.
Greenwood, P. M., 2007. Functional plasticity in cognitive aging: Reviewand hypothesis.
Neuropsychology, 21, 657–673.
Halim, A., 2007. Pengelolaan Keuangan Daerah, Yogyakarta: UPP STIM YKPN.
Hall, B.H., and Lerner, J., 2010. The Financing of R&D and Innovation. In: Hall, B.H., and Rosenberg, N. (eds.), Handbook of The Economics of Innovation. Elsevier, Chap 14.
Heinkel, R., Kraus, A., Zechner, J., 2001. The effect of green investment on corporate behavior.Journal of Financial and Quantitative Analysis,36: 431-449.
Hendriksen, Eldon S., Michael F.,and Breda, V.,2002. Teori akunting Terjemahan oleh Herman
Wibowo. Buku 2 Jakarta: Interaksara.
Henriques, I, and P. Sadorsky (1996) The Determinants of an Environmentally Responsive Firm An Empirical Approach, Journal of Environmental Economics and Management, 30 (3),
May, 381-395.
Hidayat, R, 2010.Keputusan Investasi dan Financial Constraints: Studi Empiris Pada Bursa Efek Indonesia. Buletin Ekonomi Moneter dan Perbankan, April, 457-480.
Himmelberg, C.P., and Petersen, B.C., 1994. R&D and Internal Finance: A Panel Study of Small Firms in High-Tech Industries. Review of Economics and Statistics, 76(1): 38-51.
Hong, H., Kacperczyk, M., 2009. The price of sin: The effects of social norms on markets.Journal of Financial Economics, 93:15-36.
Hubbard, R.G., 1998. Capital-market imperfections and investment.Journal of Economic Literature, 36: 193-225.
ISEA 1999, AccountAbility 1000 (AA1000) framework - Standard, guidelines and professional qualification, London.
Isenmann, R & Kim, K-C., 2006, Interactive sustainability Accounting: Developing Clear Target Group Tailoring and Stimulating Stakeholder Dialogue, in Schaltegger, S, Bennett, M & Burritt, R (eds), Sustainability Accounting and Reporting, Springer, pp. 533-555.
Jones, T. M., 1995. Instrumental Stakeholder Theory: A Synthesis of Ethics and Economics. The Academy of Management Review, 20(2): 404-437.
Kaur, A and Lodhia, S., 2013.The state of disclosures on stakeholder engagement in sustainability reporting in Australian local councils.Pacific Accounting Review: Special
issue on Sustainability Accounting and Reporting.
Kartini, dan Arianto, T., 2008, Struktur Kepemilikan, Profitabilitas, Pertumbuhan Aktiva danUkuran Perusahaan terhadap Struktur Modal pada Perusahaan Manufaktur.Jurnal Keuangan dan Perbankan,12(1): 11-21.
Kodrat, D.S., 2008. Studi penerapan corporate social responsibility untuk menciptakan sustainable growth di Indonesia.Paper dipresentasikan pada The 2nd National Conference
UKWMS.
Lamont, O., Polk, C., and Saa-Requejo, J., 2001. Financial constraints and stock returns. Review of Financial Studies 14(2): 529-554.
Leary, M.T., and Roberts, M. R., 2008.The Pecking Order, Debt Capacity, and Information Asymmetry.Journal of Financial Economics, 40: 429-458.
Lukas, A, S., 2003.Manajemen Keuangan. Yogyakarta: Andi Offset.
Lundholm, R, J., 1996. Corporate Disclosure Policy and Analyst Behavior.Accounting Review,
71(4): 467-492.
Malhotra K. Naresh., 1993. Marketing Research An Applied Orientation, second edition,
Prentice Hall International Inc, New Jersey.
Merton, R.C., 1987. A simple model of capital market equilibrium with incomplete information.Journal of Finance, 42,:483–510.
Mankiw, N. G., 2009. Macroeconomics.Worth Publishers, chap. 17.
Roscoe dikutip dari Uma Sekaran. 2006. Metode Penelitian Bisnis. Jakarta : Salemba Empat.
Rozeff , M.S., 1982. Growth, Beta and Agency Costs as Determinants of Dividend PayoutRatios.
The Journal of Financial Research, 5(3): 249-259.
Santoso, S., 2010.Metode Penelitian Kuantitatif Plus Aplikasi Program SPSS, Cetakan Pertama,
Ponorogo:P2-FE.
Sartono, A., 2000. Manajemen Keuangan, Edisi 3, Yogyakarta: BPFE.
Sofyaningsih, S, 2011. Struktur Kepemilikan, Kebijakan Dividen, Kebijakan Utang dan Nilai Perusahaan. Dinamika Keuangan dan Perbankan, Mei, 68-87.
Steiner, G., Steiner, J., 2003, Business, Government and society, A Manajerial Perspective Texs and Cases, Tenth Edition, Mc Graw-Hill Irwin.
Suharto, E., 2008. Menggagas standar audit program CSR. Paper dipresentasikan pada 6th Round Table Discussion Menggagas Standar Audit Program CSR: Implementasi UUPerseroan Terbatas, Asosiasi Auditor Internal (AAI), Financial Club Jakarta, 27
Sukamulja, S., 2005, Analisis Fundamental, Teknikal, dan Program Metastock.Finance Club Training.
Supomo, B., 2002, Metodologi Penelitian Bisnis, Cetakan Kedua, Yogyakara: Penerbit BFEE
UGM.
Susilawati, 2004. Analisis Faktor-faktor Yang Mempengaruhi Keputusan Pendanaan Perusahaan Manufaktur. Working Paper, Universitas Sumatera Utara.
Sutapa, 2006, Analisis Faktor Penentu Struktur Modal: Studi Empiris pada Emiten Syariah di Bursa Efek Jakarta 2001-2004.Jurnal Akuntansi Keuangan, 5(2):203-215.
Trihendradi, C., 2012. Step by Step SPSS 20 Analisis Data Statistik.Yogyakarta: Penerbit Andi.
Wibisono, Y., 2007. Membedah konsep dan aplikasi CSR. Gresik : Fascho