www.oecd.org/publishing
P
r o g r a m m e f o r
I
n t e r n a t i o n a l
S
t u d e n t
A
s s e s s m e n t
What Makes a School
Successful?
RESOURCES, POLICIES AND PRACTICES
What Makes a School
Successful?
RESOURCES, POLICIES AND PRACTICES
The statistical data for Israel are supplied by and under the responsibility of the relevant Israeli authorities. The use of such data by the OECD is without prejudice to the status of the Golan Heights, East Jerusalem and Israeli settlements in the West Bank under the terms of international law.
Photo credits:
Getty Images © Ariel Skelley Getty Images © Geostock Getty Images © Jack Hollingsworth Stocklib Image Bank © Yuri Arcurs
Corrigenda to OECD publications may be found on line at: www.oecd.org/publishing/corrigenda.
PISATM, OECD/PISATM and the PISA logo are trademaks of the Organisation for Economic Co-operation and Development (OECD).
All use of OECD trademarks is prohibited without written permission from the OECD.
© OECD 2010
You can copy, download or print OECD content for your own use, and you can include excerpts from OECD publications, databases and multimedia products in your own documents, presentations, blogs, websites and teaching materials, provided that suitable acknowledgment of OECD as source and copyright owner is given. All requests for public or commercial use and translation rights should be submitted to [email protected]. Requests for permission to photocopy portions of this material for public or commercial use shall be addressed directly to the Copyright Clearance Center (CCC) at [email protected] or the Centre français d’exploitation du droit de copie (CFC) at [email protected].
Please cite this publication as:
OECD (2010), PISA 2009 Results: What Makes a School Successful? – Resources, Policies and Practices (Volume IV) http://dx.doi.org/10.1787/9789264091559-en
PISA 2009 ReSultS: WhAt MAkeS A School SucceSSful? – VoluMe IV ©OECD 2010
3
one of the ultimate goals of policy makers is to enable citizens to take advantage of a globalised world economy.
this is leading them to focus on the improvement of education policies, ensuring the quality of service provision,
a more equitable distribution of learning opportunities and stronger incentives for greater efficiency in schooling.
Such policies hinge on reliable information on how well education systems prepare students for life. Most countries
monitor students’ learning and the performance of schools. But in a global economy, the yardstick for success
is no longer improvement by national standards alone, but how education systems perform internationally. the
oecD has taken up that challenge by developing PISA, the Programme for International Student Assessment, which
evaluates the quality, equity and efficiency of school systems in some 70 countries that, together, make up
nine-tenths of the world economy. PISA represents a commitment by governments to monitor the outcomes of education
systems regularly within an internationally agreed framework and it provides a basis for international collaboration
in defining and implementing educational policies.
the results from the PISA 2009 assessment reveal wide differences in educational outcomes, both within and
across countries. the education systems that have been able to secure strong and equitable learning outcomes,
and to mobilise rapid improvements, show others what is possible to achieve. Naturally, GDP per capita influences
educational success, but this only explains 6% of the differences in average student performance. the other 94%
reflect the potential for public policy to make a difference. the stunning success of Shanghai-china, which tops
every league table in this assessment by a clear margin, shows what can be achieved with moderate economic
resources and in a diverse social context. In mathematics, more than a quarter of Shanghai-china’s 15-year-olds
can conceptualise, generalise, and creatively use information based on their own investigations and modelling of
complex problem situations. they can apply insight and understanding and develop new approaches and strategies
when addressing novel situations. In the oecD area, just 3% of students reach that level of performance.
While better educational outcomes are a strong predictor of economic growth, wealth and spending on education
alone are no guarantee for better educational outcomes. overall, PISA shows that an image of a world divided
neatly into rich and well-educated countries and poor and badly-educated countries is out of date.
this finding represents both a warning and an opportunity. It is a warning to advanced economies that they cannot
take for granted that they will forever have “human capital” superior to that in other parts of the world. At a time of
intensified global competition, they will need to work hard to maintain a knowledge and skill base that keeps up
with changing demands.
PISA underlines, in particular, the need for many advanced countries to tackle educational underperformance so
that as many members of their future workforces as possible are equipped with at least the baseline competencies
that enable them to participate in social and economic development. otherwise, the high social and economic
cost of poor educational performance in advanced economies risks becoming a significant drag on economic
development. At the same time, the findings show that poor skills are not an inevitable consequence of low national
income – an important outcome for countries that need to achieve more with less.
schools, reduce the share of poorly performing students and raise overall performance by the equivalent of more
than half a school year. Germany was jolted into action when PISA 2000 revealed a below-average performance and
large social disparities in results, and has been able to make progress on both fronts. Israel, Italy and Portugal have
moved closer to the oecD average and Brazil, chile, Mexico and turkey are among the countries with impressive
gains from very low levels of performance.
But the greatest value of PISA lies in inspiring national efforts to help students to learn better, teachers to teach better,
and school systems to become more effective.
A closer look at high-performing and rapidly improving education systems shows that these systems have many
commonalities that transcend differences in their history, culture and economic evolution.
first, while most nations declare their commitment to education, the test comes when these commitments are
weighed against others. how do they pay teachers compared to the way they pay other highly-skilled workers?
how are education credentials weighed against other qualifications when people are being considered for jobs?
Would you want your child to be a teacher? how much attention do the media pay to schools and schooling? Which
matters more, a community’s standing in the sports leagues or its standing in the student academic achievement
league tables? Are parents more likely to encourage their children to study longer and harder or to spend more time
with their friends or in sports activities?
In the most successful education systems, the political and social leaders have persuaded their citizens to make the
choices needed to show that they value education more than other things. But placing a high value on education
will get a country only so far if the teachers, parents and citizens of that country believe that only some subset of
the nation’s children can or need to achieve world class standards. this report shows clearly that education systems
built around the belief that students have different pre-ordained professional destinies to be met with different
expectations in different school types tend to be fraught with large social disparities. In contrast, the best-performing
education systems embrace the diversity in students’ capacities, interests and social background with individualised
approaches to learning.
Second, high-performing education systems stand out with clear and ambitious standards that are shared across the
system, focus on the acquisition of complex, higher-order thinking skills, and are aligned with high stakes gateways
and instructional systems. In these education systems, everyone knows what is required to get a given qualification,
in terms both of the content studied and the level of performance that has to be demonstrated to earn it. Students
cannot go on to the next stage of their life – be it work or further education – unless they show that they are qualified
to do so. they know what they have to do to realise their dream and they put in the work that is needed to achieve it.
third, the quality of an education system cannot exceed the quality of its teachers and principals, since student
learning is ultimately the product of what goes on in classrooms. corporations, professional partnerships and
national governments all know that they have to pay attention to how the pool from which they recruit is established;
how they recruit; the kind of initial training their recruits receive before they present themselves for employment;
how they mentor new recruits and induct them into their service; what kind of continuing training they get; how
their compensation is structured; how they reward their best performers and how they improve the performance of
those who are struggling; and how they provide opportunities for the best performers to acquire more status and
responsibility. Many of the world’s best-performing education systems have moved from bureaucratic “command
and control” environments towards school systems in which the people at the frontline have much more control
of the way resources are used, people are deployed, the work is organised and the way in which the work gets
done. they provide considerable discretion to school heads and school faculties in determining how resources
are allocated, a factor which the report shows to be closely related to school performance when combined with
effective accountability systems. And they provide an environment in which teachers work together to frame what
they believe to be good practice, conduct field-based research to confirm or disprove the approaches they develop,
and then assess their colleagues by the degree to which they use practices proven effective in their classrooms.
PISA 2009 ReSultS: WhAt MAkeS A School SucceSSful? – VoluMe IV ©OECD 2010
5
t
hese are, of course, not independently conceived and executed policies. they need to be aligned across all aspects
of the system, they need to be coherent over sustained periods of time, and they need to be consistently implemented.
the path of reform can be fraught with political and practical obstacles. Moving away from administrative and
bureaucratic control toward professional norms of control can be counterproductive if a nation does not yet have
teachers and schools with the capacity to implement these policies and practices. Pushing authority down to lower
levels can be as problematic if there is not agreement on what the students need to know and should be able to do.
Recruiting high-quality teachers is not of much use if those who are recruited are so frustrated by what they perceive
to be a mindless system of initial teacher education that they will not participate in it and turn to another profession.
thus a country’s success in making these transitions depends greatly on the degree to which it is successful in
creating and executing plans that, at any given time, produce the maximum coherence in the system.
these are daunting challenges and thus devising effective education policies will become ever more difficult as
schools need to prepare students to deal with more rapid change than ever before, for jobs that have not yet been
created, to use technologies that have not yet been invented and to solve economic and social challenges that we
do not yet know will arise. But those school systems that do well today, as well as those that have shown rapid
improvement, demonstrate that it can be done. the world is indifferent to tradition and past reputations, unforgiving
of frailty and complacency and ignorant of custom or practice. Success will go to those individuals and countries
that are swift to adapt, slow to complain and open to change. the task of governments will be to ensure that
countries rise to this challenge. the oecD will continue to support their efforts.
***
this report is the product of a collaborative effort between the countries participating in PISA, the experts and
institutions working within the framework of the PISA consortium, and the oecD Secretariat. the report was
drafted by Andreas Schleicher, francesca Borgonovi, Michael Davidson, Miyako Ikeda, Maciej Jakubowski,
Guillermo Montt, Sophie Vayssettes and Pablo Zoido of the oecD Directorate for education, with advice as well as
analytical and editorial support from Marilyn Achiron, Simone Bloem, Marika Boiron, henry Braun, Nihad Bunar,
Niccolina clements, Jude cosgrove, John cresswell, Aletta Grisay, Donald hirsch, David kaplan, henry levin,
Juliette Mendelovitz, christian Monseur, Soojin Park, Pasi Reinikainen, Mebrak tareke, elisabeth Villoutreix and
Allan Wigfield. Volume II also draws on the analytic work undertaken by Jaap Scheerens and Douglas Willms in the
context of PISA 2000. Administrative support was provided by Juliet evans and Diana Morales.
the PISA assessment instruments and the data underlying the report were prepared by the PISA consortium, under
the direction of Raymond Adams at the Australian council for educational Research (AceR) and henk Moelands
from the Dutch National Institute for educational Measurement (cIto). the expert group that guided the preparation
of the reading assessment framework and instruments was chaired by Irwin kirsch.
the development of the report was steered by the PISA Governing Board, which is chaired by lorna Bertrand
(united kingdom), with Beno csapo (hungary), Daniel McGrath (united States) and Ryo Watanabe (Japan) as vice
chairs. Annex c of the volumes lists the members of the various PISA bodies, as well as the individual experts and
consultants who have contributed to this report and to PISA in general.
Angel Gurría
PISA 2009 ReSultS: WhAt MAkeS A School SucceSSful? – VoluMe IV ©OECD 2010
7
ExEcutivE summary
...13
introduction to Pisa
...17
rEadEr’s GuidE
...23
CHAPTER 1
somE FEaturEs sharEd by hiGh-PErForminG school systEms
...25
Performance differences among countries, schools and students
...26
common characteristics of successful school systems ...
27
the learning environment inside schools and classrooms
...29
the Pisa 2009 evidence base
...29
CHAPTER 2
hoW rEsourcEs, PoliciEs and PracticEs arE rElatEd to studEnt PErFormancE
...33
how Pisa examines resources, policies, practices and learning outcomes
...34
•
how selecting and grouping students are related to student performance
...34
•
how the governance of school is related to student performance
...41
•
how assessment and accountability policies are related to student performance
...46
•
how resources invested in education are related to student performance
...47
•
how resources, policies and practices are related to each other
...53
how the learning environment is related to student performance ...
54
how the features of schools and school systems are interrelated
...58
CHAPTER 3
hoW schoolinG is orGanisEd
...61
selecting and grouping students
...62
•
Vertical differentiation
...62
•
horizontal differentiation at the system level
...64
•
horizontal differentiation at the school level
...65
•
country profiles in selecting and grouping students
...66
Governance of school systems...
68
•
School autonomy
...68
•
School choice
...72
•
Public and private stakeholders
...73
•
country profiles in the governance of school systems
...73
assessment and accountability policies
...75
•
Assessment practices and purposes
...75
•
Accountability arrangements
...76
•
country profiles in assessment and accountability policies
...77
resources invested in education ...
78
•
time resources
...78
•
human resources
...81
•
Material resources
...83
•
Spending on education
...84
CHAPTER 4
The Learning environmenT
...87
Teacher-student relations
...88
Disciplinary climate
...90
how teachers stimulate students’ engagement with reading
...92
Student-related factors affecting school climate
...94
Teacher-related factors affecting school climate
...96
Parents’ involvement in and expectations of schooling
...98
Principal leadership
...99
relationship between learning environment and school climate variables
...101
PoLiCY imPLiCaTionS
...103
a commitment to children matters, as does the belief that all students can attain high levels of achievement
...104
Setting standards and showing students how to meet them matters
...104
autonomy matters when combined with accountability
...105
how resources are allocated in schools matters more than overall spending
...106
The school climate and teacher-student relations matter
...107
reFerenCeS
...109
ANNEX A
TeChniCaL BaCKgroUnD
...113
annex a1
: construction of reading scales and indices from the student, school
and parent context questionnaires
...114
annex a2
: the PISA target population, the PISA samples and the definition of schools
...126
annex a3
: Standard errors, significance tests and subgroup comparisons
...139
annex a4
: Quality assurance
...141
annex a5
: technical notes on analyses in Volume IV
...143
annex a6
: testing results in Volume IV
...152
ANNEX B
TaBLeS oF reSULTS
...153
annex B1
: Results for countries and economies
...154
annex B2
: Results for regions within countries
...268
ANNEX C
The DeveLoPmenT anD imPLemenTaTion oF PiSa – a CoLLaBoraTive eFForT
...299
This book has...
StatLinks 2
A service that delivers Excel
®files
from the printed page!
Look for the
StatLinks
at the bottom left-hand corner of the tables or graphs in this book.
To download the matching Excel
®spreadsheet, just type the link into your Internet browser,
starting with the
http://dx.doi.org
prefix.
PISA 2009 ReSultS: WhAt MAkeS A School SucceSSful? – VoluMe IV ©OECD 2010
9
BOXES
Box IV.A
key features of PISA 2009
...19
Box IV.1.1
Interpreting the data from students, parents and schools
...29
Box IV.1.2
tAlIS: teacher and learning International Survey
...31
Box IV.2.1
how to interpret the figures
...39
Box IV.3.1
Interpreting data on student learning time
...79
Box IV.3.2
Availability and use of resources: School libraries
...83
FIGURES
figure IV.A
A map of PISA countries and economies
...26
figure IV.1.1 how much of the variation in reading performance lies between countries, schools and students
...26
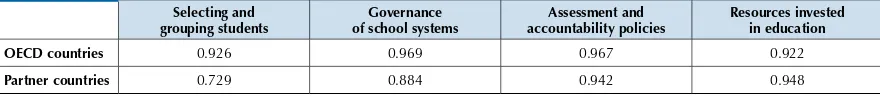
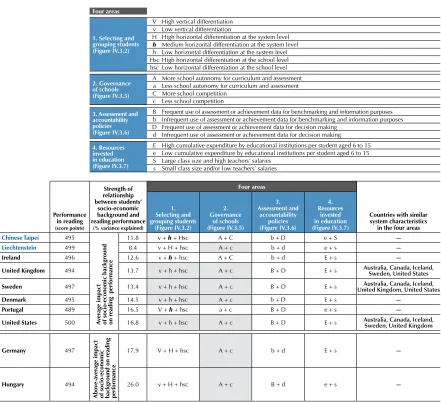
figure IV.1.2 Selected characteristics of school systems with reading performance above the oecD average
...28
figure IV.2.1a how school systems’ policies for selecting and grouping students are related to educational outcomes
...36
figure IV.2.1b countries in which school policies for selecting and grouping students are related to reading performance
...37
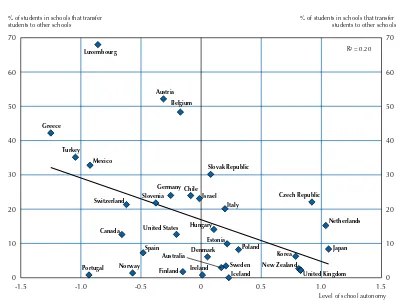
figure IV.2.2 School systems with low transfer rates tend to give more autonomy to schools to determine curricula and assessments
...38
figure IV.2.3 how school policies for selecting and grouping students are related to reading performance
...40
figure IV.2.4a how the governance of school systems is related to educational outcomes
...44
figure IV.2.4b countries in which school governance is related to reading performance
...44
figure IV.2.5 how the governance of schools is related to reading performance
...45
figure IV.2.6a how school systems’ assessment and accountability policies are related to educational outcomes
...47
figure IV.2.6b countries in which school assessment and accountability policies are related to reading performance
...48
figure IV.2.7 how schools’ assessment and accountability policies are related to reading performance
...49
figure IV.2.8 how school systems’ resources are related to educational outcomes
...51
figure IV.2.9 how school resources are related to reading performance
...52
figure IV.2.10 how selected organisational features are inter-related
...53
figure IV.2.11 how the learning environment at school is related to reading performance
...55
figure IV.2.12 countries in which the learning environment at school is related to reading performance
...56
figure IV.2.13 how student and school characteristics are related to reading performance
...57
figure IV.3.1 Age at which students enter school and how they progress
...63
figure IV.3.2 how school systems select and group students for schools, grades and programmes
...67
figure IV.3.3a how much autonomy individual schools have over resource allocation
...70
figure IV.3.3b how much autonomy individual schools have over curricula and assessments
...71
figure IV.3.4 countries in which parents can choose schools for their children
...73
figure IV.3.5 how school systems are governed
...74
figure IV.3.6 how school systems use student assessments
...78
figure IV.3.a Relationship between learning hours per week and learning hours per year in the language of instruction
...79
figure IV.3.7 how school systems allocate resources for education
...85
figure IV.4.1 Students’ views of teacher-student relations
...89
figure IV.4.2 Students’ views of how conducive classrooms are to learning
...91
figure IV.4.3 Students’ views of how well teachers motivate them to read
...93
figure IV.4.4 School principals’ views of how student behaviour affects student learning
...95
figure IV.4.5 School principals’ views of how teacher behaviour affects student learning
...97
figure IV.4.6 School principals’ views of their involvement in school matters
...100
figure IV.4.7 Relationship between student, teacher and principal behaviour
...101
figure A3.1
labels used in a two-way table
...139
TABLES
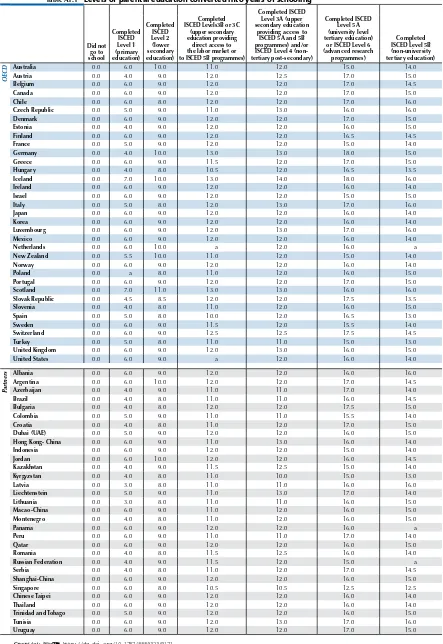
t
able A1.1
levels of parental education converted into years of schooling ...
117
table A1.2
A multilevel model to estimate grade effects in reading, accounting for some background variables ...119
table A2.1
PISA target populations and samples ...
128
table A2.2
exclusions ...
130
table A2.3
Response rates
...132
table A2.4a
Percentage of students at each grade level ...
135
table A2.4b Percentage of students at each grade level, by gender ...
136
table A2.5
Percentage of students and mean scores in reading, mathematics and science, according to whether students
are in or out of the regular education system in Argentina
...138
table A5.1
entropy value for each latent profile analysis ...
146
table A5.2
Data used for the “selecting and grouping students into schools, grades and programmes” latent profile analysis
and latent class for each school system
...147
table A5.3
Data used for the “governance of school systems” latent profile analysis and latent class for each school system ...
148
table A5.4
Data used for the “assessment and accountability policies” latent profile analysis and latent class
for each school system
...149
table A5.5
Data used for the “resources invested in education” latent profile analysis and latent class for each school system
...150
table A5.6
Data source for variable used for latent profile analyses ...
151
table IV.1.1a Selected characteristics of school systems with reading performance at the oecD average
...154
table IV.1.1b Selected characteristics of school systems with reading performance below the oecD average...155
table IV.2.1
correlations between system-level characteristics and educational outcomes
...156
table IV.2.2a Within- and between-school variation in reading performance and variation explained by schools’ policies
on selecting and grouping students
...160
table IV.2.2b Relationships between schools’ policies on selecting and grouping students and reading performance
...162
table IV.2.2c Relationships between schools’ policies on selecting and grouping students and reading performance,
accounting for students’ and schools’ socio-economic and demographic background ...
163
table IV.2.3
School systems’ policies on transferring and grouping students and the relationship between reading performance
and socio-economic background of students and schools ...
165
table IV.2.4a Within- and between-school variation in reading performance and variation explained by school governance ...166
table IV.2.4b Relationships between school governance and reading performance
...168
table IV.2.4c Relationships between school governance and reading performance, accounting for students’
and schools’ socio-economic and demographic background ...169
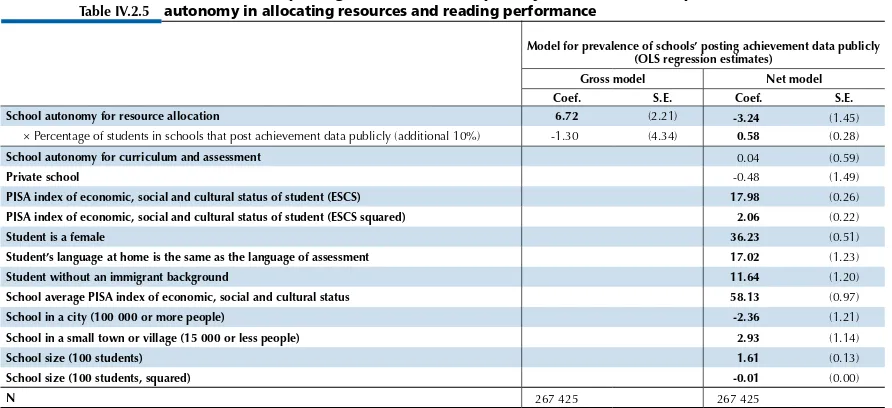
table IV.2.5
Ratio of schools’ posting achievement data publicly and the relationship between school autonomy
in allocating resources and reading performance ...171
table IV.2.6
likelihood of attending schools competing for students in the same area ...171
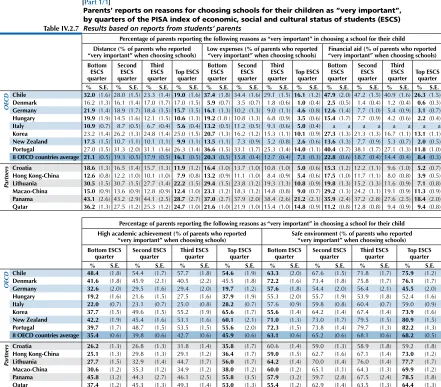
table IV.2.7
Parents’ reports on reasons for choosing schools for their children as “very important”, by quarters of the PISA index
of economic, social and cultural status of students (eScS) ...172
table IV.2.8
Systems’ school competition rates and the relationship between reading performance and socio-economic background
of students and schools ...172
table IV.2.9a Within- and between-school variation in reading performance and variation explained by schools’ assessment
and accountability policies
...173
table IV.2.9b Relationships between schools’ assessment and accountability policies and reading performance...174
table IV.2.9c Relationships between schools’ assessment and accountability policies and reading performance, accounting
for students’ and schools’ socio-economic and demographic background
...175
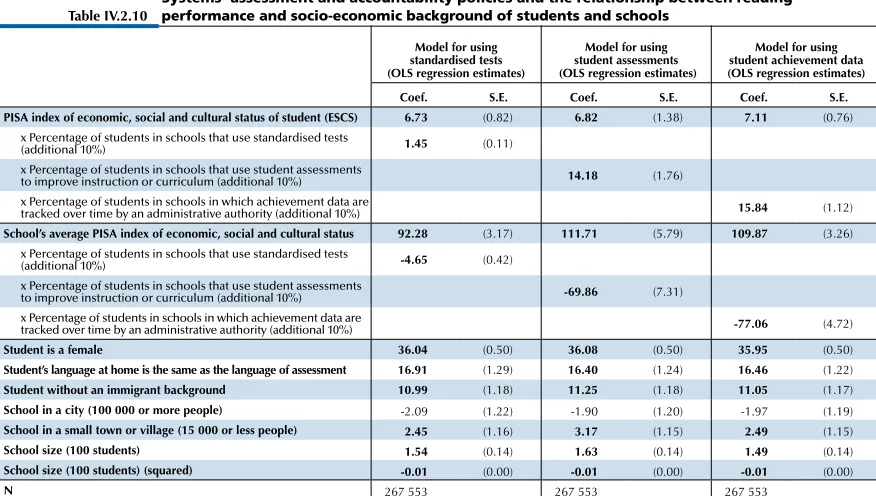
table IV.2.10 Systems’ assessment and accountability policies and the relationship between reading performance
and socio-economic background of students and schools ...177
table IV.2.11 Relationship between schools’ average PISA index of economic, social and cultural status and school resources
...178
PISA 2009 ReSultS: WhAt MAkeS A School SucceSSful? – VoluMe IV ©OECD 2010
11
t
able IV.2.12b Relationships between resources invested in education and reading performance
...180
table IV.2.12c Relationships between resources invested in education and reading performance, accounting for students’
and schools’ socio-economic and demographic background
...182
table IV.2.13a Within- and between-school variation in reading performance and variation explained by the learning environment ...185
table IV.2.13b Relationships between the learning environment and reading performance ...
186
table IV.2.13c Relationships between the learning environment and reading performance, accounting for students’
and schools’ socio-economic and demographic background ...
187
table IV.2.14a Within- and between-school variation in reading performance and variation explained jointly by student
and school characteristics ...
189
table IV.2.14b Relationships between reading performance and students’ reading engagement and approaches to learning,
the learning environment, resources, policies and practices ...
190
table IV.2.14c Relationships between reading performance and students’ reading engagement and approaches to learning,
the learning environment, resources, policies and practices, accounting for students’ and schools’
socio-economic and demographic background ...195
table IV.3.1
Vertical differentiation of school systems
...201
table IV.3.2a horizontal differentiation of school systems ...
203
table IV.3.2b School admittance policies...
204
table IV.3.2c School admittance policies, by lower or upper secondary level of education
...207
table IV.3.3a horizontal differentiation at the school level: school transfer policies ...
209
table IV.3.3b horizontal differentiation at the school level: school transfer policies, by lower or upper secondary level
of education ...
210
table IV.3.4
horizontal differentiation at the school level: ability grouping and reading performance ...212
table IV.3.5
Index of school responsibility for resource allocation and reading performance, by national quarters of this index
...213
table IV.3.6
Index of school responsibility for curriculum and assessment and reading performance, by national quarters
of this index
...216
table IV.3.7
School choice: system level ...
219
table IV.3.8a School choice: school level ...
222
table IV.3.8b School choice, by lower or upper secondary level of education
...223
table IV.3.9
Percentage of students and performance in reading, mathematics and science, by type of school ...
224
table IV.3.10 Assessment practices ...227
table IV.3.11 evaluation and accountability: system level
...229
table IV.3.12 Assessment purposes ...
230
table IV.3.13 use of achievement data for accountability purposes ...231
table IV.3.14 School accountability to parents
...232
table IV.3.15 Schools’ methods for monitoring teachers’ practices ...
233
table IV.3.16a Students’ learning time at school ...
234
table IV.3.16b Students’ learning time at school, by lower or upper secondary level of education
...235
table IV.3.17a Percentage of students attending after-school lessons, by enrichment or remedial lessons ...236
table IV.3.17b Percentage of students attending after-school lessons, by hours per week ...237
table IV.3.18 Percentage of students attending pre-primary education
...239
table IV.3.19 Index of schools’ extra-curricular activities and reading performance, by national quarters of this index ...240
table IV.3.20 Index of teacher shortage and reading performance, by national quarters of this index ...242
table IV.3.21a teachers’ salaries: system level
...244
table IV.3.21b cumulative expenditure by educational institutions: system level ...245
table IV.3.21c GDP per capita: system level ...246
table IV.3.22 class size for the language of instruction lessons
...247
table IV.3.23 Index of quality of schools’ educational resources and reading performance, by national quarters of this index ...248
t
able IV.4.1
Index of teacher-student relations and reading performance, by national quarters of this index
...251
table IV.4.2
Index of disciplinary climate and reading performance, by national quarters of this index ...
253
table IV.4.3
Index of teachers’ stimulation of students’ reading engagement and reading skills and performance,
by national quarters of this index ...
255
table IV.4.4
Index of student-related factors affecting school climate and reading performance, by national quarters of this index ...257
table IV.4.5
Index of teacher-related factors affecting school climate and reading performance, by national quarters of this index
...259
table IV.4.6
Parents’ involvement in schools ...
261
table IV.4.7
Parents’ expectations for higher academic standards
...262
table IV.4.8
Index of school principal’s leadership and reading performance, by national quarters of this index ...263
table IV.4.9
correlations among six learning environment indices...
266
table S.IV.a
School admittance policies...
268
table S.IV.b
horizontal differentiation at the school level: school transfer policies
...271
table S.IV.c
horizontal differentiation at the school level: ability grouping and reading performance ...272
table S.IV.d
Index of school responsibility for curriculum and assessment and reading performance, by national quarters
of this index ...
273
table S.IV.e
School choice: school level
...275
table S.IV.f
Percentage of students and performance in reading, mathematics and science, by type of school ...
276
table S.IV.g
Assessment practices ...279
table S.IV.h
use of achievement data for accountability purposes
...281
table S.IV.i
School accountability to parents ...
282
table S.IV.j
Students’ learning time at school and percentage of students attending after-school lessons, by remedial
or enrichment lessons...
283
table S.IV.k
Percentage of students attending pre-primary education ...284
table S.IV.l
Index of schools’ extra-curricular activities and reading performance, by national quarters of this index ...
285
table S.IV.m Index of quality of schools’ educational resources and reading performance, by national quarters of this index ...287
table S.IV.n
Index of teacher-student relations and reading performance, by national quarters of this index
...289
table S.IV.o
Index of disciplinary climate and reading performance, by national quarters of this index ...
291
table S.IV.p
Index of student-related factors affecting school climate and reading performance, by national quarters of this index ...293
table S.IV.q
Index of teacher-related factors affecting school climate and reading performance, by national quarters of this index
...295
PISA 2009 ReSultS: WhAt MAkeS A School SucceSSful? – VoluMe IV ©OECD 2010
13
Since school is where most learning happens, what happens in school has a direct impact on learning. In turn, what
happens in school is influenced by the resources, policies and practices approved at higher administrative levels in
a country’s education system.
Successful school systems – those that perform above average and show below-average socio-economic inequalities –
provide all students, regardless of their socio-economic backgrounds, with similar opportunities to learn.
Systems that show high performance and an equitable distribution of learning outcomes tend to be comprehensive,
requiring teachers and schools to embrace diverse student populations through personalised educational pathways.
In contrast, school systems that assume that students have different destinations with different expectations and
differentiation in terms of how they are placed in schools, classes and grades often show less equitable outcomes
without an overall performance advantage.
earlier PISA assessments showed these expectations to be mirrored in how students perceived their own educational
future. the results of these differences can also be seen in the distribution of student performance within countries
and in the impact that socio-economic background has on learning outcomes:
•
In countries, and in schools within countries, where more students repeat grades, overall results tend to be worse.
•
In countries where more students repeat grades, socio-economic differences in performance tend to be wider,
suggesting that people from lower socio-economic groups are more likely to be negatively affected by grade
repetition.
•
In countries where 15-year-olds are divided into more tracks based on their abilities, overall performance is not
enhanced, and the younger the age at which selection for such tracks first occurs, the greater the differences in
student performance, by socio-economic background, by age 15, without improved overall performance.
•
In school systems where it is more common to transfer weak or disruptive students out of a school, performance
and equity both tend to be lower. Individual schools that make more use of transfers also perform worse in some
countries.
Most successful school systems grant greater autonomy to individual schools to design curricula and establish assessment
policies, but these school systems do not necessarily allow schools to compete for enrolment.
the incentive to deliver good results for all students is not just a matter of how a school’s student body is
defined. It also depends on the ways in which schools are held accountable for their results and what forms of
autonomy they are allowed to have – and how that could help influence their performance. PISA has looked at
accountability both in terms of the information that is made available about performance and in terms of the use
made of that information – whether by administrative authorities through rewards or control systems, or by the
parents, for example through their choice of school. thus the issues of autonomy, evaluation, governance and
choice interact in providing a framework in which schools are given the incentives and the capacity to improve.
PISA 2009 finds that:
•
In countries where schools have greater autonomy over what is taught and how students are assessed, students
tend to perform better.
•
Within countries where schools are held to account for their results through posting achievement data publicly,
schools that enjoy greater autonomy in resource allocation tend to do better than those with less autonomy.
however, in countries where there are no such accountability arrangements, the reverse is true.
•
countries that create a more competitive environment in which many schools compete for students do not
systematically produce better results.
•
Within many countries, schools that compete more for students tend to have higher performance, but this is
often accounted for by the higher economic status of students in these schools. Parents with a higher
socio-economic status are more likely to take academic performance into consideration when choosing schools.
•
In countries that use standards-based external examinations, students tend to do better overall, but there is no
clear relationship between performance and the use of standardised tests or the public posting of results at the
school level. however, performance differences between schools with students of different social backgrounds
are, on average, lower in countries that use standardised tests.
After accounting for the socio-economic and demographic profiles of students and schools, students in OECD countries
who attend private schools show performance that is similar to that of students enrolled in public schools.
on average, economically disadvantaged parents are over 13 percentage points more likely than
socio-economically advantaged parents to report that they consider “low expenses” and “financial aid” as very important
determinants in choosing a school. If children from socio-economically disadvantaged backgrounds cannot attend
high-performing schools because of financial constraints, then school systems that offer parents more choice of
schools for their children will necessarily be less effective in improving the performance of all students.
School systems considered successful spend large amounts of money on education, and tend to prioritise teachers’ pay
over smaller classes.
School systems differ in the amount of time, human, material and financial resources they invest in education.
equally important, school systems also vary in how these resources are spent:
•
At the level of the school system and net of the level of national income, PISA shows that higher teachers’ salaries,
but not smaller class sizes, are associated with better student performance. teachers’ salaries are related to class
size in that if spending levels are similar, school systems often make trade-offs between smaller classes and higher
salaries for teachers. the findings from PISA suggest that systems prioritising higher teachers’ salaries over smaller
classes tend to perform better, which corresponds with research showing that raising teacher quality is a more
effective route to improved student outcomes than creating smaller classes.
•
Within countries, schools with better resources tend to do better only to the extent that they also tend to have
more socio-economically advantaged students. Some countries show a strong relationship between schools’
resources and their socio-economic and demographic background, which indicates that resources are inequitably
distributed according to schools’ socio-economic and demographic profiles.
PISA 2009 ReSultS: WhAt MAkeS A School SucceSSful? – VoluMe IV ©OECD 2010
15
In more than half of all OECD countries, over 94% of 15-year-old students reported that they had attended pre-primary
schools for at least some time.
Students who had attended pre-primary school tend to perform better than students who have not. this advantage is
greater in school systems where pre-primary education lasts longer, where there are smaller pupil-to-teacher ratios
at the pre-primary level and where there is higher public expenditure per pupil at that level of education. Across
all participating countries, school systems with a higher proportion of students who had attended pre-primary
education tend to perform better.
Schools with better disciplinary climates, more positive behaviours among teachers and better teacher-student relations
tend to achieve higher scores in reading.
Across oecD countries, 81% of students report that they feel they can work well in class most of the time, 71%
report that they never, or only in some classes, feel that other students don’t listen, and 72% say that their teacher
never, or only in some lessons, has to wait a long time before students settle down to learn.
PISA 2009 ReSultS: WhAt MAkeS A School SucceSSful? – VoluMe IV ©OECD 2010
17
The PISA SurveyS
Are students well prepared to meet the challenges of the future? can they analyse, reason and communicate
their ideas effectively? have they found the kinds of interests they can pursue throughout their lives as productive
members of the economy and society? the oecD Programme for International Student Assessment (PISA) seeks to
answer these questions through its triennial surveys of key competencies of 15-year-old students in oecD member
countries and partner countries/economies. together, the group of countries participating in PISA represents nearly
90% of the world economy.
1PISA assesses the extent to which students near the end of compulsory education have acquired some of the
knowledge and skills that are essential for full participation in modern societies, with a focus on reading, mathematics
and science.
PISA has now completed its fourth round of surveys. following the detailed assessment of each of PISA’s three main
subjects – reading, mathematics and science – in 2000, 2003 and 2006, the 2009 survey marks the beginning of
a new round with a return to a focus on reading, but in ways that reflect the extent to which reading has changed
since 2000, including the prevalence of digital texts.
PISA 2009 offers the most comprehensive and rigorous international measurement of student reading skills to date.
It assesses not only reading knowledge and skills, but also students’ attitudes and their learning strategies in reading.
PISA 2009 updates the assessment of student performance in mathematics and science as well.
the assessment focuses on young people’s ability to use their knowledge and skills to meet real-life challenges. this
orientation reflects a change in the goals and objectives of curricula themselves, which are increasingly concerned
with what students can do with what they learn at school and not merely with whether they have mastered specific
curricular content. PISA’s unique features include its:
•
Policy orientation, which connects data on student learning outcomes with data on students’ characteristics and
on key factors shaping their learning in and out of school in order to draw attention to differences in performance
patterns and identify the characteristics of students, schools and education systems that have high performance
standards.
•
Innovative concept of “literacy”, which refers to the capacity of students to apply knowledge and skills in key
subject areas and to analyse, reason and communicate effectively as they pose, interpret and solve problems in
a variety of situations.
•
Relevance to lifelong learning, which does not limit PISA to assessing students’ competencies in school subjects,
but also asks them to report on their own motivations to learn, their beliefs about themselves and their learning
strategies.
•
Regularity, which enables countries to monitor their progress in meeting key learning objectives.
the relevance of the knowledge and skills measured by PISA is confirmed by studies tracking young people in the
years after they have been assessed by PISA. longitudinal studies in Australia, canada and Switzerland display
a strong relationship between performance in reading on the PISA assessment at age 15 and future educational
attainment and success in the labour-market (see Volume I, chapter 2).
3the frameworks for assessing reading, mathematics and science in 2009 are described in detail in
PISA 2009
Assessment Framework: Key Competencies in Reading, Mathematics and Science (oecD, 2009a).
Decisions about the scope and nature of the PISA assessments and the background information to be collected are
made by leading experts in participating countries. Governments guide these decisions based on shared,
policy-driven interests. considerable efforts and resources are devoted to achieving cultural and linguistic breadth and
balance in the assessment materials. Stringent quality-assurance mechanisms are applied in designing the test, in
translation, sampling and data collection. As a result, PISA findings are valid and highly reliable.
Policy makers around the world use PISA findings to gauge the knowledge and skills of students in their own country
in comparison with those in other countries. PISA reveals what is possible in education by showing what students in
the highest performing countries can do in reading, mathematics and science. PISA is also used to gauge the pace of
educational progress, by allowing policy makers to assess to what extent performance changes observed nationally
are in line with performance changes observed elsewhere. In a growing number of countries, PISA is also used to set
policy targets against measurable goals achieved by other systems, to initiate research and peer-learning designed to
identify policy levers and to reform trajectories for improving education. While PISA cannot identify cause-and-effect
relationships between inputs, processes and educational outcomes, it can highlight key features in which education
systems are similar and different, sharing those findings with educators, policy makers and the general public.
THE FIRST REPORT FROM THE 2009 ASSESSMENT
this volume is the fourth of six volumes that provide the first international report on results from the PISA 2009
assessment. It explores the relationships between student-, school- and system-level characteristics, and educational
quality and equity. It explores what schools and school policies can do to raise overall student performance and,
at the same time, moderate the impact of socio-economic background on student performance, with the aim of
promoting a more equitable distribution of learning opportunities.
the other volumes cover the following issues:
•
Volume I, What Students Know and can Do: Student Performance in Reading, Mathematics and Science, summarises
the performance of students in PISA 2009. It provides the results for reading in the context of how performance is
defined, measured and reported, and then examines what students are able to do in reading. After a summary
of reading performance, it examines the ways in which this performance varies on subscales representing three
aspects of reading. It then breaks down results by different formats of reading texts and considers gender differences
in reading, both generally and for different reading aspects and text formats. Any comparison of the outcomes of
education systems needs to take into consideration countries’ social and economic circumstances and the resources
they devote to education. to address this, the volume also interprets the results within countries’ economic and
social contexts. the volume concludes with a description of student results in mathematics and science.
•
Volume II,
Overcoming Social Background: Equity in Learning Opportunities and Outcomes, starts by closely
examining the performance variation shown in Volume I, particularly the extent to which the overall variation in
student performance relates to differences in results achieved by different schools. the volume then looks at how
factors such as socio-economic background and immigrant status affect student and school performance, and the
role that education policy can play in moderating the impact of these factors.
•
Volume III, Learning to Learn: Student Engagement, Strategies and Practices, explores information gathered on
students’ levels of engagement in reading activities and attitudes towards reading and learning. It describes
15-year-olds’ motivations, engagement and strategies to learn.
•
Volume V,
Learning Trends: Changes in Student Performance Since 2000, provides an overview of trends in
student performance in reading, mathematics and science from PISA 2000 to PISA 2009. It shows educational
outcomes over time and tracks changes in factors related to student and school performance, such as student
background and school characteristics and practices.
PISA 2009 ReSultS: WhAt MAkeS A School SucceSSful? – VoluMe IV ©OECD 2010
19
Box IV.A
Key features of PISA 2009
Content
•
the main focus of PISA 2009 was reading. the survey also updated performance assessments in mathematics
and science. PISA considers students’ knowledge in these areas not in isolation, but in relation to their ability to
reflect on their knowledge and experience and to apply them to real-world issues. the emphasis is on mastering
processes, understanding concepts and functioning in various contexts within each assessment area.
•
for the first time, the PISA 2009 survey also assessed 15-year-old students’ ability to read, understand and
apply digital texts.
Methods
•
Around 470 000 students completed the assessment in 2009, representing about 26 million 15-year-olds in
the schools of the 65 participating countries and economies. Some 50 000 students took part in a second
round of this assessment in 2010, representing about 2 million 15-year-olds from 10 additional partner
countries and economies.
•
each participating student spent two hours carrying out pencil-and-paper tasks in reading, mathematics and
science. In 20 countries, students were given additional questions via computer to assess their capacity to
read digital texts.
•
the assessment included tasks requiring students to construct their own answers as well as multiple-choice
questions. the latter were typically organised in units based on a written passage or graphic, much like the
kind of texts or figures that students might encounter in real life.
•
Students also answered a questionnaire that took about 30 minutes to complete. this questionnaire focused
on their background, learning habits, attitudes towards reading, and their involvement and motivation.
•
School principals completed a questionnaire about their school that included demographic characteristics
and an assessment of the quality of the learning environment at school.
Outcomes
PISA 2009 results provide:
•
a profile of knowledge and skills among 15-year-olds in 2009, consisting of a detailed profile for reading
and an update for mathematics and science;
•
contextual indicators relating performance results to student and school characteristics;
•
an assessment of students’ engagement in reading activities, and their knowledge and use of different
learning strategies;
•
a knowledge base for policy research and analysis; and
•
trend data on changes in student knowledge and skills in reading, mathematics, science, changes in student
attitudes and socio-economic indicators, and in the impact of some indicators on performance results.
Future assessments
•
the PISA 2012 survey will return to mathematics as the major assessment area, PISA 2015 will focus on
science. thereafter, PISA will turn to another cycle beginning with reading again.
•
future tests will place greater emphasis on assessing students’ capacity to read and understand digital texts
and solve problems presented in a digital format, reflecting the importance of information and computer
technologies in modern societies.
All data tables referred to in the analysis are included at the end of the respective volume. A Reader’s Guide is also
provided in each volume to aid in interpreting the tables and figures accompanying the report.
The PISA STudenT PoPuLATIon
In order to ensure the comparability of results across countries, PISA devoted a great deal of attention to assessing
comparable target populations. Differences between countries in the nature and extent of pre-primary education and
care, in the age of entry to formal schooling, and in the structure of the education system do not allow school grade
levels to be defined so that they are internationally comparable. Valid international comparisons of educational
performance, therefore, need to define their populations with reference to a target age. PISA covers students who
are aged between 15 years 3 months and 16 years 2 months at the time of the assessment and who have completed
at least 6 years of formal schooling, regardless of the type of institution in which they are enrolled, whether they
are in full-time or part-time education, whether they attend academic or vocational programmes, and whether they
attend public or private schools or foreign schools within the country. (for an operational definition of this target
population, see the
PISA 2009 Technical Report
[oecD, forthcoming].) the use of this age in PISA, across countries
and over time, allows the performance of students to be compared in a consistent manner before they complete
compulsory education.
As a result, this report can make statements about the knowledge and skills of individuals born in the same year who
are still at school at 15 years of age, despite having had different educational experiences, both in and outside school.
Stringent technical standards were established to define the national target populations and to identify permissible
exclusions from this definition (for more information, see the PISA website
www.pisa.oecd.org
). the overall exclusion rate
within a country was required to be below 5% to ensure that, under reasonable assumptions, any distortions in national
mean scores would remain within plus or minus 5 score points,
i.e.
typically within the order of magnitude of two
standard errors of sampling (see Annex A2). exclusion could take place either through schools that participated or students
who participated within schools. there are several reasons why a school or a student could be excluded from PISA.
•
figure IV.A
•
A map of PISA countries and economies
OECD countries Partner countries and economies in PISA 2009 Partners countries in previous PISA surveys
Australia Japan Albania Mauritius Dominican Republic
Austria korea Argentina Miranda-Venezuela* Macedonia
Belgium luxembourg Azerbaijan Montenegro Moldova
canada Mexico Brazil Netherlands-Antilles*
chile Netherlands Bulgaria Panama
czech Republic New Zealand colombia Peru
Denmark Norway costa Rica* Qatar
estonia Poland croatia Romania
finland Portugal Georgia* Russian federation
france Slovak Republic himachal Pradesh-India* Serbia
Germany Slovenia hong kong-china Shanghai-china
Greece Spain Indonesia Singapore
hungary Sweden Jordan tamil Nadu-India*
Iceland Switzerland kazakhstan chinese taipei
Ireland turkey kyrgyzstan thailand
Israel united kingdom latvia trinidad and tobago
Italy united States liechtenstein tunisia
lithuania uruguay
Macao-china united Arab emirates*
PISA 2009 ReSultS: WhAt MAkeS A School SucceSSful? – VoluMe IV ©OECD 2010
21
S
c
hools might be excluded because they are situated in remote regions and are inaccessible or because they are very
small, or because of organisational or operational factors that precluded participation. Students might be excluded
because of intellectual disability or limited proficiency in the language of the test.
In 29 out of 65 countries participating in PISA 2009, the percentage of school-level exclusions amounted to less
than 1%; it was less than 5% in all countries. When the exclusion of students who met internationally established
exclusion criteria is also taken into account, the exclusion rates increase slightly. however, the overall exclusion
rate remains below 2% in 32 participating countries, below 5% in 60 participating countries, and below 7% in
all countries except luxembourg (7.2%) and Denmark (8.6%). In 15 out of 34 oecD countries, the percentage of
school-level exclusions amounted to less than 1% and was less than 5% in all countries. When student exclusions
within schools are also taken into account, there were 9 oecD countries below 2% and 25 countries below 5%.
Restrictions on the level of exclusions in PISA 2009 are described in Annex A2.
the specific sample design and size for each country aimed to maximise sampling efficiency for student-level estimates.
In oecD countries, sample sizes ranged from 4 410 students in Iceland to 38 250 students in Mexico. countries with
large samples have often implemented PISA both at national and regional/state levels (e.g. Australia, Belgium, canada,
Italy, Mexico, Spain, Switzerland and the united kingdom). this selection of samples was monitored internationally
and adhered to rigorous standards for the participation rate, both among schools selected by the international
contractor and among students within these schools, to ensure that PISA results reflect the skills of 15-year-old students
in participating countries. countries were also required to administer the test to students in identical ways to ensure
that students receive the same information prior to and during the test (for details, see Annex A4).
Notes
1. the GDP of countries that participated in PISA 2009 represents 87% of the 2007 world GDP. Some of the entities represented
in this report are referred to as partner economies. this is because they are not strictly national entities.
2. thirty-one partner countries and economies originally participated in the PISA 2009 assessment and ten additional partner
countries and economies took part in a second round of the assessment.
PISA 2009 ReSultS: WhAt MAkeS A School SucceSSful? – VoluMe IV ©OECD 2010
23
Data underlying the figures
t
he
data referred to in this volume are presented in Annex B and, in greater detail, on the PISA website
(
www.pisa.oecd.org
)
.
five symbols are used to denote missing data:
a the category does not apply in the country concerned. Data are therefore missing.
c there are too few observations or no observation to provide reliable estimates (
i.e.
there are fewer than
30 students or less than five schools with valid data).
m Data are not available. these data were not submitted by the country or were collected but subsequently
removed from the publication for technical reasons.
w Data have been withdrawn or have not been collected at the request of the country concerned.
x Data are included in another category or column of the table.
Country coverage
this publication features data on 65 countries and economies, including all 34 oecD countries and 31 partner
countries and economies (see figure IV.A). the data from another ten partner countries were collected one year
later and will be published in 2011.
the statistical data for Israel are supplied by and under the responsibility of the relevant Israeli authorities.
the use of such data by the oecD is without prejudice to the status of the Golan heights, east Jerusalem and
Israeli settlements in the West Bank under the terms of international law.
Calculating
international averages
An oecD average was calculated for most indicators presented in this report. the oecD average
corresponds
to the arithmetic mean of the respective country estimates.
Readers should, therefore, keep in mind that the term “oecD average” refers to the oecD countries included
in the respective comparisons.
Rounding figures
Because of rounding, some figures in tables may not exactly add up to the totals. totals, differences and
averages are always calculated on the basis of exact numbers and are rounded only after calculation.
All standard errors in this publication have been rounded to one or two decimal places. Where the value 0.00
is shown, this does not imply that the standard error is zero, but that it is smaller than 0.005.
Reporting student data
the report uses “15-year-olds” as shorthand for the PISA target population. PISA covers students who are aged
between 15 years 3 months and 16 years 2 months at the time of assessment and who have completed at least
6 years of formal schooling, regardless of the type of institution in which they are enrolled and of whether
they are in full-time or part-time education, of whether they attend academic or vocational programmes, and
of whether they attend public or private schools or foreign schools within the country.
Reporting school data
Focusing on statistically significant differences
t
his volume discusses only statistically significant differences or changes. these are denoted in darker colours
in figures and in bold font in tables. See Annex A3 for further information.
Abbreviations used in this report
eScS PISA index of economic, social and cultural status
GDP Gross domestic product
ISceD International Standard classification of education
PPP
Purchasing power parity
S.D.
Standard deviation
S.e.
Standard error
Further documentation
for further information on the PISA assessment instruments and the methods used in PISA, see the
PISA 2009
Technical Report
(oecD, forthcoming) and the PISA website (
www.pisa.oecd.org
).
Some Fea
tures Shared
by High-
P
erforming
School Systems
PISA 2009 ReSultS: WhAt MAkeS A School SucceSSful? – VoluMe IV ©OECD 2010
25
How do resources for education, and education policies and practices
Since school is where most learning
takes place, what happens in school has a direct impact on learning. In turn,
what happens in school is influenced by the resources, policies and practices at higher administrative levels within
a country’s education system.
Volume I,
What Students Know and Can Do
, shows that student performance in PISA varies widely in every subject
assessed by PISA. In searching for effective policies to improve learning outcomes, policy makers and educators
need to understand to what extent variation lies between countries, stems from performance differences among
schools within countries, and results from variations in performance among individual students within schools.
this in turn leads to the question of how resources, policies and practices relate to those performance differences
at the level of the education system, at the school level and among individual students; and how those resources,
policies and practices affect the relationship between student performance and the economic and social background
of countries, schools and students. this volume addresses these questions.
this chapter begins with a summary of selected features shared by those education systems that show relatively
high performance levels among their students and a moderate impact of socio-economic background on learning
outcomes. the impact of socio-economic background on performance is used throughout this volume as a measure
of equity in the distribution of learning opportunities within a school system: the less learning outcomes depend
on students’ family context and socio-economic background, the greater the equity.
1chapter 2 examines in greater
detail how resources, policies and practices relate to student performance and to what extent positive relationships
observed at the school level translate into positive relationships at the level of the education system. chapter 3
discusses how PISA describes and measures education resources, policies and practices, and shows where countries
stand on these issues. chapter 4 then describes the learning environment in schools.
performance differenceS among countrieS, SchoolS and StudentS
In the PISA 2009 assessment of reading literacy, 25% of the performance variation observed among students in the
participating countries results from performance differences among countries (see chapter 2 of Volume I,
What
Students Know and Can Do
). Among oecD countries, the corresponding proportion is 11%. countries with higher
national incomes tend to perform better: some 6% of the performance differences among oecD countries can be
predicted on the basis of the countries’ national income (see figure I.2.1 in Volume I); this rises to 30% when the
partner countries and economies that participated in PISA are included. the analysis of the policies and practices at
the level of education systems seeks to explain the performance variation among countries.
2•
Figure IV.1.1
•
How much of the variation in reading performance
lies between countries, schools and students
Source: OECD, PISA 2009 Database.
Variation
in reading performance attributable to differences:
Between countries Within countries
Within-country variation in reading performance attributable to differences:
Between schools Within schools
OECD countries
0 20 40 60 80 100 %
11%
89%
25%
75%
39% 61%
PISA 2009 countries and economies
0 20 40 60 80 100 %
40% 60%
PISA 2009 ReSultS: WhAt MAkeS A School SucceSSful? – VoluMe IV ©OECD 2010
2
7
o
n