Dried
Skeletonema costatum
in Feed Formulation for the Growth of
Vaname Shrimp (
Litopenaeus vannamei
)
Dewi Putri Lestari
1*, Arning W. Ekawati
2, Maftuch
21
Graduate Program, Faculty of Fisheries and Marine Sciences, University of Brawijaya, Malang, Indonesia 2
Faculty of Fisheries and Marine Sciences, University of Brawijaya, Malang, Indonesia
Abstract
The aim of this study was to determine the effect and the best dosage used by the Skeletonema costatum in feed formulation on the growth of Vaname shrimp. This experiment used Completely Randomized Design (CRD) with four treatments and three replications. Treatment was given by using dried S. costatum in feed formula (iso protein 37% and iso energy 3.6 kkal/g feed). Feed treatment was the substitution of fish meal protein A = 0%, B = 2.5%, C = 5% and D = 7.5% with dried S. costatum protein. The observed parameters include Survival Rate (SR), Survival Growth Rate (SGR), Feed Efficiency Ratio (FER), and Protein Efficiency Ratio (PER). The results showed that the use of dried S. costatum in feeding are effective in increasing the specific growth rate, feed efficiency ratio and the ratio of protein efficiency than controls. The best dosage in feeding formula is ranged from 4.39% to 4.75%.
Keywords:feeding formula, Skeletonema costatum, Vaname Shrimp
INTRODUCTION
Vaname shrimp (Litopenaeus vannamei
Boone) is one of the leading commodities of Indonesian fishing industry. This shrimp has high productivity in intensive pond thus many farmers cultivate its as the substitute of tiger shrimp. Vaname shrimp is widely known for its advantages of faster ability in growing than Black Tiger and Stylirostris shrimp. Vaname shrimps also can be stocked at high densities, resistant to wide range of salinity, need lower protein and resistance to diseases [1,2,3].
Diatoms contain essential nutrients and also have an appropriate size as feed for Vaname shrimp. One of a diatoms which commonly used for feed is Skeletonema costatum (Greville) Cleve. The use of diatoms as a natural feed for Vaname shrimp can accelerate its growth in larval stadia. Skeletonema costatum is used as a supplementary food for basic nutrition in cultured Artemia, shrimp larvae and shellfish spat. Nutritional content of S. costatum has been widely studied, which is consisted of 31% protein, 21.5% carbohydrate and 1.3% total fat. In addition, S. costatum also contain fatty acid composition, free amino acids, ß-1, 3 glucan and cell wall polysaccharides [4,5,6].
However, the use of diatom S. costatum in dry form has not been widely used. The glucan
Correspondence author: Dewi Putri Lestari
Email : [email protected]
Address : Faculty of Fisheries and Marine Sciences, University of Brawijaya, Jl. Veteran, Malang, 65145
which also found in diatom acts as an immunostimulant which will enhance the body's resistance of the shrimp. Thus the aim of adding dried S. costatum on Vaname shrimp’s feed formulations are to enhance the growth and productivity by observing the parameter which measures the growth rate of shrimp, e.g. survival, specific growth rate, feed efficiency ratio, and protein efficiency ratio. Observed parameter choosen because related to the feed utilization and growth of the shrimp. This study aimed to determine the best used dose of dried S. costatum in the feed formulation on the growth of Vaname shrimp.
MATERIALS AND METHODS Preparation of Dried S. costatum
Skeletonema costatum was obtained from
Center of Brackish Aquaculture Situbondo, from seawater which were purified repeatedly with pure subsequently cultured in a laboratory-scale stage, semi mass scale and mass scale. Furthermore, S. costatum were dried using an oven in temperature 60°C for 24 hours. The dried
S. costatum analyzed proximately for its drying content using the oven method and its crude protein concentration using the micro kjedahl.
Preparation of feed
Table 1. Composition of experiment feed ingredients for vaname shrimp (Litopenaeus vannamei)
Ingredient
Dried Content
(%)*
Protein (%)*
Fat (%)*
Ash Content (%)*
Rugged fiber
(%)* BETN**
Energy (kkal/gr)***
Fish meal* 92.19 56.86 6.12 28.7 4.91 3.41 296.16
Shrimp meal* 92.20 50.36 4.33 1.33 8.94 35.04 380.55
S. costatum meal* 87.38 24.70 2.22 55.55 1.04 16.49 184.74
Soybean flour* 91.74 45.65 0.14 7.90 4.23 42.08 352.18
Tapioca flour* 87.19 0.09 0.02 0.06 1.01 98.82 398.82
Description :
* : Result analysis of Laboratory Nutrition and Feed, Faculty of Animal Husbandry, University of Brawijaya ** : BETN = 100 – Protein – Fat – Ash content – Rugged fiber
*** : Energy = (4 x %Protein) + (9 x %Fat) + (4 x %BETN)
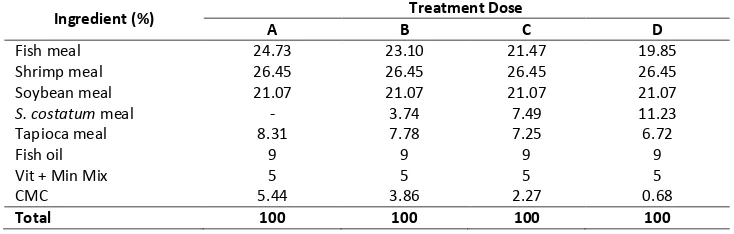
Table 2. Experiment feed formula of Vaname shrimp (Litopenaeus vannamei)
Ingredient (%) Treatment Dose
A B C D
Fish meal 24.73 23.10 21.47 19.85
Shrimp meal 26.45 26.45 26.45 26.45
Soybean meal 21.07 21.07 21.07 21.07
S. costatum meal - 3.74 7.49 11.23
Tapioca meal 8.31 7.78 7.25 6.72
Fish oil 9 9 9 9
Vit + Min Mix 5 5 5 5
CMC 5.44 3.86 2.27 0.68
Total 100 100 100 100
Description :
A = S. costatum meal protein substitution on fish meal protein 0% B = S. costatum meal protein substitution on fish meal protein 2.5% C = S. costatum meal protein substitution on fish meal protein 5% D = S. costatum meal protein substitution on fish meal protein 7.5%
Based on the proximate data of feed’s constituent material (Table 1), the feed formulation is determined by worksheet method. Feed formulations based on the isoprotein 37% and isoenergi 3.6 kcal.g-1. The treatments were protein substitution of fish meal to S. costatum
meal (Table 2). All the materials were weighed according to the formulation and mixed until it reached its homogeneity. Homogenate were molded and dried in an oven on the temperature of 30°C for 1 day. Feeds of Vaname shrimp were made in pellets form in 0.55 mm size.
Biological Trials (In vivo)
Biological test of feeding experiments on Vaname shrimp (Litopenaeus vannamei) were conducted for 30 days. Each treatment was repeated three times. Control diet without using
S. costatum meal, compared with three feed
formulas that use S. costatum meal as the independent variable. The four treatments of feed formulations observed to assess its effect on survival rate (SR), specific growth rate (SGR), feed efficiency ratio (FER), and protein efficiency ratio (PER), which is referred as dependent variable.
This study used Vaname shrimp (Litopenaeus
vannamei) in juvenile stadia with weight
6.41±0.55 g per shrimp, derived from Center of Brackish Aquaculture Situbondo. The Vaname shrimps were maintained in an aquarium sized 45x45x45 cm3 volume of 71 liters filled with sea water and the range of the salinity for 33-34 ppt. The outer surface of aquarium was covered with black plastic to imitate the real habitat of the shrimps. The aeration was also included in the aquarium.
Measurement of water quality during the study include temperature, DO (Dissolved oxygen), pH and salinity which was done every day in the morning and evening. Otherwise, amonial content was measured at the beginning and end of the study.
Data analysis
Data were analyzed using SPSS 21.0 version with one way ANOVA test. The analysis was used to examine the effect of treatment, continued to Least Significant Difference (LSD) test with Duncan test method. This test followed by the analysis of orthogonal polynomials to get the best treatment value.
Survival Rate (SR)
Survival of Vaname shrimp (L. vannamei) is calculated using the formula [8]:
SR =
x
100
%
No
Nt
Description: SR = Survival Rate
Nt = Final number of shrimp No = Initial number of shrimp
Survival Growth Rate (SGR)
Observations growth of vannamei shrimp
(L.vannamei) was done by weighing once every
10 days. Specific growth rate [9] can be
calculated using the formula:
SGR =
ln
ln
x
100
%
t
Wo
Wt
Description:
SGR = Survival Growth Rate (%BW/day)
Wt
= Average final weight of individual (gram)Wo = Average initial weight of individual (gram)
t = Time (days)
Feed Efficiency Ratio (FER)
Feed Efficiency Ratio was calculated by comparing the average final weight after
reducing the initial average weight of shrimp
compared to the amount of feed (dry weight of
feed) using the formula [10]:
F
Wo
Wt
FER
(
)
Description:
FER = Feed Efficiency Ratio
F = the amount of given feed (gram)
Wt
= Average final weight of individual (gram)Wo = Average initial weight of individual (gram)
Protein Efficiency Ratio (PER)
Protein Efficiency Ratio [9] calculated using the formula:
PER =
)
(
FxPf
Wo
Wt
Description:
PER = Protein Efficiency Ratio F = the amount of given feed (gram)
Wt
= Average final weight of individual (gram)Wo
= Average initial weight of individual (gram) Pf = Protein content in feed (%)RESULT AND DISCUSSION
The Survival Rate (SR), Specific Growth Rate (SGR), Feed Efficiency Ratio (FER) and Protein Efficiency Ratio (PER) on Vaname shrimp can be seen in Table 3. The results of one-way ANOVA showed that survival rate of Vaname shrimp is not significantly different between treatments (P>0.05). It indicates that the use of S. costatum
meal in the feed formulation does not cause a negative response to the survival rate of Vaname shrimp.
Factors affecting survival rate are abiotic factors such as the adaptation ability to the environment, human handling, stocking density, competitors, age and the presence of predators. High stocking density would result lower survival due to cannibalism. The range of the water quality values showed in Table 4.
Table 3. Value parameters each treatment
Parameters Treatment
A B C D
SR (%) 77.78±4.81a 86.11±4.82a 88.89±4.82a 88.89±4.82a
SGR (%BW.day-1) 0.71±0.01a 1.09±0.01c 1.21±0.05d 0.93±0.01b
FER (%) 8.22±0.35a 12.88±0.26c 14.74±0.76d 11.09±0.01b
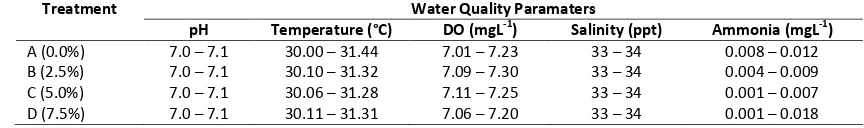
Table 4. Water Quality of Vaname shrimp’s Aquaculture during the study
Treatment Water Quality Paramaters
pH Temperature (°C) DO (mgL-1) Salinity (ppt) Ammonia (mgL-1)
A (0.0%) 7.0 – 7.1 30.00 – 31.44 7.01 – 7.23 33 – 34 0.008 – 0.012 B (2.5%) 7.0 – 7.1 30.10 – 31.32 7.09 – 7.30 33 – 34 0.004 – 0.009 C (5.0%) 7.0 – 7.1 30.06 – 31.28 7.11 – 7.25 33 – 34 0.001 – 0.007 D (7.5%) 7.0 – 7.1 30.11 – 31.31 7.06 – 7.20 33 – 34 0.001 – 0.018
Table 5. Water Quality References
Parameters Water Quality Value
Study References
pH 7.0 – 7.1 6.8 - 8.7 [15]
Temperature (0C) 30.00 – 31.44 27 - 32 [16]
DO (mgL-1) 7.01 – 7.30 > 3 [16]
Salinity (ppt) 33 – 34 33-35 [17]
ammonia (mgL-1) 0.001 – 0.018 > 0.01 [18]
Based on statistical analysis the water quality does not significantly affect the value of each treatment. The values of the parameters of water quality during the maintenance are in the normal range, accordance with other studies in Table 5.
Other factors that may increase the survival rate during the culture is Vaname shrimp’s feed quality and feeding level so that the feed requirements can be met without any competition. Frequency of feeding behavior of vaname shrimp was also noted by de Lima et al.
[11] indicating that feeding can affect the activity of shrimp itself. In the natural ecosystem, they generally actively feed at night, therefore the shrimp included in the group of nocturnal animals. This is supported by Kordi [12], feeding were given gradually, but more frequent. Thus the shrimp are not quickly satisfied and the shrimp’s appetite is maintained.
The relationship between the amounts of substitution S. costatum meal protein to fish meal protein (x) with survival (y1) showed in the equation:
y1 = -0.333x2 + 3.944x + 77.91; R2 = 0.57.
The highest known value is 88.98% survival rate with the best dose of 5.92% S. costatum
meal to fish meal in the feed formula. According to Suwoyo and Mangampa [13], the increase of average weight of biota which is kept in line with the duration of maintenance can lead to the decrease of the individual specific growth rate. The difference in the growth rate could be due to the differences in the initial size and density of shrimp which were stocked, quality and quantity of feed, maintenance duration and cultivation containers which were used.
The relationship between the amounts of substitution S. costatum meal protein to fish
meal protein (x) with survival growth rate (y2), showed in the equation:
y2= -0.026x2 + 0.231x + 0.698; R2 = 0.98
The best value obtained from the treatment at a dose of S. costatum meal protein substitution by 4.44% in feed formula with a specific growth rate of 1.21% BW.day-1. Feed efficiency ratio indicates that better utilization of feed and absorbed feed by the body increase the growth. The increasing feed efficiency values were caused by high nutrient that can be optimally utilized by the body.
The relationship between the amounts of substitution S. costatum meal protein to fish meal protein (x) with feed efficiency ratio (y3) showed in the following equation:
y3 = -0.008x2 + 0.076x + 0.215; R2 = 0.95
The best dosage is 4.39% with a value of feed efficiency ratio 14.47%. The degree of protein efficiency ratio proteins is influenced by the quality of the feed. The higher the protein efficiency ratio values of feed protein quality the better it will be to increase the growth rate of shrimp. According to Buwono [14], protein quality of food is determined by the particular amino acid content of essential amino acids (arginine, histidine, isoleucine, leucine, lysine, methionine, phenylalanine, threonine, trypto-phan and valine).
The relationship between the amounts of substitution S. costatum meal protein to fish meal protein (x) with protein efficiency ratio (y4) showed in the equation below. The best dose is 4.75% with a protein efficiency ratio 0.40.
CONCLUSION shrimp renged 4.39% - 4.75% in feed formula.
REFERENCES
[1] Briggs, M., S.F. Smith, R. Subanghae, M. Phillips. 2004. Introduction and movement of Penaeus vannamei and P. stilyrostis in Asia and Pacific. FAO. 40p.
[2] Widodo, R.H., A.S. Dian. 2005. Shrimp vannamei: cultivation and market prospects disease resistance of white shrimp. Penebar Swadaya. Jakarta. 75p.
[3] Nur'aini, Y. L., H. Bambang, S. Subyakto, T. Gemi., 2007. Active surveilance of infectious myonecrosis virus (IMNV) in pond-cultured white shrimp (Litopenaeus vannamei) in East Java and Bali. Jurnal Perikanan UGM. IX (1). 25-31.
[4] Granum, E., S., Kirkvold, S. M. Myklestad. 2002. Cellular and extracellular production of carbohydrate and amino acid by the marine diatom Skeletonema costatum: diel variations and effects of N depletion. Mar. Ecol. Prog. Ser. 242. 83-94.
[5] Monkonsit, S., S. Powtongsook, P. Pavasant. 2011. Comparison between airlift photobio-reactor and bubble column for Skeletonema costatum cultivation. Eng. J. 15(4). 53-64. [6] Widiastuti, R., J. Hutabarat, V.E. Herawati.
2012. Effect of feeding different natural
(Skeletonema costatum and Chaetoceros
gracilis) to absolute biomass growth and nutrient content of local Artemia sp. J.
Aquacult. Manage. Technol. 1 (1). 236-248.
[7] AOAC. 1995. Official methods of analysis 12th Ed. Association of Official Analytical Chemists. Washington DC. 114p.
[8] Degani, G., D. Levanon. 1983. The influence of low density on food adaptation, cannibalism and growth of eels (Anqullia
anquilla). Migal. Galilee Technological
Center, Kiriat Shmona. Israel. 8p.
[9] De silva, S.S., T.A. Anderson. 1994. Fish nutrition in aquaculture. Chapman and Hall. London, UK. 319p.
[10] Li, M.H., E.H. Robinson, C.S. Tucker, B.B Manning, L. Khoo. 2009. Effect of dried algae Schizochytrium sp., a rich source of
docosahexaenoic acid, on growth, fatty acid composition, and sensory quality of channel catfish Ictalurus punctatus. Aquaculture.
292. 232-236
[11] de Lima, P.P., C.S. Pontes, M. de Fátima Arruda. 2009. Activity pattern of the marine shrimp Litopenaeus vannamei (Boone 1931) in laboratory as a function of different feeding frequencies. Aquac. Res. 1-8. [12] Kordi, M.G.H. 2010. Cultivation of catfish in
tank Tarpaulins. Andi Publisher. Yogyakarta. 114p.
[13] Suwoyo, H.S., M. Mangampa. 2010. Probiotics application with different concentration on maintenance Vaname Shrimp (Litopenaeus vannamei). Proceeding of Forum on Aquaculture Technology Inovation. 239-247.
[14] Buwono, I.D. 2000. Essential need of Amino Acid in fish Ransum. Kanisius. Yogyakarta. 56p.
[15] Ramanathan, N., P. Padmavathy, T. Francis, S. Athithian, N. Selvaranjitham. 2005. Manual on polyculture of tiger shrimp and carps in freshwater. Tamil Nadu Veterinary and Animal Science University, Fisheries College and Research Institute. Thothukudi. 1-161.
[16] Suprapto. 2005. Vannamei shrimp
(Litopenaeus vannamei) cultivation
techniques manual. CV Biotirta. Bandar Lampung. 25 p.
[17] Komaraeidjaja, W. 2003. Effect of application of microbial consortium of nitrifying the ammonia concentration (NH3) in the case of pond water: In Grinting village of Brebes. J. Tech. Env. P3TL-BPPT. 4(2). 62-67.
[18] Taqwa, F.H., M. Fitrani, B.T. Esto. 2012. Performance of post-larval shrimp vaname
(Litopenaeus vannamei) in various long