Jurnal Manajemen Transportasi & Logistik (JMTranslog) - Vol. 03 No. 1, Maret 2016 1
The Customer Loyalty
of Patas Purwakarta
Train Service Users
Muhamad Sapta Riyaldi Amrizal Tiur Merry Bunga Silalahi
STMT Trisakti STMT Trisakti STMT Trisakti
[email protected] [email protected] [email protected]
ABSTRACT
The aim of this research is to ind out the inluence of service quality, ticket price, and customer satisfaction to the customer loyalty. It is a quantitative research using the data analysis method of Path Analysis. The results indicate that both variables of Service Quality (X1) and Ticket Price (X2) have a signiicant direct inluence to the variable of Customer Satisfaction (Y1), whereas the variable of customer satisfaction has a signiicant indirect inluence to the variable of Customer Loyalty (Y2) [through intervening the variable of customer satisfaction]. It is found in a sequence that the variables most inluential to the increase of Customer Loyalty are: Service Quality, Customer Satisfaction, and the Ticket Price in the last rank. The results of path analysis indicate that service quality can directly inluence the customer loyalty. It can be optimistically improved as maximal as possible through 5 factors having positive inluences in enhancing customer loyalty. Meanwhile, Ticket Price still indirectly inluences the customer loyalty and it can pesimistically still be enhanced through the policy on tariff and it is dificult to implement, only can be driven if the ticket price provided by the transport service provider is more competitive and more various as well as affordable for the consumer purchase power of that transport sevice.
Jurnal Manajemen Transportasi & Logistik (JMTranslog) - Vol. 03 No. 1, Maret 2016 2
INTRODUCTION
Local Economy-Class Train of Purwakarta, frequently called Patas Purwakarta or abbreviated as Patas PWK, has been operating since 1971. Patas PWK is an economy class train serving the route of Purwakarta-Jakarta Kota round trip and one of the favorite commuter lines in Jabodetabek area. People often call it as odong-odong.
The service provided by this Patas train over four decades has been miserable. All passenger coaches are always fully loaded. Passengers sit and stand in crowds. Passengers’ luggage contributes to narrowing the coach space. Moreover, hundreds of passengers of such an odong-odong train occupy all the coach roofs for sitting, as well as tens of passengers hanging on the right and left sides of the Locomotive. It is because this train is for people in middle-low class with very low tariff.
The poor operation management of Patas Purwakarta train has made prospective passengers get on the train without buying ticket in prior. Such a condition is a “model mental” or social disease which is dificult to be eradicated. The cause is that almost all stations for the route of Purwakarta-Jakarta Kota round trip are not fenced, and the entrance/exit gate is not supervised byb the station oficers. Only three stations of middle class category, i.e. Cikampek, Bekasi, and Jatinegara have been fenced and supervised by the oficers.
Based on the information from the station oficers along the route of Purwakarta-Jakarta Kota round trip, only 20% out of all the passengers hold their tickets. It can be imagined the gloomy age of PT KAI by suffering from loss in a fairly long time, so it is not surprising that PT KAI, especially the Local Economy-Class Train of Purwakarta or such an odong-odong, has been subsidied every year. In addition, many issues have spreaded that not only the Local Economy-Class Train of Purwakarta or such an odong-odong suffer from loss, but almost all economy class trains like KRL and KRD. Even the government intentionally subsidies the economy class trains of Surabaya Pasar Turi, Surabaya Gubeng and others in order to keep the economy run smoothly.
Jurnal Manajemen Transportasi & Logistik (JMTranslog) - Vol. 03 No. 1, Maret 2016 3 to Richa Widyaningtyas (2010: 49), can
represent 13 indicators of Independent Variable (X1) or as research indicators which determine whether the services delivered by PT KAI, especially Patas Purwakarta Train, have been optimal or not.
According to Febri Tri Bramasta Putra (2010: 15), independent variable is a measure of how good the delivered service can fulill or match to the consumer expectation. Based on this statement, if Patas Purwakarta Train want to satisfy its consumers, thus the service delivered to consumers should be the same as or exceed their expectation in order to satisfy them, and the control over this excellence is to fulill the customers’ want (Philip Kotler, 2002: 83). Whereas Fandy Tjiptono (2007) states that Independent variable is an effort to satisfy consumers’ needs and wants as well as its punctual delivery in response of their expectation.
Today, high independent variable is considered as a tool for transportation service company like Patas Purwakarta Train to have competitive advantages over the competitors. The beneit of good independent variable among others are passengers loyalty, new prospective passengers attraction, commitment and satisfaction of all employees, improved image of Patas Purwakarta Train in the people’s eyes. These are intended to make people feel comfortable with the facilities and service provided and feel astonished with the transportation service performance of Patas Purwakarta Train.
Consumer satisfaction will be achieved if the quality of product or service provided by a company matches to the consumer want, since service quality much depends on who provides and how it is delivered. Customer satisfaction is a key success of a company; when the consumers are satisied, they will be loyal. Customer loyalty is obtained through a combination of satisfaction and complaints. The higher the independent variable, the higher the customer satisfaction level will be. This is in accordance with Rambat Lupiyoadi and Hamdani, A (2001: 98) stating that one of the main factors the company should pay attention in improving customer satisfaction is the independent variable.
Moreover, price also determines customer satisfaction in the service use because the tariff established is related to the passengers income. The higher tariff will make passengers think twice to use the transportation service. In contrast, the lower tariff make the passengers tend to use the transportation service without many considerations. This is also in accordance with the statement of Rambat Lupiyoadi and Hamdani, A., (2006: 195) that price is one of the factors inluencing customer satisfaction. Therefeore, it is interesting to study customer loyalty in the train service, especially Patas Purwakarta Train.
Jurnal Manajemen Transportasi & Logistik (JMTranslog) - Vol. 03 No. 1, Maret 2016 4
by the passengers have caused a negative controversy among people so that both the customer satisfaction (Y1) and the customer loyalty (Y2) of Patas Purwakarta Train are not achieved. Based on the background that has been described, the authors are interested in studying or choosing the title Customer loyalty of Patas Purwakarta Train Service.
The research is carried out using a “survey method” through fulilling
questionnaires; the researchers (authors) directly accompany each of 125 respondents to be surveyed one by one. The object of the research is the regular passengers or customer who use the service of Patas Purwakarta Train more than twice, thus not all the population has the same probability to be the sample.
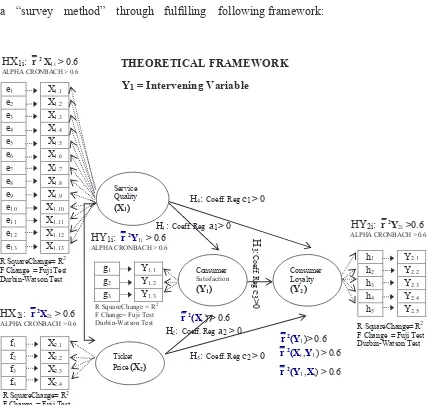
In order to know the inluence among variables it can be explained through the
Figure 1 : Conceptual Model & Functional Relationship: Among Independent variable (X1), Ticket price (X2), Consumer satisfaction (Y1), and Consumer Loyalty (Y2). Estimated Results (Multiple Regression) to determine whether the function is Normally Distributed.
ALPHA CRONBACH > 0.6 THEORETICAL FRAMEWORK
Y1 = Intervening Variable
H5: Coeff. Regc2 > 0 ALPHA CRONBACH > 0.6
R SquareChange = R2
F Change= Fuji Test Durbin-Watson Test
Jurnal Manajemen Transportasi & Logistik (JMTranslog) - Vol. 03 No. 1, Maret 2016 5 Regression Model I :
Y1 = a0 + a1 X1 + a2X2+ e1
Y2 = b0 + b1 Y1 Calc+ e2
Y2 Calc = c0 + c1 X1 + c2X2 +
c3Y1 + e3
Y2 Calc = d0 + d1 X1 + d2X2 + d3Y1
+ e4
Regression Model II:
X1 = e0 + e1 X1.1 + e2 X1.2 + e3 X1.3 + e4 X1.4 + e5 X1.5 + e6 X1.6 +
e7 X1.7 + e8 X1.8 + e9 X1.9 +
e10 X1.10 + e11 X1.11 + e12 X1.12 + e13 X1.13 + e5
X2 = f0 + f1 X2.1 + f2 X2.2 + f3 X2.3 + f4 X2.4 + e6
Y
1 = g0 + g1 Y1.1 + g2 Y1.2 + g3 Y1.3
+ e7
Y2 = h0 + h
1 Y2.1 + h2 Y2.2 + h3 Y2.3 +
h4 Y2.4 + h5 Y2.5 + e8
Path Analysis Method
Standardized Coeficients:
Y
1 = ρ1X1 + ρ2 X2 + ε9
Y2 = ρ
1X1 + ρ2 X2 + σ1Y1 + ε10
Dimensional Variable (Relationship
between Variable and Dimension)
The relationship among Independent variable (X1), 5 Main Dimensions (Total) of Independent variable (X1u.i ) and 5 Dimensions of Averaged Independent
variable (X2v.i ) and the relationship both Variable and Dimension of Average in Path Analysis Method can be explained as follows:
HX1: r 2X1 > 0 :
Independent variable (X1)
HX3v: r 2X3v > 0 :
Dimension of Averaged Independent variable (X3v)
HX1u.i: r 2X1u.i > 0 :
5 Main Dimensions (Total) of Independent variable (X1u.i)
H1: HX1u.1 = Tangible is the function of Independent variable Indicator (X1.1 to X1.4)
H2: HX1u.2 = Reliability is the function of Independent variable Indicator (X1.5 to X1.7)
H3: HX1u.3 = Responsiveness is the function of Independent variable Indicator (X1.8 to X1.9)
H4: HX1u.4 = Assurance is the function of Independent variable Indicator (X1.10 to X
1.11)
H5: HX1u.5 = Empathy is the function of Independent variable Indicator (X1.12 to X
Jurnal Manajemen Transportasi & Logistik (JMTranslog) - Vol. 03 No. 1, Maret 2016 6
HX1v.i: r 2X1v.i > 0
5 Dimensions of Averaged Independent variable (X1v):
H1: HX1v.1 = Tangible positively inluences the variable of consumer satisfaction. H2: HX1v.2 = Reliability positively
inluences the variable of consumer satisfaction. H3: HX1v.3 = Responsiveness positively
inluences the variable of consumer satisfaction. H4: HX1v.4 = Assurance positively
inluences the variable of consumer satisfaction. H5: HX1v.5 = Empathy positively
inluences the variable of consumer satisfaction.
HX2: r 2 X2 > 0 :
Variable of Ticket price (X2)
HX4v: r 2 X4v > 0 :
Dimension of Averaged Ticket price (X4v)
HX4v.i: r 2 X4v.i > 0 :
3 Dimensions of Averaged Ticket price (X4v.i) :
(1) Conformity of price with the service quality delivered
(2) Conformity of price with the service experienced
(3) Conformity of price with the facilities
HY1: r 2 Y1 > 0 :
Variable of Consumer satisfaction
(Y1)
HY3v: r 2 Y3v > 0 :
Dimension of Consumer satisfaction (Y3v)
HY3v.i: r 2 Y3v.i > 0 :
3 Dimensions of Consumer satisfaction (Y3v.i) :
(1) The service conforms the customer expectation,
(2) Customer’s willingness to recommend to others, and
(3) Satisfaction on the independent variable experienced.
HY2: r 2 Y2 > 0 :
Variable of Consumer satisfaction
(Y2)
HY4v: r 2 Y4v > 0 :
Dimension of Consumer satisfaction (Y4v)
HY4v.i: r 2 Y4v.i > 0 :
3 Dimensions of Consumer satisfaction (Y4v.i) :
(1) Service reuse
(2) The service is positively internalized in customer’s mind
Jurnal Manajemen Transportasi & Logistik (JMTranslog) - Vol. 03 No. 1, Maret 2016 7 Path Analysis Method
Standardized Coeficients:
Y1 = ρ1X1 + ρ2 X2 + ε9
Y2 = ρ1X1 + ρ2 X2 + σ1Y1 + ε10
where:
Y1 = Customer satisfaction
Y2 = Customer loyalty
ρ1 = Coeficient of Independent variable
ρ2 = Coeficient of Ticket Price variable
σ1 = Coeficient of the variable intervening Customer satisfaction
ε = Error Term
X1 = Independent variable
X2 = Ticket price
Multi-Linear Regression Analysis
The analysis used to measure the strength of relationship between two or more variables also indicates the direction of the relationship between dependent variable and independent variable (Imam Ghozali, 2001). Such a research model can be explained using linear regression equation model (A T. Ferdinand, et al., 2006) as follows:
Y = e0 + e1 X1.1 + e2 X1.2 + e3 X1.3 + e4 X1.4 + e5 X1.5 + e6 X1.6 + e7 X1.7 + e8 X1.8 + e9 X1.9 + e10 X1.10 + e11 X1.11 + e12 X1.12 + e13 X1.13 + e14 X1.14 + e11
where:
X1.1 = Tangible = (X1u.1)
X1.2 = Reliability = (X1u.2)
X1.3 = Responsiveness = (X1u.3)
X1.4 = Assurance = (X1u.4)
X1.5 = Empathy = (X1u.5)
X1.6 = Independent variable = (X1)
X1.7 = Ticket price variable = (X2)
X1.8 = Consumer satisfaction variable =
(Y1)
X1.9 = Consumer loyalty variable = (Y2)
X1.10 = Dimension of Averaged Independent variable = (X3v)
X1.11 = Dimension of Averaged Ticket price = (X4v)
X1.12 = Dimension of Averaged Consumer
satisfaction = (Y3v)
X1.13 = Subsitute Dimension of Averaged Independent variable KP X3v to KP X1 = [SubX3v(X1)]
X1.14 = X = Independent Variable, as Total Score of Data with Category (the irst number)
Y = Dependent Variable, as Total Score of Data with Category (the second number)
e0 , e1 ... e14 = the Coeficient of Regression for the 14 Independent Variables
Jurnal Manajemen Transportasi & Logistik (JMTranslog) - Vol. 03 No. 1, Maret 2016 8
RESULTS AND DISCUSSIONS
The results of all calculated functional estimations (Unstandardized Coeficients), including all regression models: Regression
Model I, Regression Model II and Regression Model III (Multiple Regression) and functional Model of Path Analysis Methoid (Standardized Coeficients) are as follows:
Figure 2 : Conceptual Model & Functional Relationship: Among Independent variable (X1),
Ticket price (X2), Consumer satisfaction (Y1), and Consumer Loyalty (Y2). Estimated Results
(Multiple Regression) to determine whether the function is Normally Distributed.
2.41 Y
RESULT OF EMPIRICAL CALCULATION Y1 = Intervening Variable
c
ALPHA CRONBACH = 0.952
R Square = 0.910
Regression Model I :
Jurnal Manajemen Transportasi & Logistik (JMTranslog) - Vol. 03 No. 1, Maret 2016 9 X2 = 16.167 + 9.786 X2.1 - 9.821X2.2 +
21.154 X2.3 - 17.104 X2.4
Y1 = 11.369 - 1.431 Y1.1 + 3.343 Y1.2 + 1.265 Y1.3
Y2 = 24.333 + 2.408 Y2.1 + 0.071 Y2.2 + 1.824 Y2.3 - 0.924 Y2.4 + 2.281 Y2.5
Path Analysis Method
Standardized Coeficients:
Y1 = 0.912 X1 + 0.088 X2
Y2Calc= 0.750 X1 + 0.107 X2 + 0.144 Y1
or
Y1 = 0.912 X1 + 0.088 X2
Y2Calc= 0.144 Y1 + 0.750 X1 + 0.107 X2
Indirect Inluence of Independent
Variable and Ticket price on Customer
Satisfaction
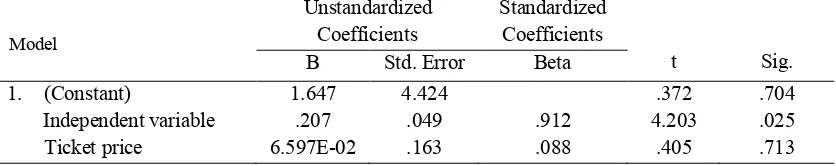
1. Regression Equation
Based on the examination against the inluence of independent variable and ticket price on consumer (customer) satisfaction, the results are obtained at Table 1.
Based on the estimation result of Model I (Multi-Linear Regression) indicated by the Standardized Coeficients, it can be stated by the following equation:
Y
1 = 0.912 X1 + 0.088 X2
This multi-linear regression equation shows that : a) The value of regression coeficient for independent variable (X
1) indicates positive value 0.912 and
signiicance at α = 0.025. It means if the independent variable provided by Patas
Purwakarta train service provider can be improved, then the customer satisfaction (Y1) will improve as well; b) The value of regression coeficient for ticket price variable (X2) indicates positive value 0.088 and signiicance at α = 0.713 [and has a very big conidence interval (or fairly much varies)]. It means, if the ticket price set by the transportation service provider is more competitive and more varied as well as affordable for consumers (Patas Purwakarta train service users)’ purchasing power is applicable, then customer satisfaction (Y1) will improve as well; c) Based on the value of regression coeficient, the most inluential variable to improving customer satisfaction (Y1) is independent variable (X1). This is indicated by the value of regression coeficient for independent variable which is bigger than the regression coeficient for ticket price (X2), where the signiicance α = 0.05 meaning that the independent variable (X1) is signiicant
whereas the ticket price variable (X2) is not signiicant, but the ticket price still can be enhanced because its positive regression coeficient is still big enough.
2. Testing Hypothesis
Test of Hypothesis 1: The Inluence of
Independent Variable on Customer
Satisfaction
Jurnal Manajemen Transportasi & Logistik (JMTranslog) - Vol. 03 No. 1, Maret 2016 10
freedom (df) = 3, so that tcount = 4.203 > ttable = 2.353 is also still signiicant. It means that the independent variable that is given can be enhanced, and then it can improve the customer satisfaction. This is in accordance with Hendy Irawan Juwandi (2004: 37) stating that one of the factors driving consumer satisfaction is the enhancement of independent variable
Based on the result of hypothesis testing it can be concluded that the test accept the irst hypothesis, so the assumption on the existence of positive inluence of independent variable on customer satisfaction is proven or acceptable. This research is consistent with the one carried out by Rachel (2007) that Quality has a signiicant inluence on the consumer satisfaction and loyalty.
Test of Hypothesis 2: The Inluence of
Ticket Price on Customer Satisfaction
The hypothesis testing indicates that Ticket price has positive impact on the improvement of customer satisfaction. The value of tcount 0.405 is not signiicant at α = 0.713, since the value of tcount = 0.405 <
ttable = 0.713. In this test Ho is accepted and
Ha is rejected. It means that the test has no signiicant impact at α = 7.13 % and still signiicant at α = 10 % (and the most important is that the coeficient of estimated result give positive value as in the theory).
This result is in accordance with the statement of Rambat Lupiyoadi and Hamdani, A, et.al., (2001), that if a product requires consumers to pay a higher cost than its marginal utility that they receive,
then consumer satisfaction will decline or the product or service will have a negative vakue to consumer satisfaction, and the consumer loyalty will decline as well. It also applies for the opposite according to Rambat Lupiyoadi and Hamdani, A, et.al., (2006). Thus ticket price is in the position of very critical signiicance. Therefore, the ticket price offered should be more varied and more competitive and affordable for the users, so that it can still be tolerated in improving consumer satisfaction.
Based on the result of hypothesis testing it can be concluded that the test accept the second hypothesis, so the assumption on the existence of positive inluence of ticket price on customer satisfaction is proven or acceptable. This research is in line with the one carried out by Ambar Setya Ningtyas (2008) that price has a signiicant inluence on the consumer satisfaction.
The Inluence of Independent Variable
and Ticket Price on Customer Loyalty
through Customer Satisfaction as the
InterveningVariable.
1. Regression Equation
Based on the estimated result for Model II (Multi-Linear Regression) Table 2 indicated by the Standardized Coeficients, it can be stated in the following equation:
Y2 = 0.750 X1 + 0.107 X2 + 0.144 Y1
This Multi-Linear Regression
equation indicates that : a) The value of regression coeficient for independent variable (X1) in the regression equation
Jurnal Manajemen Transportasi & Logistik (JMTranslog) - Vol. 03 No. 1, Maret 2016 11 and it is signiicant at α = 0.018. It means
that if the independent variable given by the provider of Patas Purwakarta train service can be enhanced, then customer satisfaction (Y1) will improve, so it positively inluences the improvement of customer loyalty (Y2); b) The value of regression coeficient for ticket price variable (X2) indicates positive value of 0.107 and it is signiicant at α = 0.118 [and has conidence interval which is very high (or much varied)]. It means that if ticket price offered by the provider of Patas Purwakarta train service is more competitive and more varied as well as affordable for the users, then customer satisfaction (Y1) will improve,
so it positively inluences the improvement of customer loyalty (Y2); c) The value of regression coeficient for customer satisfaction variable (Y1) indicates positive
value of 0.144 and it is signiicant at α = 0.304. It means that customer satisfaction can be improved. With the improvement of customer satisfaction, it will also positively inluences the improvement of customer loyalty (Y2); d) Based on the result of empirical test on the regression equation model II Path Analysis Method, it is found that the most inluential variable for improving customer loyalty (Y2) is the variable that indicates bigger regression coeficient value B (Unstandardized Coeficients) or the value of signiicance Beta or β = the smallest (Standardized Coeficients). Based on these requirements, the most inluential variables for improving customer loyalty (Y2) are independent variable (X1), customer satisfaction (Y1),
and ticket price (X2) respectively. The result
of empirical test in this research has found the theoretical implication and additional justiication for some antecedents which positively inluence customer loyalty altogether, so it is stated that ticket price (X2) is weaker than independent variable (X1) in
improving both customer satisfaction (Y1)
and customer loyalty (Y2).
2. Testing Hypothesis
Test of Hypothesis 3: The Inluence of
Independent Variable on Customer
Loyalty through Customer Satisfaction
The independent variable test on consumer loyalty through intervening variable, i.e. consumer satisfaction, found the value of standardized beta 0.912 which is signiicant at α = 0.025, meaning that independent variable has impacts on customer satisfaction. If independent
variable improves then customer
satisfaction will improve as well. The value of standardized beta 0.912 is the value of path p3.
In the regression equation as described in Model II, the value of standardized beta for independent variable is found as 0.750 and customer satisfaction as 0.144 all which show signiicant impact. The value of standardized beta for independent variable as 0.750 is the value of path p4 and the value of standardized beta for consumer satisfaction as 0.144 is the value of path p5. The value of that path is e1 = [(1- 0.750)]1/2
= 0.500 and e2 = [(1- 0.144)]1/2 = 0.925.
Jurnal Manajemen Transportasi & Logistik (JMTranslog) - Vol. 03 No. 1, Maret 2016 12
0.750, whereas the value of indirect inluence should be calculated by multiplying the indirect coeficient (0.912) x (0.750) = 0.684. Regarding the direct coeficient is bigger than the value of regression coeficient for indirect relationship, it can be concluded that in actual there is a direct relationship between independent variable and consumer satisfaction.
Test of Hypothesis 4: The Inluence
oif Ticket Price on Customer Loyalty
through Customer Satisfaction
From the test of ticket price on consumer loyalty through intervening variable, i.e. consumer satisfaction, it is found the value of standardized beta as 0.088 which is not signiicant at α = 0.713. It means that ticket price inluences consumer satisfaction. If ticket price is enhanced then consumer satisfaction will improve. The value of standardized beta 0.088 is the value of path p3.
In the regression equation as described in Model II, the value of standardized beta for ticket price is found as 0.107 and customer satisfaction as 0.144 all which show signiicant impact. The value of standardized beta for ticket price as 0.107 is the value of path p4 whereas the value of standardized beta for consumer satisfaction as 0.144 is the value of path p5. The value of e1 = [(1- 0.750)]1/2 = 0.500 and e2 =
[(1- 0.144)]1/2 = 0.925.
The value of direct inluence of ticket price on customer loyalty is 0.107, whereas the value of indirect inluence should be calculated by multiplying the indirect
coeficient (0.088) x (0.107) = 0.009. Regarding the direct coeficient is bigger than the value of regression coeficient for indirect relationship, it can be concluded that in actual there is a direct relationship between ticket price and consumer satisfaction.
The Inluence of Customer Satisfaction
on Customer Loyalty
The research shows that the value of tcount for customer satisfaction is 1.369 which is signiicant at α = 0.304. This indicates that there is a signiicant inluence of customer satisfaction on customer loyalty. This is in line with the research carried out by Wenny Maylina (2003), where satisfaction has positive signiicant inluence on consumer’s brand loyalty. Based on the hypothesis test it can be concluded that the test accept the ifth hypothesis, so the assumption on the existence of inluence of customer satisfaction (Y1) on customer lotalty (Y2) is acceptable.
Multi-Linear Regression Analysis
Jurnal Manajemen Transportasi & Logistik (JMTranslog) - Vol. 03 No. 1, Maret 2016 13 of Determination Coeficient or Adjusted R
Square (R2) 0.988. It means that 98.8% of
the customer loyalty variance is explained by all its independent variables, while the rest of 0.012 or 1.2% is explained by the variables not included in this research.
Regarding the individual impact of each independent variable, there are 4 variables that have negative impoact on Customer loyalty, namely: (1) Tangible = X1u.1, (2) Empathy = X1u.5, (3) Independent variable (X1) and (4) Customer loyalty
variable (Y2), signalling that the effort top maximize the improvement of Customer loyalty through both Main Dimensions (Total) of Independent variable (X1u.i ) has not been optimal yet.
The transportation service provider should try to renew and improve the displayed Tangibles by increasing the number of coaches or railway trains which are ready to operate so that it does not take a long time for the passengers to get on Patas Purwakarta train and by improving the facilities within Patas Purwakarta train to establish loyal customers every year. Meanwhile, the Emphaty that should be given by the service provider is establishing loyal customers, improving the service quality (independent variable) to passengers in the form of Emphaty Dimension. The decline of two Main Dimensions (Total) of Independent variable (X1u.i ), i.e. Tangible and Empathy has negative impacts on Independent variable (X1) and (4) Customer
loyalty variable (Y2).
The most inluential variable for improving customer loyalty (Y2) is the one that shows bigger value of regression coeficient B (Unstandardized Coeficients) or the smallest value of signiicance Beta or β (Standardized Coeficients). The variable is Reliability = X1u.2, which is proven to fulill the demands for good services and positive impression the irst time passengers get on Patas Purwakarta train; the services suitable with passengers expectation; and for ability to tackle the problems of customer service in a good way to make the customers loyal to Patas Purwakarta train service.
The reability, as exempliied by Lerbin Aritonang (2005), of three indicators of independent variables in sequential number: (5) Honesty in providing explanation, (6) Hospitality, and (7) Speed of service, according to Tjiptono (2000), includes two essential things, namely: (i) Performance and (ii) dependability. It means that the company delivers its services right the irst time. It also means that the company fulill its promise. The reliability for transportation services is exampliied by such things as: (a) Serving passengers well the irst time they use the available service, (b) Serving at the time promised, and (c) Paying sincere attention to consumers (passengers) by showing the vacant seats.
Jurnal Manajemen Transportasi & Logistik (JMTranslog) - Vol. 03 No. 1, Maret 2016 14
explicitely supports the statements of Rambat Lupiyoadi and Hamdani, A, et.al., (2001) and marketing experts (Zeithaml, Valarie A., A Parasuraman, Berry, Leonard L, et.al., (1990) that one of the main factors a company has to pay attention in improving customer satisfaction is independent variable, which can be measured through 5 factors, i.e. tangible, reliability, responsiveness, assurance, empathy.
CONCLUSION
Based on the empirical test therough multi-linear regression analysis using Path Analysis Method, it is found that both Independent variable (X1) and Ticket
price (X2) have signiicant direct inluence on Customer satisfaction variable (Y1).
Whereas customer satisfaction variable has signiicant indirect inluence on Customer loyalty variable (Y2) [through the intervening variable of customer satisfaction]. It is found that the most inluential variables for improving Customer loyalty are Independent variable, Customer satisfaction, and Ticket price respectively.
The superiority of Independent variable over Ticket price in improving Customer loyalty is determined by the direct optimization done simultaneously through 5 factors that have positive impact on improving customer loyalty, i.e. Tangible, Reliability, Responsiveness, Assurance, and Empathy both physically and non-physically in order to get an optimum quality service which, in turn,
makes the passengers or customers impressed, satisied, and even loyal to the transportation service offered.
Meanwhile, the ability of Ticket price to improve Customer loyalty (Y2) is categorized weaker than the ability of independent variable (X1). It is much
determined by the non-physical factors that should be considered in terms of economics, “tradeoff” for incuring costs as the carrying fee (ticket price) compared with the marginal utility received by the consumers or customers, making dificult to implement the service provider’s policy to set up the transportation tariff. Beside it is a boomerang for the transport service provider due to its negative impact of declining consumer satisfaction, it is also a tradeoff for a series of policies made by the provider because it makes consumers or customers become disloyal. Responding such a condition, the last weapon in setting up Ticket price through the policy on tarnsportation tariff can only be driven if the ticket price set up by the provider is more competitive and more varied as well as affordable for the purchasing power of the service users. In the other words, the consumers or customers are faced only with two alternatives:”buy the ticket or not” or “use Patas Purwakarta train service or other modes of transport”.
Jurnal Manajemen Transportasi & Logistik (JMTranslog) - Vol. 03 No. 1, Maret 2016 15 which has good itness with goodness of it
regression models and all the hypotheses in this research are normally distributed (after passing through various statistical tests) with the value of Determination Coeficient or Adjusted R Square (R2) 0.988. It means
that 98.8% of the customer loyalty variance is explained by all its independent variables, whereas the rest of 0.012 or 1.2 % is explained by other variables not included in this research.
BIBLIOGRAPHY
Angin, Jasanta Perangin. 2009. ”Studi Peningkatan Loyalitas Pelanggan Ritel (Studi Kasus Toko Amelia)”,
[Thesis]. Semarang: Magister
Program in Management, Universitas Diponogoro. Unpublished.
Arikunto, Suharsimi. 2005. Prosedur
Penelitian. Jakarta: Bina Aksara.
Aritonang, Lerbin. 1998. Penelitian
Pemasaran. Jakarta: UPT Penerbitan
Universitas Tarumanagara.
Ferdinand, Augusty T. 2006. Metode
Penelitian Manajemen. Semarang:
Badan Penerbit Universitas
Diponegoro.
Fernell, C. & Wernerfelt, B. 1987. Defensive Marketing Strategy by Costumer Complain Management : A theoretical analysis. Journal of
marketing research 4 (4): 337-346.
Ghozali, Imam. 2001. Aplikasi Analisis Multivariate bagi Program SPSS.
Semarang: Badan Penerbit UNDIP.
Hadi, Sutrisno. 2001. Metodologi Research.
Yogyakarta: UGM.
Hair, JR, Joseph F, Rolp E. Andeson, Ropnald L. Tathan & William C.Black. 1995. Multivariate Data
Analysis with Reading. Forth Ed,
Prentice Hall International, Inc.
Juwandi, Hendy Irawan. 2004. Kepuasan
Pelayanan Jasa. Jakarta: Erlangga.
Kotler, Philip. 2002. Manajemen
Pemasaran di Indonesia: Analisis,
Perencanaan, Implementasi dan
Pengendalian. Jakarta: Salemba
Empat.
Lupiyoadi, Rambat & Hamdani, A. 2001.
Manajemen Pemasaran Jasa.
Jakarta: Salemba Empat.
Lupiyoadi, Rambat & Hamdani, A.2006.
Manajemen Pemasaran Jasa.
Jakarta: Salemba Empat.
Maylina, Wenny. 2003. Faktor-faktor yang Mempengaruhi Kesetiaan terhadap Merek pada Konsumen Pasta Gigi Pepsodent di Surabaya. Jurnal
Ventura 6.
Parasuraman, A, Berry L.L. & Zeithaml, V.A 1985, Conceptual Model of Service Quality and its Implications for Future Research. Journal of
Jurnal Manajemen Transportasi & Logistik (JMTranslog) - Vol. 03 No. 1, Maret 2016 16
Parasuraman, A., Valarie A. Zeithaml & Leonard L. Berry. 1988. “SERVQUAL: A Multiple- Item Scale for Measuring Consumer Perceptions of Service Quality.
Journal of Retailing 64 (1): 12-40.
Putra, Febri Tri Bramasta & Raharja, Edy. 2010. Analisis Pengaruh Kualitas Pelayanan, Harga Dan
kepuasan Pelanggan Terhadap
Loyalitas Pelanggan Di Bengkel Mobil Rapiglass Autocare Semarang
[Thesis] Semarang: Bachelor
Degree, Management Department, Faculty of Economics and Business, Diponegoro University.
Rachel. 2007. Faktor-faktor yang
mempengaruhi loyalitas konsumen dengan kepuasan konsumen Sebagai variabel intervening [Thesis]
Semarang: Bachelor Degree,
Management Department, Faculty of Economics and Business, Diponegoro University.
Setya Ningtyas, Ambar. 2008. Analisis Pengaruh Persepsi Harga, Kebiasaan, Brand Image, dan Komitmen Konsumen terhadap Keputusan Pembelian Rokok Gudang Garam. Unpublished [Thesis].
Santoso, Singgih. 2001. Panduan Lengkap
Menguasai SPSS 16. Jakarta: Elex
Media Komputindo.
Tjiptono, Fandy. 2000. Prinsip & Dinamika Pemasaran. First edition.
Yogyakarta: J & J Learning..
Tjiptono, Fandy. 2007. Strategi Pemasaran,
First edition. Yogyakarta: Andi Ofset.
Widyaningtyas, Richa. 2010. Faktor-Faktor yang Mempengaruhi Loyalitas Serta Dampaknya Pada Kepuasan Konsumen Dalam Menggunakan Jasa Kereta Api Harina di PT. Kereta Api Indonesia DAOP IV Semarang [Thesis]. Semarang: Management Department, Faculty of Economics and Business, Diponegoro University, Unpublished.
Zeithaml, Valarie A., A. Parasuraman, Berry, Leonard L. 1990. Service Quality: Balancing Customer
Perception an Expectation. New
Jurnal Manajemen Transportasi & Logistik (JMTranslog) - Vol. 03 No. 1, Maret 2016 17 a Dependent Variable: Y1 = Consumer satisfaction (Observed)
Source: Primary Data from Survey, processed by the authors, 2013 Model
Table 1 Regression Equation Model I The Inluence of Independent Variable and
Ticket Price on Customer Satisfaction Coeficientsa
Table 1 Regression Equation Model I The Inluence of Independent Variable and
Ticket Price on Customer Satisfaction Coeficientsa
Unstandardized
Source: Primary Data from Survey, processed by the authors, 2013 Model
Tabel 3 Model Summaryb
Model R R Square Adjusted R
a. Predictors: (Constant), X = Independent Variable (Total value), Dimension of AveragedIndependent variable = X3v, Independent
variable = X1, Dimension of Averaged Consumer satisfaction = Y3v, Consumer loyalty variable = Y2, Consumer satisfaction
variable = Y1, Subsitute Dimension of Averaged KP X3v to KP X1 = SubX3v(X1), Empathy = X1u.5, Assurance = X1u.4,
Responsiveness = X1u.3, Reliability = X1u.2, Dimension of Averaged Ticket price = X4v, Ticket price variable = X2, Tangible =
X1u.1
b. Dependent Variable: Y = Dependent Variable (Total II)
Jurnal Manajemen Transportasi & Logistik (JMTranslog) - Vol. 03 No. 1, Maret 2016 18
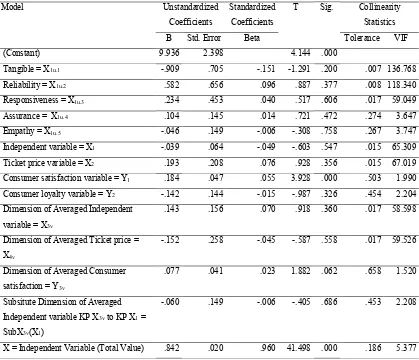
Table 5 Coefficient for Estimated Results Coefficientsa
Model Unstandardized
Coefficients
Standardized
Coefficients
T Sig. Collinearity
Statistics
B Std. Error Beta Tolerance VIF
(Constant) 9.936 2.398 4.144 .000
Tangible = X1u.1 -.909 .705 -.151 -1.291 .200 .007 136.768
Reliability = X1u.2 .582 .656 .096 .887 .377 .008 118.340
Responsiveness = X1u.3 .234 .453 .040 .517 .606 .017 59.049
Assurance = X1u.4 .104 .145 .014 .721 .472 .274 3.647
Empathy = X1u.5 -.046 .149 -.006 -.308 .758 .267 3.747
Independent variable = X1 -.039 .064 -.049 -.603 .547 .015 65.309
Ticket price variable = X2 .193 .208 .076 .928 .356 .015 67.019
Consumer satisfaction variable = Y1 .184 .047 .055 3.928 .000 .503 1.990
Consumer loyalty variable = Y2 -.142 .144 -.015 -.987 .326 .454 2.204
Dimension of Averaged Independent
variable = X3v
.143 .156 .070 .918 .360 .017 58.598
Dimension of Averaged Ticket price =
X4v
-.152 .258 -.045 -.587 .558 .017 59.526
Dimension of Averaged Consumer
satisfaction = Y3v
.077 .041 .023 1.882 .062 .658 1.520
Subsitute Dimension of Averaged
Independent variable KP X3v to KP X1 =
SubX3v(X1)
-.060 .149 -.006 -.405 .686 .453 2.208
X = Independent Variable (Total Value) .842 .020 .960 41.498 .000 .186 5.377
a. Dependent Variable: Y = Dependent Variable (Total II)
Source: Primary Data from Survey, processed by the authors, 2013
Table 4 ANOVAa
Model Sum of
Squares
Df Mean Square F Sig.
1
Regression 4150022.349 14 296430.168 709.404 .000b
Residual 45964.407 110 417.858
Total 4195986.756 124
a. Dependent Variable: Y = Dependent Variable (Total II)
b. Predictors