This research is to find out how the role and influence of marketing stimuli (advertising, pricing, and sales promotion) as well as the role of family and brand awareness, brand associations, perceived quality of Pepsodent toothpaste. The benefits of this research study is expec-ted to be considered in developing a marketing mix that ultimately led to the formation of perceived qualitys. Second, updating the theory of consumer behavior and marketing theory. This research method is accomplished by using a descriptive study using survey. The popula-tion in this study is consumer of Pepsodent toothpaste. Samples done by accidental sampling. For data collection questionnaire used closed type. Operationalization variable using descriptive and quantitative analysis variable (GSCA and SEM). The results showed the influence of very low ranging from 0.00 to 0.19 for the relationship of advertising and brand awareness variables, the price and brand association variables, promotion and brand awareness variables, relationship between fami-ly variable and brand awareness and brand association. While famifami-ly variable and perceived quality variable had reverse effect. The low but definite effect ranged from 0.20 to 0.39 for the advertising variable, brand associations variable, and perceived quality as well as variable promotion, promotional variable to variable brand associations and perceived quality variables. The effect was ranged from 0.40 to 0.60 for brand awareness and perceived quality variables. Recommenda-tions to PT Unilever should deliver more competitive promotion thus proving that good quality is always supported by good and great pro-motion, low price version. Pepsodent should promote impressed with quality, still showing the previous experience of the people who have benefited from Pepsodent, while providing marketing and advertising top of mind to their customers so that they lose sight of the Pepsodent, still suggested best quality can be compared with its competitors, the evidence suggests that the quality is always the best
© 2013 IRJBS, All rights reserved. Keywords:
marketing mix, family, brand equity, perceived quality
Corresponding author: [email protected]
A R T I C L E I N F O A B S T R A C T
Vol. 6 | No. 3 ISSN: 2089-6271
Marketing Mix is The Only Variable
to Choose Brands and Quality?
INTRODUCTION
Brand advertising had impact on potential buyers’ implicit memory (Buschken, 2007). Spending on brand advertising will increase the coverage and repetition of advertising messages, and as a result, a higher level of awareness will be obtained for a given brand. Jeong (2004) had found advertising contributed directly to brand equity. Advertising spending by consumers also felt positive about the brand equity as evidenced in previous works (Villarejo & Sanchez-Franco, 2005). Branding is considered means in establishing and maintaining competitive advantage (Deepa & Chitramani, 2013). Family has been regarded as one of the strong factors in consumer behavior. Research on brand equity, from a consumer perspective, aiming to analyze the behavior of consumers towards the brand name (Keller, 2003). Perceived quality is considered as a consumer judgment about the overall excellence or superiority of the product. Companies should communicate the quality of the signal quality of the brand through marketing actions. Consumers feel brand equity through their direct experience with the brand and the information obtained in environmental factors (Boonghee Yoo, Donthu, & Lee, 2000). Perceived quality had significant influence on the brand loyalty (Shaharudin, Mansor, Hassan, Omar, & Harun, 2011). Among the extrinsic attributes of marketing through advertising, pricing and promotion, have a major role. High advertising spending, high price, good store image, and high distribution intensity are related to high brand equity (Boonghee Yoo et al., 2000), so that, there is a positive relationship between advertising expenditure and consumer perceived of brand quality. Information provided by the family brand to determine consumer perceiveds of the quality of a brand. Thus, young people’s perceived of the brand recommended or used by other experienced consumers, may influence the perceived quality of the brand. Family had joint activity, and children’s active participation, determines the influence they gain (Norgaard, Bruns, Christensen, & Mikkelsen, 2007). This
perceived involves a more positive attitude toward the brand, and may result in the purchase of the brand (Moore, Wilkie, & Lutz, 2002). High quality producers should raise the price to signal quality. Thus, the high price is generally regarded as higher quality than the cheap price. This has been outlined in the study Chiang and Niu (2013). Along the same argument, price promotions may erode brand quality because they reduce the price of the product (Jorgensen, Taboubi, & Zaccoure, 2003). Negative effect of sales promotion anticipated adverse effects on brand equity (Swait & Erdem, 2022), which results in a negative perceived of the brand. The influence the assets of brand equity is brand association, brand awareness, perceived quality, and brand loyalty (Bohrer, 2007). Every new experience in creating brand, strengthen or modify individual associations.
Research objectives is to find out how the role of marketing stimuli (advertising, pricing, and sales promotion) as well as the role of the family and brand awareness, brand associations, as well as perceiveds of the quality of the Pepsodent toothpaste. Second, to determine the effect of advertising, price, family, sales promotion, the brand awareness, brand associations and perceived quality on Pepsodent toothpaste
Benefits of this research is expected of what factors to consider in developing marketing mix that ultimately led to the formation of perceived qualitys. Second, make a good present from the theory of consumer behavior and marketing theory.
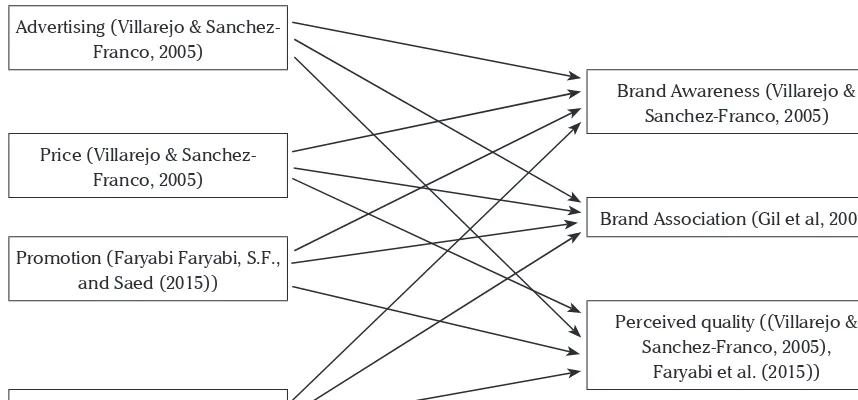
Theoretical Framework
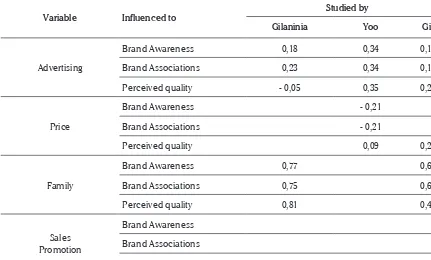
Previous studies can be summarized as shown in Table 1.
METHODS
of respondents who were sampled 200 people. Data collection using closed type questionnaire. Validity test instrument that measure all the variables are valid because r value larger than r table. Reliability test instrument are all reliable.
Multi relationship analysis could be grouped into recursive and non recursive. Besides indicators of latent variable models exist that is reflective and formative. Analysis of the structural equation mo-delling (SEM) has only drawback could be used to analyze the structural model of reflective indicator models. While the partial least square (PLS) ana-lysis has weaknesses because only can be used on recursive structural models. If a study analyzing the structural model is not recursive and formative indicators, the SEM and PLS analyzes can not be used. The solution is to use structured generalized component analysis (GSCA). (David, 2014)
RESULTS AND DISCUSSION Descriptive Analysis
Advertising Variable. Based on descriptive calculation of advertising indicator, that the amount of the budget indicators and the product life cycle, it can be said that the dimensions of the advertising budget in good scale. Based on the frequency and cost level indicator ad campaign, it can be said that the frequency dimension in good scale. Based on the cost and quality indicators better than competitors, it can be said that the dimensions of avertising cost effectiveness in good scale.
Price Variable. Based on descriptive calculation of pricing indicator, that high price reflection of high quality. Based on lowering-price could increasing demand but will limiting supply indicators, that the dimension of lowering price could increasing demand sufficiently.
Variable Influenced to Studied by
Gilaninia Yoo Gil
Advertising
Brand Awareness 0,18 0,34 0,19
Brand Associations 0,23 0,34 0,19
Perceived quality - 0,05 0,35 0,20
Price
Brand Awareness - 0,21
Brand Associations - 0,21
Perceived quality 0,09 0,22
Family
Brand Awareness 0,77 0,65
Brand Associations 0,75 0,65
Perceived quality 0,81 0,45
Sales Promotion
Brand Awareness Brand Associations
Perceived quality - 0,01
Table 1: Previous Studies
Variable Dimension Indicator
Advertising
a. Advertising budget
1. The amount of advertising budget 2. Budget corresponding to product lifecycle b. Advertising
frequency
3. Level of frequency
4. Advertising campaign more than competitors c. Effectivity
advertising promotion cost
5. Advertising cost greater than competitors 6. Advertising quality is better than competitors
Price
a. High price
7. Although the price high consumer remains buy it 8. High price indicates high quality
b. Lower Price
9. Even lower price, consumer still buy it 10. Excess supply causes low prices c. Expensive
price
11. Prices rise, consumers moving to other brands 12. Expensive prices cause demand to decline
Promotion
a. Promotion frequency
13. Level of promotion frequency 14. Level of promotion sufficiency b. Promotion
reach
15. Level of promotion reach
16. Complete information of promotional activities c. Promotion
cost
17. Promotion costs more expensive than competitors 18. Promotion quality better than competitors
Family
a. Long term purchase
19. Families bought the same product for a long time 20. Purchases continuously
b. Intention to buy
21. My parents bought the product in different occasion 22. Keep buying even though in stock
c. Brand loyalty
23. Product consumed from a long time ago 24. Using the same brand continously d. Parent role
to buy products
25. Parents role for buying family matters
26. Remained used the brand although had moved from parents home
e. Parent role 27. Parents always argue that the product is the best ever 28. The hardest parents influence of products selection f. Parent
recommen dation
29. Parents recommend products for family
Brand Awareness
a. Top of mind
31. This is the first brand in mind
32. This is the most remembered brand in mind b. Brand recognition 33. This brand is easy to recognized
34. This brand had a hallmark c. Brand
pressence
35. The most recognized brand presence
36. This is the most known brand than other brands
Brand Association
a. Brand impression
37. This brand had a positive impression for consumers 38. This brand has a strong characteristic so that is easy to
remember b. Brand
differentation
39. Consumers easily distinguish one brand to another 40. This brand had higher quality than competitors c. Brand
recall
41. Consumers easily recall the brand logo or symbol 42. This brand had known since long time
d. Brand personality 43. This brand has a strong personality 44. This is a flagship brand family
Perceived quality
a. Best quality
45. No doubt about this quality
46. This product has the best quality compared to competitors b. Trust 47. Had a high confidence using this product
48. This high-quality product is able to convince consumers c. High
quality
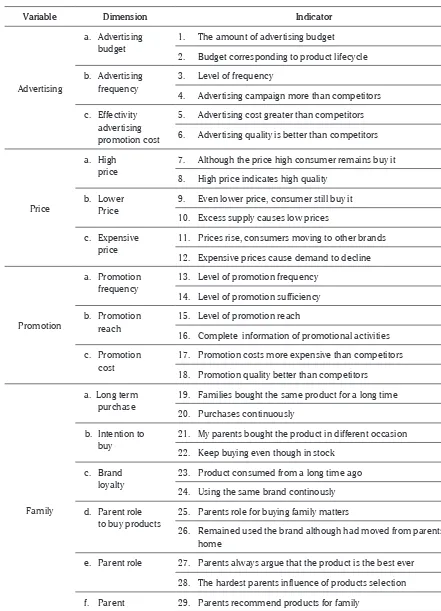
49. The product quality is higher than similar products 50. This quality product is more guaranteed than competitors Source: Boonghee Yoo et al. (2000)
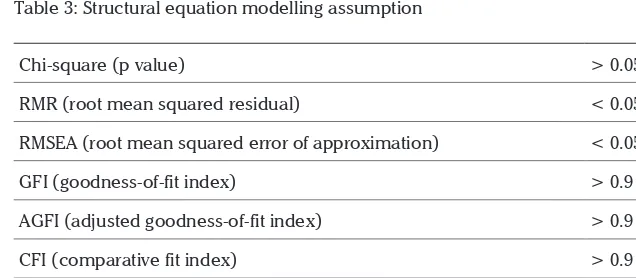
Table 3: Structural equation modelling assumption
Chi-square (p value) > 0.05
RMR (root mean squared residual) < 0.05
RMSEA (root mean squared error of approximation) < 0.05
GFI (goodness-of-fit index) > 0.9
AGFI (adjusted goodness-of-fit index) > 0.9
CFI (comparative fit index) > 0.9
TLI (Tucker-Lewis Index) > 0.9
Promotion Variable. Based on descriptive calculation of promotion indicators, that promotion dimension has a high frequency. Based on the level indicator and promotional activities, that the promotion had already reaching out to the entire community. Cost and quality promotion indicators, that the promotion is already done quite large.
Family Variable. Based on descriptive calculation of family indicator, that product purchase is done continuously and in the long run, that the dimensions of purchases that have been performed continuously and in the long run. Based on purchases any time indicator, that the intention to buy suffuciently. Based on continuous using indicator, that each of the dimensions remain in the same brand. Based on these indicators influence parents to buy the same brand, that parents are very influential in the selection of the brand dimension. Based on indicators of the opinion of parents and family, that the opinion of a parent influence the selection of the brand dimension. Based indicators of recommendation parents, that the recommendations of parents information is good enough.
Brand Awareness Variable. Based on descriptive calculation of brand awareness indicators, that surely Pepsodent toothpaste display easily recognizable. Based on indicators of the presence and recognition, that the presence of Pepsodent easily recognizable.
Brand Association Variabel. Based on descriptive calculation of data processing indicator, that the gap brand dimension is very strong. Based indicators of competitors Pepsodent visible difference of quality, that the quality dimensions of brand Pepsodent is different. That the dimensions of the symbol Pepsodent is easy to remember. Based on family brand personality indicator, it can be said that the dimensions Pepsodent have high brand personality.
Perceived quality Variable. Based on descriptive calculation of perceived quality indicators, that in the quality dimensions of Pepsodent is the best. High trust indicator based on the belief of high quality, that Pepsodent dimensional quality is believed. Based on quality indicators that the dimensions of Pepsodent is believed to be high quality.
Advertising (Villarejo & Sanchez-Franco, 2005)
Brand Awareness (Villarejo & Sanchez-Franco, 2005) Price (Villarejo &
Sanchez-Franco, 2005)
Brand Association (Gil et al, 2007) Promotion (Faryabi Faryabi, S.F.,
and Saed (2015))
Perceived quality ((Villarejo & Sanchez-Franco, 2005),
Faryabi et al. (2015)) Family (Gil et al., 2007)
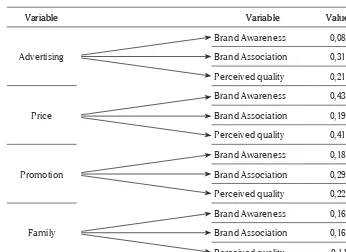
Variable Berkorelasi terhadap Variable Value
Advertising
Brand Awareness 0,08
Brand Association 0,31
Perceived quality 0,21
Price
Brand Awareness 0,43
Brand Association 0,19
Perceived quality 0,41
Promotion
Brand Awareness 0,18
Brand Association 0,29
Perceived quality 0,22
Family
Brand Awareness 0,16
Brand Association 0,16
Perceived quality -0,11
Table 5: Structural equation models output
Source: Lisrel output
Quantitative analysis
Calculation of structural equation modeling using software GSCA (Generalized Structured Component Analysis), obtained the model FIT value that can only be said to explain the relationship to the entire variable models by 27%. So if it is connected in the correlation relations have a fairly small effect. Can be said also that the models are made poorly if it is connected to each other. If the relationship between variables was adjusted (AFIT) diversity remains the model did not move much with the previous calculation of only 26.5% explanation.
Advertising variable determined by 50.9% of ad-vertising indicator. Price variable determined by 54.3% of Pepsodent purchase price indicator. Pro-motion variable determined by 60.3% of Pepsodent campaign indicator. Family variables determined by 58.8% of parents indicator. Brand Awareness variable determined by 66.7% of toothpaste brand indicator. Brand association variabel determined by 34.3% of quality indicators. Perceived quality
variable determined by 50.9% of Pepsodent has a higher quality.
Based on the above calculation, that the greatest influence is Price to Brand Awareness Variables whereas the smallest effect is Advertising to Brand Awareness Variables. While there is a negative relationship in the Family to Perceived quality. It could be argued that the price is still a fairly decisive variable for consumer awareness and perceived towards the purchase of Pepsodent toothpaste. While the family influence in Pepsodent toothpaste on determining Awareness,
Discussion
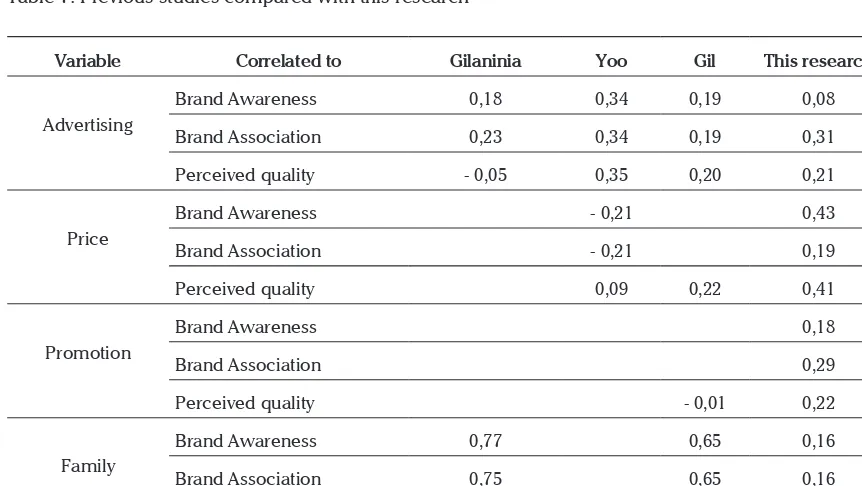
qua-Variable Correlated to Gilaninia Yoo Gil This research
Advertising
Brand Awareness 0,18 0,34 0,19 0,08
Brand Association 0,23 0,34 0,19 0,31
Perceived quality - 0,05 0,35 0,20 0,21
Price
Brand Awareness - 0,21 0,43
Brand Association - 0,21 0,19
Perceived quality 0,09 0,22 0,41
Promotion
Brand Awareness 0,18
Brand Association 0,29
Perceived quality - 0,01 0,22
Family
Brand Awareness 0,77 0,65 0,16
Brand Association 0,75 0,65 0,16
Perceived quality 0,81 0,45 - 0,11
Table 7: Previous studies compared with this research
Source: Data reprocessed
Indicator Fit Result
Chi square (χ2) Little 107.43
Goodness of fit indices (GFI) 0 – 1 0.88
Adjusted Goodness of fit indices (AGFI) 1 0.15
Parsimony Goodness of Fit Index (PGFI) > 0,06 0.094
Root Mean Square Error of Approximation (RMSEA) < 0,05 0.40
90% Confidence Interval for RMSEA Little 0.34
P-value for test of close fit < 0,50 0.00
Expected Cross Validation Index (ECVI) model : ECVI saturated < 0.29
Expected Cross Validation Index (ECVI) model : ECVI independence < 4.19
Akaike’s Information Criterion (AIC) model : AIC saturated < 56.00
Akaike’s Information Criterion (AIC) model : AIC independence < 846.68
Normed Fit Index (NFI) 0 – 1 0.87
Non- Normed Fit Index (NNFI) 0 – 1 0.065
Comparative Fit Index (CFI) 0 – 1 0.87
Incremental Fit Index (IFI) 0,9 0.87
Relative Fit Index (RFI) 0 – 1 0.063
Tabel 6: SEM indicator fit and results
Source: Lisrel output
lity compared with two other researchers. Effect of sales promotion is to brand awareness and brand association and perceived quality, while according to (Gil et al. (2007)) sales promotion will decrease, although small influence to perceived quality. Families have little effect in this study, even the perceived quality tends to degrade. But two other researchers showed that the family has a strong influence to raise the perceived of quality. This study find that promotion and price have signficant impact to brand awareness, but Conradie, R.L., and Klopper (2014) found no significant impact. The impact of promotion to perceived quality had mentioned by Faryabi et al. (2015) that price dis-count offer not to lower quality but to get more savings for consmers.
MANAGERIAL IMPLICATIONS
In advertising variable, in the advertising campaign cost effectiveness dimension found the lowest score that higher advertising costs larger than competitors indicators. It means the costs incurred to promote Pepsodent larger than competitors. Unilever should convey promotion quality more than competitors so that good quality is always supported by good promotion. In the price variable, lowest score in cheap price dimension in found that Pepsodent demand do not increase if the price is cheap indicator. It means falling prices do not increase Pepsodent demand. Unilever should not issued Pepsodent cheap price version. In the promotion variable, in promotional costs dimensions found the cost more expensive than competitors indicator. It means that Unilever promotional costs impressed too expensive. Unilever should promote Pepsodent impressed with promotional quality. In the family variable, in the parents recommendation dimension found that parents recommend to use products indicator in the lowest score. It means that parents seldom recommend family products to be used. Unilever should show parents experience the benefits of Pepsodent. In the brand awareness Variable, that on top of mind when buying Pepsodent dimension, in the most remembered toothpaste is
Pepsodent indicator in the lowest score. It means that Pepsodent is not the only choice of toothpaste. Unilever should continue to provide advertising and promotional top of mind to their customers.
In the brand association variable, that in the assessment dimensions found that Pepsodent quality better than competitors indicators got the lowest score. It means Pepsodent quality is not better than competitors. Unilever should keep bringing the best quality can be compared with its competitors. In the perceived quality variable, in the confidence dimension, that Pepsodent is believed to be good quality got the lowest score. It means Pepsodent do not believed to be good quality. Unilever should always proof that their quality is the best
CONCLUSION
R E F E R E N C E S
Bohrer, M. F. (2007). Discriminant analysis of Aaker’s band equity on top of mind awareness. (Doctoral), Anderson, Anderson. Buschken, J. (2007). Determinants of brand advertising efficiency. Journal of Advertising, 36(3), 51-73.
Chiang, Y. S., & Niu, H. J. (2013). Advertising expenditure and price asjoint indicators of product quality. International Management Review, 9(1), 78-88.
Conradie, E., R.L., M., & Klopper, H. B. (2014). Brand awareness in the service sector influenced by eight internal marketing elements. Journal of Global Business Technology, 10(1), 25-37.
David, N. S. (2014). The use and misuse of structural equation modelling in management research: A review and critique.
Journal of Advances in Management Research, 11(1), 47-81.
Deepa, S., & Chitramani, P. (2013). Brand building of retail stores. Journal of Contemporary Research in Management, 8(2), 9-24.
Faryabi, M., S.F., K., & Saed, M. (2015). Brand name, sales promotion, and consumers’ online purchase intention for cellphone brands. International Journal of Marketing Studies, 7(1), 167-179.
Ghozali, I. (2004). Model persamaan strukutral. Semarang: Badan Penerbit Undip.
Gil, R. B., Andres, E. F., & Salinas, E. M. (2007). Family as a source of consumer based brand equity. Journal of Product and Brand Management, 16(3), 188-199.
Gilaninia, S., Delafrooz, N., & Dokht, S. (2012). The role of family in creating brand equity from perpective of bank customers.
Journal of Basic and Applied Scientific Research, 2(9), 8906-8911.
Jeong, J. (2004). Exploring the impact of advertising on brand equity and sharehorlder value. (Doctoral), Univerisity of Texas at Austin, Austin.
Jorgensen, S., Taboubi, S., & Zaccoure, G. (2003). Cooperative advertising in a marketing channel. Journal of Optimization Theory and Applications, 110(1), 145-158.
Keller, K. L. (2003). Building, measuring, and managing brand equity (2 ed.). New Jersey: Prentice Hall.
Moore, E. S., Wilkie, W. L., & Lutz, R. J. (2002). Passing the torch: Intergenarational influences as a source of brand equity.
Journal of Marketing, 66(April), 17-37.
Norgaard, M. K., Bruns, K., Christensen, P. H., & Mikkelsen, M. R. (2007). Children’s influence on and participation in the family decision process during food buying. Emerrald Insight, 8(3), 197-216.
Shaharudin, M. R., Mansor, S. W., Hassan, A. A., Omar, M. W., & Harun, E. H. (2011). The relationship between product quality and purchase intention. African Journal of Business Management, 5(20), 8163-8176.
score that Pepsodent easy to remember because it had been known since a long time indicator. Perceived quality variable consists of 3 dimensions and 6 indicator. The highest score is best quality dimension supported by the highest score that no doubt about Pepsodent quality indicator.
Very low corrrelation ranging from 0.00 to 0.19 found between brand awareness to advertising variables, price to brand association variables,
Swait, J., & Erdem, T. (2022). The effects of temporal consistency of sales promotions and availability on consumer choice behavior. Journal of Marketing Research, 39(3), 304-320.
Villarejo, A. F., & Sanchez-Franco, M. J. (2005). The impact of marketing communication and price promotion on brand equity.
Journal of Brand Management, 12(6), 431-445.
Yoo, B., Donthu, N., & Lee, S. (2000). An examination of selected marketing mix elements and brand equity. Academy of Marketing Science Journal, 28(2), 195-211.