About This E-Book
EPUB is an open, industry-standard format for e-books. However, support for EPUB and its many features varies across reading devices and
applications. Use your device or app settings to customize the presentation to your liking. Settings that you can customize often include font, font size, single or double column, landscape or portrait mode, and figures that you can click or tap to enlarge. For additional information about the settings and features on your reading device or app, visit the device manufacturer’s Web site.
Many titles include programming code or configuration examples. To optimize the presentation of these elements, view the e-book in single-column, landscape mode and adjust the font size to the smallest setting. In addition to presenting code and configurations in the reflowable text format, we have included images of the code that mimic the presentation found in the print book; therefore, where the reflowable format may compromise the
presentation of the code listing, you will see a “Click here to view code
Sams Teach Yourself: Big Data
Analytics with Microsoft
HDInsight® in 24 Hours
Arshad Ali
Manpreet Singh
Sams Teach Yourself Big Data Analytics with Microsoft
HDInsight® in 24 Hours
Copyright © 2016 by Pearson Education, Inc.
All rights reserved. No part of this book shall be reproduced, stored in a retrieval system, or transmitted by any means, electronic, mechanical,
photocopying, recording, or otherwise, without written permission from the publisher. No patent liability is assumed with respect to the use of the
information contained herein. Although every precaution has been taken in the preparation of this book, the publisher and author assume no
responsibility for errors or omissions. Nor is any liability assumed for damages resulting from the use of the information contained herein. ISBN-13: 978-0-672-33727-7
ISBN-10: 0-672-33727-4
Library of Congress Control Number: 2015914167 Printed in the United States of America
Cheryl Lenser
All terms mentioned in this book that are known to be trademarks or service marks have been appropriately capitalized. Sams Publishing cannot attest to the accuracy of this information. Use of a term in this book should not be regarded as affecting the validity of any trademark or service mark.
HDInsight is a registered trademark of Microsoft Corporation.
Warning and Disclaimer
Every effort has been made to make this book as complete and as accurate as possible, but no warranty or fitness is implied. The information provided is on an “as is” basis. The authors and the publisher shall have neither liability nor responsibility to any person or entity with respect to any loss or damages arising from the information contained in this book.
Special Sales
For information about buying this title in bulk quantities, or for special sales opportunities (which may include electronic versions; custom cover designs; and content particular to your business, training goals, marketing focus, or branding interests), please contact our corporate sales department at
For government sales inquiries, please contact [email protected].
Contents at a Glance
Introduction
Part I: Understanding Big Data, Hadoop 1.0, and 2.0
HOUR 1 Introduction of Big Data, NoSQL, and Business Value Proposition
2 Introduction to Hadoop, Its Architecture, Ecosystem, and Microsoft Offerings
3 Hadoop Distributed File System Versions 1.0 and 2.0
4 The MapReduce Job Framework and Job Execution Pipeline
5 MapReduce—Advanced Concepts and YARN
Part II: Getting Started with HDInsight and Understanding Its Different Components
HOUR 6 Getting Started with HDInsight, Provisioning Your HDInsight Service Cluster, and Automating HDInsight Cluster Provisioning
7 Exploring Typical Components of HDFS Cluster
8 Storing Data in Microsoft Azure Storage Blob
9 Working with Microsoft Azure HDInsight Emulator
Part III: Programming MapReduce and HDInsight Script Action HOUR 10 Programming MapReduce Jobs
11 Customizing the HDInsight Cluster with Script Action
Part IV: Querying and Processing Big Data in HDInsight
HOUR 12 Getting Started with Apache Hive and Apache Tez in HDInsight
14 Consuming HDInsight Data from Microsoft BI Tools over Hive ODBC Driver: Part 1
15 Consuming HDInsight Data from Microsoft BI Tools over Hive ODBC Driver: Part 2
16 Integrating HDInsight with SQL Server Integration Services
17 Using Pig for Data Processing
18 Using Sqoop for Data Movement Between RDBMS and HDInsight
Part V: Managing Workflow and Performing Statistical Computing HOUR 19 Using Oozie Workflows and Job Orchestration with HDInsight
20 Performing Statistical Computing with R
Part VI: Performing Interactive Analytics and Machine Learning HOUR 21 Performing Big Data Analytics with Spark
22 Microsoft Azure Machine Learning
Part VII: Performing Real-time Analytics
HOUR 23 Performing Stream Analytics with Storm
Table of Contents
Introduction
Part I: Understanding Big Data, Hadoop 1.0, and 2.0
HOUR 1: Introduction of Big Data, NoSQL, and Business Value Proposition
Types of Analysis Types of Data Big Data
Managing Big Data NoSQL Systems
Big Data, NoSQL Systems, and the Business Value Proposition Application of Big Data and Big Data Solutions
Summary Q&A
HOUR 2: Introduction to Hadoop, Its Architecture, Ecosystem, and Microsoft Offerings
What Is Apache Hadoop?
Architecture of Hadoop and Hadoop Ecosystems What’s New in Hadoop 2.0
Architecture of Hadoop 2.0
Tools and Technologies Needed with Big Data Analytics Major Players and Vendors for Hadoop
Deployment Options for Microsoft Big Data Solutions Summary
Q&A
HOUR 3: Hadoop Distributed File System Versions 1.0 and 2.0
HDFS Architecture Rack Awareness WebHDFS
Accessing and Managing HDFS Data What’s New in HDFS 2.0
Summary Q&A
HOUR 4: The MapReduce Job Framework and Job Execution Pipeline
Introduction to MapReduce MapReduce Architecture
MapReduce Job Execution Flow Summary
Q&A
HOUR 5: MapReduce—Advanced Concepts and YARN
DistributedCache Hadoop Streaming MapReduce Joins Bloom Filter
Performance Improvement Handling Failures
Counter YARN
Uber-Tasking Optimization Failures in YARN
Resource Manager High Availability and Automatic Failover in YARN Summary
Q&A
Components
HOUR 6: Getting Started with HDInsight, Provisioning Your HDInsight Service Cluster, and Automating HDInsight Cluster Provisioning
Introduction to Microsoft Azure Understanding HDInsight Service
Provisioning HDInsight on the Azure Management Portal Automating HDInsight Provisioning with PowerShell
Managing and Monitoring HDInsight Cluster and Job Execution Summary
Q&A Exercise
HOUR 7: Exploring Typical Components of HDFS Cluster
HDFS Cluster Components HDInsight Cluster Architecture High Availability in HDInsight Summary
Q&A
HOUR 8: Storing Data in Microsoft Azure Storage Blob
Understanding Storage in Microsoft Azure Benefits of Azure Storage Blob over HDFS Azure Storage Explorer Tools
Summary Q&A
HOUR 9: Working with Microsoft Azure HDInsight Emulator
Getting Started with HDInsight Emulator
Q&A
Part III: Programming MapReduce and HDInsight Script Action HOUR 10: Programming MapReduce Jobs
MapReduce Hello World!
Analyzing Flight Delays with MapReduce Serialization Frameworks for Hadoop Hadoop Streaming
Summary Q&A
HOUR 11: Customizing the HDInsight Cluster with Script Action
Identifying the Need for Cluster Customization Developing Script Action
Consuming Script Action
Running a Giraph job on a Customized HDInsight Cluster Testing Script Action with HDInsight Emulator
Summary Q&A
Part IV: Querying and Processing Big Data in HDInsight
HOUR 12: Getting Started with Apache Hive and Apache Tez in HDInsight
Introduction to Apache Hive
Getting Started with Apache Hive in HDInsight Azure HDInsight Tools for Visual Studio
Programmatically Using the HDInsight .NET SDK Introduction to Apache Tez
HOUR 13: Programming with Apache Hive, Apache Tez in HDInsight, and Apache HCatalog
Programming with Hive in HDInsight Using Tables in Hive
Serialization and Deserialization Data Load Processes for Hive Tables Querying Data from Hive Tables Indexing in Hive
Apache Tez in Action Apache HCatalog Summary
Q&A Exercise
HOUR 14: Consuming HDInsight Data from Microsoft BI Tools over Hive ODBC Driver: Part 1
Introduction to Hive ODBC Driver Introduction to Microsoft Power BI
Accessing Hive Data from Microsoft Excel Summary
Q&A
HOUR 15: Consuming HDInsight Data from Microsoft BI Tools over Hive ODBC Driver: Part 2
Accessing Hive Data from PowerPivot Accessing Hive Data from SQL Server
Accessing HDInsight Data from Power Query Summary
Q&A Exercise
Services
The Need for Data Movement Introduction to SSIS
Analyzing On-time Flight Departure with SSIS Provisioning HDInsight Cluster
Summary Q&A
HOUR 17: Using Pig for Data Processing
Introduction to Pig Latin
Using Pig to Count Cancelled Flights Using HCatalog in a Pig Latin Script Submitting Pig Jobs with PowerShell Summary
Q&A
HOUR 18: Using Sqoop for Data Movement Between RDBMS and HDInsight
What Is Sqoop?
Using Sqoop Import and Export Commands Using Sqoop with PowerShell
Summary Q&A
Part V: Managing Workflow and Performing Statistical Computing HOUR 19: Using Oozie Workflows and Job Orchestration with HDInsight
Introduction to Oozie
Oozie Compared to SSIS Summary
Q&A
HOUR 20: Performing Statistical Computing with R
Introduction to R
Integrating R with Hadoop Enabling R on HDInsight Summary
Q&A
Part VI: Performing Interactive Analytics and Machine Learning HOUR 21: Performing Big Data Analytics with Spark
Introduction to Spark
Spark Programming Model
Blending SQL Querying with Functional Programs Summary
Q&A
HOUR 22: Microsoft Azure Machine Learning
History of Traditional Machine Learning Introduction to Azure ML
Azure ML Workspace
Processes to Build Azure ML Solutions Getting Started with Azure ML
Creating Predictive Models with Azure ML Publishing Azure ML Models as Web Services Summary
Q&A Exercise
HOUR 23: Performing Stream Analytics with Storm
Introduction to Storm
Using SCP.NET to Develop Storm Solutions
Analyzing Speed Limit Violation Incidents with Storm Summary
Q&A
HOUR 24: Introduction to Apache HBase on HDInsight
Introduction to Apache HBase HBase Architecture
Creating HDInsight Cluster with HBase Summary
Q&A
About the Authors
Arshad Ali has more than 13 years of experience in the computer industry. As a DB/DW/BI consultant in an end-to-end delivery role, he has been working on several enterprise-scale data warehousing and analytics projects for enabling and developing business intelligence and analytic solutions. He specializes in database, data warehousing, and business intelligence/analytics application design, development, and deployment at the enterprise level. He frequently works with SQL Server, Microsoft Analytics Platform System (APS, or formally known as SQL Server Parallel Data Warehouse [PDW]), HDInsight (Hadoop, Hive, Pig, HBase, and so on), SSIS, SSRS, SSAS, Service Broker, MDS, DQS, SharePoint, and PPS. In the past, he has also handled performance optimization for several projects, with significant performance gain.
Arshad is a Microsoft Certified Solutions Expert (MCSE)–SQL Server 2012 Data Platform, and Microsoft Certified IT Professional (MCITP) in Microsoft SQL Server 2008–Database Development, Data Administration, and
Business Intelligence. He is also certified on ITIL 2011 foundation.
He has worked in developing applications in VB, ASP, .NET, ASP.NET, and C#. He is a Microsoft Certified Application Developer (MCAD) and
Microsoft Certified Solution Developer (MCSD) for the .NET platform in Web, Windows, and Enterprise.
Arshad has presented at several technical events and has written more than 200 articles related to DB, DW, BI, and BA technologies, best practices, processes, and performance optimization techniques on SQL Server, Hadoop, and related technologies. His articles have been published on several
prominent sites.
On the educational front, Arshad holds a Master in Computer Applications degree and a Master in Business Administration in IT degree.
Arshad can be reached at [email protected], or visit
http://arshadali.blogspot.in/ to connect with him.
valuable insights from their data.
Manpreet has been working on Microsoft technologies for more than 8 years, with a strong focus on Microsoft Business Intelligence Stack, SharePoint BI, and Microsoft’s Big Data Analytics Platforms (Analytics Platform System and HDInsight). He also specializes in Mobile Business Intelligence solution development and has helped businesses deliver a consolidated view of their data to their mobile workforces.
Manpreet has coauthored books and technical articles on Microsoft
technologies, focusing on the development of data analytics and visualization solutions with the Microsoft BI Stack and SharePoint. He holds a degree in computer science and engineering from Panjab University, India.
Dedications
Arshad:
To my parents, the late Mrs. and Mr. Md Azal Hussain, who brought me into this beautiful world
and made me the person I am today. Although they couldn’t be here to see this day, I am sure
they must be proud, and all I can say is, “Thanks so much—I love you both.” And to my beautiful wife, Shazia Arshad Ali, who motivated me to take up the
challenge of writing
this book and who supported me throughout this journey.
And to my nephew, Gulfam Hussain, who has been very excited for me to be an author and
has been following up with me on its progress regularly and supporting me, where he could,
in completing this book.
Finally, I would like to dedicate this to my school teacher, Sankar Sarkar, who shaped my career
with his patience and perseverance and has been truly an inspirational source.
Manpreet:
Acknowledgments
This book would not have been possible without support from some of our special friends. First and foremost, we would like to thank Yaswant
Vishwakarma, Vijay Korapadi, Avadhut Kulkarni, Kuldeep Chauhan, Rajeev Gupta, Vivek Adholia, and many others who have been inspirations and supported us in writing this book, directly or indirectly. Thanks a lot, guys— we are truly indebted to you all for all your support and the opportunity you have given us to learn and grow.
We also would like to thank the entire Pearson team, especially Mark Renfrow and Joan Murray, for taking our proposal from dream to reality. Thanks also to Shayne Burgess and Ron Abellera for reading the entire draft of the book and providing very helpful feedback and suggestions.
Thanks once again—you all rock! Arshad
We Want to Hear from You!
As the reader of this book, you are our most important critic and
commentator. We value your opinion and want to know what we’re doing right, what we could do better, what areas you’d like to see us publish in, and any other words of wisdom you’re willing to pass our way.
We welcome your comments. You can email or write to let us know what you did or didn’t like about this book—as well as what we can do to make our books better.
Please note that we cannot help you with technical problems related to the topic of this book.
When you write, please be sure to include this book’s title and authors as well as your name and email address. We will carefully review your comments and share them with the authors and editors who worked on the book. Email: [email protected]
Mail: Sams Publishing
ATTN: Reader Feedback 800 East 96th Street
Reader Services
Introduction
“The information that’s stored in our databases and spreadsheets cannot speak for itself. It has important stories to tell and only we can give them a voice.” —Stephen Few
Hello, and welcome to the world of Big Data! We are your authors, Arshad Ali and Manpreet Singh. For us, it’s a good sign that you’re actually reading this introduction (so few readers of tech books do, in our experiences).
Perhaps your first question is, “What’s in it for me?” We are here to give you those details with minimal fuss.
Never has there been a more exciting time in the world of data. We are seeing the convergence of significant trends that are fundamentally transforming the industry and ushering in a new era of technological innovation in areas such as social, mobility, advanced analytics, and machine learning. We are
witnessing an explosion of data, with an entirely new scale and scope to gain insights from. Recent estimates say that the total amount of digital
information in the world is increasing 10 times every 5 years. Eighty-five percent of this data is coming from new data sources (connected devices, sensors, RFIDs, web blogs, clickstreams, and so on), and up to 80 percent of this data is unstructured. This presents a huge opportunity for an
organization: to tap into this new data to identify new opportunity and areas for innovation.
To store and get insight into this humongous volume of different varieties of data, known as Big Data, an organization needs tools and technologies. Chief among these is Hadoop, for processing and analyzing this ambient data born outside the traditional data processing platform. Hadoop is the open source implementation of the MapReduce parallel computational engine and
environment, and it’s used quite widely in processing streams of data that go well beyond even the largest enterprise data sets in size. Whether it’s sensor, clickstream, social media, telemetry, location based, or other data that is generated and collected in large volumes, Hadoop is often on the scene to process and analyze it.
Analytics has been in use (mostly with organizations’ internal data) for several years now, but its use with Big Data is yielding tremendous
different formats, to identify new opportunities and areas of innovation by analyzing patterns, customer responses or behavior, market trends,
competitors’ take, research data from governments or organizations, and more. This provides an opportunity to not only look back on the past, but also look forward to understand what might happen in the future, using predictive analytics.
In this book, we examine what constitutes Big Data and demonstrate how organizations can tap into Big Data using Hadoop. We look at some important tools and technologies in the Hadoop ecosystem and, more important, check out Microsoft’s partnership with Hortonworks/Cloudera. The Hadoop distribution for the Windows platform or on the Microsoft Azure Platform (cloud computing) is an enterprise-ready solution and can be
integrated easily with Microsoft SQL Server, Microsoft Active Directory, and System Center. This makes it dramatically simpler, easier, more efficient, and more cost effective for your organization to capitalize on the opportunity Big Data brings to your business. Through deep integration with Microsoft
Business Intelligence tools (PowerPivot and Power View) and EDW tools (SQL Server and SQL Server Parallel Data Warehouse), Microsoft’s Big Data solution also offers customers deep insights into their structured and unstructured data with the tools they use every day.
This book primarily focuses on the Hadoop (Hadoop 1.* and Hadoop 2.*) distribution for Azure, Microsoft HDInsight. It provides several advantages over running a Hadoop cluster over your local infrastructure. In terms of programming MapReduce jobs or Hive or PIG queries, you will see no differences; the same program will run flawlessly on either of these two Hadoop distributions (or even on other distributions), or with minimal changes, if you are using cloud platform-specific features. Moreover,
integrating Hadoop and cloud computing significantly lessens the total cost ownership and delivers quick and easy setup for the Hadoop cluster. (We demonstrate how to set up a Hadoop cluster on Microsoft Azure in Hour 6, “Getting Started with HDInsight, Provisioning Your HDInsight Service Cluster, and Automating HDInsight Cluster Provisioning.”)
Consider some forecasts from notable research analysts or research organizations:
McKinsey Global Survey Results, Minding Your Digital Business, 2012 “By 2015, 4.4 million IT jobs globally will be created to support Big Data, generating 1.9 million IT jobs in the United States. Only one third of skill sets will be available by that time.”—Peter Sondergaard, Senior Vice President at Gartner and Global Head of Research
“By 2015, businesses (organizations that are able to take advantage of Big Data) that build a modern information management system will outperform their peers financially by 20 percent.”—Gartner, Mark Beyer, Information Management in the 21st Century
“By 2020, the amount of digital data produced will exceed 40 zettabytes, which is the equivalent of 5,200GB of data for every man, woman, and child on Earth.”—Digital Universe study
IDC has published an analysis predicting that the market for Big Data will grow to over $19 billion by 2015. This includes growth in partner services to $6.5 billion in 2015 and growth in software to $4.6 billion in 2015. This represents 39 percent and 34 percent compound annual growth rates, respectively.
We hope you enjoy reading this book and gain an understanding of and expertise on Big Data and Big Data analytics. We especially hope you learn how to leverage Microsoft HDInsight to exploit its enormous opportunities to take your organization way ahead of your competitors.
We would love to hear your feedback or suggestions for improvement. Feel free to share with us (Arshad Ali, [email protected], and Manpreet Singh,
[email protected]) so that we can incorporate it into the next release. Welcome to the world of Big Data and Big Data analytics with Microsoft HDInsight!
Who Should Read This Book
What do you hope to get out of this book? As we wrote this book, we had the following audiences in mind:
Developers—Developers (especially business intelligence developers) worldwide are seeing a growing need for practical, step-by-step
expert. Here you’ll learn how to build the next generation of apps that include such capabilities.
Data scientists—As a data scientist, you are already familiar with the processes of acquiring, transforming, and integrating data into your work and performing advanced analytics. This book introduces you to modern tools and technologies (ones that are prominent, inexpensive, flexible, and open source friendly) that you can apply while acquiring, transforming, and integrating Big Data and performing advanced analytics.
By the time you complete this book, you’ll be quite comfortable with the latest tools and technologies.
Business decision makers—Business decision makers around the world, from many different organizations, are looking to unlock the value of data to gain actionable insights that enable their businesses to stay ahead of competitors. This book delves into advanced analytics applications and case studies based on Big Data tools and technologies, to accelerate your business goals.
Students aspiring to be Big Data analysts—As you are getting ready to transition from the academic to the corporate world, this books helps you build a foundational skill set to ace your interviews and
successfully deliver Big Data projects in a timely manner. Chapters were designed to start at the ground level and gradually take you to an expert level.
Don’t worry if you don’t fit into any of these classifications. Set your sights on learning as much as you can and having fun in the process, and you’ll do fine!
How This Book Is Organized
This book begins with the premise that you can learn what Big Data is, including the real-life applications of Big Data and the prominent tools and technologies to use Big Data solutions to quickly tap into opportunity, by studying the material in 24 1-hour sessions. You might use your lunch break as your training hour, or you might study for an hour before you go to bed at night.
structured the content:
Hour 1, “Introduction of Big Data, NoSQL, and Business Value
Proposition,” introduces you to the world of Big Data and explains how an organization that leverages the power of Big Data analytics can both remain competitive and beat out its competitors. It explains Big Data in detail, along with its characteristics and the types of analysis
(descriptive, predictive, and prescriptive) an organization does with Big Data. Finally, it sets out the business value proposition of using Big Data solutions, along with some real-life examples of Big Data solutions.
This hour also summarizes the NoSQL technologies used to manage and process Big Data and explains how NoSQL systems differ from traditional database systems (RDBMS).
In Hour 2, “Introduction to Hadoop, Its Architecture, Ecosystem, and Microsoft Offerings,” you look at managing Big Data with Apache Hadoop. This hour is rooted in history: It shows how Hadoop evolved from infancy to Hadoop 1.0 and then Hadoop 2.0, highlighting
architectural changes from Hadoop 1.0 to Hadoop 2.0. This hour also focuses on understanding other software and components that make up the Hadoop ecosystem and looks at the components needed in different phases of Big Data analytics. Finally, it introduces you to Hadoop
vendors, evaluates their offerings, and analyzes Microsoft’s deployment options for Big Data solutions.
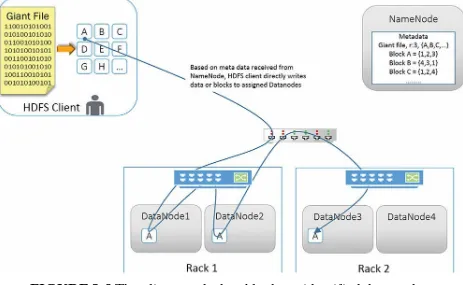
In Hour 3, “Hadoop Distributed File System Versions 1.0 and 2.0,” you learn about HDFS, its architecture, and how data gets stored. You also look into the processes of reading from HDFS and writing data to
HDFS, as well as internal behavior to ensure fault tolerance. At the end of the hour, you take a detailed look at HDFS 2.0, which comes as a part of Hadoop 2.0, to see how it overcomes the limitations of Hadoop 1.0 and provides high-availability and scalability enhancements.
In Hour 4, “The MapReduce Job Framework and Job Execution Pipeline,” you explore the MapReduce programming paradigm, its architecture, the components of a MapReduce job, and MapReduce job execution flow.
Streaming, MapReduce joins, distributed caches, failures and how they are handled transparently, and performance optimization for your
MapReduce jobs).
In Hadoop 2.0, YARN ushers in a major architectural change and opens a new window for scalability, performance, and multitenancy. In this hour, you learn about the YARN architecture, its components, the YARN job execution pipeline, and how failures are handled
transparently.
In Hour 6, “Getting Started with HDInsight, Provisioning Your HDInsight Service Cluster, and Automating HDInsight Cluster Provisioning,” you delve into the HDInsight service. You also walk through a step-by-step process for quickly provisioning HDInsight or a Hadoop cluster on Microsoft Azure, either interactively using Azure Management Portal or automatically using PowerShell scripting. In Hour 7, “Exploring Typical Components of HDFS Cluster,” you
explore the typical components of an HDFS cluster: the name node, secondary name node, and data nodes. You also learn how HDInsight separates the storage from the cluster and relies on Azure Storage Blob instead of HDFS as the default file system for storing data. This hour provides more details on these concepts in the context of the HDInsight service.
Hour 8, “Storing Data in Microsoft Azure Storage Blob,” shows you how HDInsight supports both the Hadoop Distributed File System (HDFS) and Azure Storage Blob for storing user data (although HDInsight relies on Azure storage blob as the default file system instead of HDFS for storing data). This hour explores Azure Storage Blob in the context of HDInsight and concludes by discussing the impact of blob storage on performance and data locality.
Hour 9, “Working with Microsoft Azure HDInsight Emulator,” is devoted to Microsoft’s HDInsight emulator. HDInsight emulator emulates a single-node cluster and is well suited to development scenarios and experimentation. This hour focuses on setting up the HDInsight emulator and executing a MapReduce job to test its functionality.
MapReduce programs in Java and C#. It presents a real-life scenario that analyzes flight delays with MapReduce and concludes with a discussion on serialization options for Hadoop.
Hour 11, “Customizing the HDInsight Cluster with Script Action,” looks at the HDInsight cluster that comes preinstalled with a number of frequently used components. It also introduces customization options for the HDInsight cluster and walks you through the process for
installing additional Hadoop ecosystem projects using a feature called Script Action. In addition, this hour introduces the HDInsight Script Action feature and illustrates the steps in developing and deploying a Script Action.
In Hour 12, “Getting Started with Apache Hive and Apache Tez in HDInsight,” you learn about how you can use Apache Hive. You learn different ways of writing and executing HiveQL queries in HDInsight and see how Apache Tez significantly improves overall performance for HiveQL queries.
In Hour 13, “Programming with Apache Hive, Apache Tez in HDInsight, and Apache HCatalog,” you extend your expertise on Apache Hive and see how you can leverage it for ad hoc queries and data analysis. You also learn about some of the important commands you will use in Apache Hive for data loading and querying. At the end this hour, you look at Apache HCatalog, which has merged with
Apache Hive, and see how to leverage the Apache Tez execution engine for Hive query execution to improve the performance of your query.
Hour 14, “Consuming HDInsight Data from Microsoft BI Tools over Hive ODBC Driver: Part 1,” shows you how to use the Microsoft Hive ODBC driver to connect and pull data from Hive tables from different Microsoft Business Intelligence (MSBI) reporting tools, for further analysis and ad hoc reporting.
In Hour 16, “Integrating HDInsight with SQL Server Integration Services,” you see how you can use SQL Server Integration Services (SSIS) to build data integration packages to transfer data between an HDInsight cluster and a relational database management system (RDBMS) such as SQL Server.
Hour 17, “Using Pig for Data Processing,” explores Pig Latin, a workflow-style procedural language that makes it easier to specify transformation operations on data. This hour provides an introduction to Pig for processing Big Data sets and illustrates the steps in
submitting Pig jobs to the HDInsight cluster.
Hour 18, “Using Sqoop for Data Movement Between RDBMS and HDInsight,” demonstrates how Sqoop facilitates data migration
between relational databases and Hadoop. This hour introduces you to the Sqoop connector for Hadoop and illustrates its use in data migration between Hadoop and SQL Server/SQL Azure databases.
Hour 19, “Using Oozie Workflows and Job Orchestration with HDInsight,” looks at data processing solutions that require multiple jobs chained together in particular sequence to accomplish a processing task in the form of a conditional workflow. In this hour, you learn to use Oozie, a workflow development component within the Hadoop ecosystem.
Hour 20, “Performing Statistical Computing with R,” focuses on the R language, which is popular among data scientists for analytics and statistical computing. R was not designed to work with Big Data because it typically works by pulling data that persists elsewhere into memory. However, recent advancements have made it possible to leverage R for Big Data analytics. This hour introduces R and looks at the approaches for enabling R on Hadoop.
Hour 21, “Performing Big Data Analytics with Spark,” introduces Spark, briefly explores the Spark programming model, and takes a look at Spark integration with SQL.
In Hour 23, “Performing Stream Analytics with Storm,” you learn about Apache Storm and explore its use in performing real-time Stream analytics.
Hour 24, “Introduction to Apache HBase on HDInsight,” you learn about Apache HBase, when to use it, and how you can leverage it with HDInsight service.
Conventions Used in This Book
In our experience as authors and trainers, we’ve found that many readers and students skip over this part of the book. Congratulations for reading it! Doing so will pay big dividends because you’ll understand how and why we
formatted this book the way we did.
Try It Yourself
Throughout the book, you’ll find Try It Yourself exercises, which are opportunities for you to apply what you’re learning right then and there. I believe in knowledge stacking, so you can expect that later Try It Yourself exercises assume that you know how to do stuff you did in previous
exercises. Therefore, your best bet is to read each chapter in sequence and work through every Try It Yourself exercise.
System Requirements
You don’t need a lot, computer wise, to perform all the Try It Yourself exercises in this book. However, if you don’t meet the necessary system requirements, you’re stuck. Make sure you have the following before you begin your work:
A Windows-based computer—Technically, you don’t need a
computer that runs only Microsoft Windows: Microsoft Azure services can be accessed and consumed using web browsers from any platform. However, if you want to use HDInsight emulator, you need to have a machine (virtual or physical) with the Microsoft Windows operating system.
An Internet connection—Microsoft HDInsight service is available on the cloud platform, so while you are working with it, you’ll be
An Azure subscription—You need an Azure subscription to use the platform or services available in Azure. Microsoft offers trial
subscriptions of the Microsoft Azure subscription service used for learning or evaluation purposes.
Hour 1. Introduction of Big Data, NoSQL, and
Business Value Proposition
What You’ll Learn in This Hour:
Types of Analysis Types of Data Big Data
Managing Big Data NoSQL Systems
Big Data, NoSQL Systems, and the Business Value Proposition
Application of Big Data and Big Data Solutions
This hour introduces you to the world of Big Data and shows how an
organization can leverage the power of Big Data analytics to triumph over its competitors. You examine Big Data in detail, identify its characteristics, and look at the different types of analysis (descriptive, predictive, and
prescriptive) an organization performs.
Later in the hour, you explore NoSQL technologies to manage and process Big Data and see how NoSQL systems differ from traditional database systems (RDBMS). You delve into the different types of NoSQL systems (like key-value store databases, columnar or column-oriented [also known as column-store databases], document-oriented databases, and graph databases) and explore the benefits and limitations of using NoSQL systems. At the end of the hour, you learn about the business value proposition of using Big Data solutions and take a look at some real-life examples of Big Data solutions in use.
Types of Analysis
collecting vast amounts of data with their own systems, including data from
Companies also use external sources, such as the social networking sites Facebook, Twitter, and LinkedIn, to analyze customer sentiment about their products and services. Data can even be generated from connected mobile devices, government, and research bodies for use in analyzing market trends and opportunities, industry news, and business forecasts.
The capability to collect a vast amount of data from different sources enables an organization to gain a competitive advantage. A company can then better position itself or its products and services in a more favorable market (where and how) to reach targeted customers (who) at their most receptive times (when), and then listen to its customers for suggestions (feedback and customer service). More important, a company can ultimately offer something that makes sense to customers (what).
Analytics essentially enables organizations to carry out targeted campaigns, cross-sales recommendations, online advertising, and more. But before you start your journey into the world of Big Data, NoSQL, and business analytics, you need to know the types of analysis an organization generally conducts. Companies perform three basic types of analysis on collected data (see Figure 1.1):
FIGURE 1.1 Business intelligence and Big Data analysis types.
Predictive analysis—Predictive analysis helps an organization
understand what can happen in the future based on identified patterns in the data, using statistical and machine learning techniques. Predictive analysis is also referred to as data mining or machine learning. This type of analysis uses time series, neural networks, and regression algorithms to predict the future. Predictive analysis enables companies to answer these types of questions:
Which stocks should we target as part of our portfolio management? Did some stocks show haphazard behavior? Which factors are
impacting the stock gains the most?
How and why are users of e-commerce platforms, online games, and web applications behaving in a particular way?
How do we optimize the routing of our fleet of vehicles based on weather and traffic patterns?
How do we better predict future outcomes based on an identified pattern?
Prescriptive analysis—Some researchers refer to this analysis as the final phase in business analytics. Organizations can predict the likely outcome of various corrective measures using optimization and
simulation techniques. For example, prescriptive analysis can use linear programming, Monte Carlo simulation, or game theory for channel management or portfolio optimization.
Types of Data
Structured Data
Structured data adheres to the predefined fixed schema and strict data model structure—think of a table in the relational database system. A row in the table always has the same number of columns of the same type of other rows (although some columns might contain blank or NULL values), per the
predefined schema of the table. With structured data, changes to the schema are assumed to be rare and, hence, the data model is rigid.
Unstructured Data
Unlike structured data, unstructured data has no identifiable internal
structure. It does not have a predefined, fixed schema, but instead has a free-form structure. Unstructured data includes proprietary documents, bitmap images and objects, text, and other data types that are not part of a database system. Examples include photos and graphic images, audio and video, streaming instrument data, web pages, emails, blog entries, wikis, portable document format (PDF) documents, Word or Excel documents, and
PowerPoint presentations. Unstructured data constitutes most enterprise data today.
In Excel documents, for example, the content might contain data in structured tabular format, but the Excel document itself is considered unstructured data. Likewise, email messages are organized on the email server in a structured format in the database system, but the body of the message has a free-form structure with no structure.
Semi-Structured Data
Semi-structured data is a hybrid between structured and unstructured data. It usually contains data in structured format but a schema that is not predefined and not rigid. Unlike structured data, semi-structured data lacks the strict data model structure. Examples are Extensible Markup Language (XML) or
JavaScript Object Notation (JSON) documents, which contain tags (elements or attributes) to identify specific elements within the data, but without a rigid structure to adhere to.
Unlike in a relational table, in which each row has the same number of columns, each entity in semi-structured data (analogous to a row in a
Note: By the Way
For simplicity, we use “structured and unstructured data” to refer to the collection of structured, semi-structured, and unstructured data. Semi-structured data usually is grouped with unstructured data even though it differs slightly from purely unstructured data.
Big Data
The phrase data explosion refers to the vast amount of data (structured, semi-structured, and unstructured) organizations generate every day, both
internally and externally, at a speed that is practically impossible for their current data processing systems to collect and process. Ironically,
organizations cannot afford to ignore the data because it provides insight into how they can gain competitive advantages. In some cases, organizations are required to store large amounts of structured and unstructured data
(documents, email messages, chat history, audio, video, and other forms of electronic communication) to comply with government regulations.
Fortunately, the cost of storage devices has decreased significantly, enabling companies to store Big Data that they previously would have purged
regularly.
Big Data is primarily characterized by the three Vs (see Figure 1.2): Volume
Variety Velocity
FIGURE 1.2 Big Data characteristics.
Volume Characteristics of Big Data
Big data can be stored in volumes of terabytes, petabytes, and even beyond. Now the focus is not only human-generated data (mostly structured, as a small percentage of overall data), but also data generated by machines such as sensors, connected devices, and Radio-Frequency Identification (RFID) devices (mostly unstructured data, as a larger percentage overall). (See Figure 1.3.)
FIGURE 1.3 Volume characteristics of Big Data.
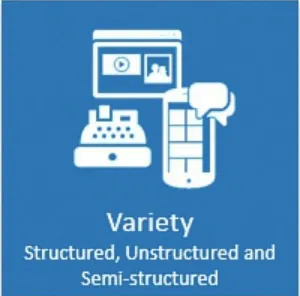
Variety Characteristics of Big Data
Variety refers to the management of structured, semi-structured, and unstructured data (see Figure 1.4). Semi-structured and unstructured data includes but is not limited to text, images, legacy documents, audio, video, PDFs, clickstream data, web log data, and data gathered from social media. Most of this unstructured data is generated from sensors, connected devices, clickstream, and web logs, and can constitute up to 80 percent of overall Big Data.
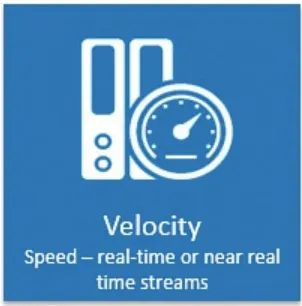
Velocity Characteristics of Big Data
Velocity refers to the pace at which data arrives and usually refers to a real-time or near-real-real-time stream of data (see Figure 1.5). Examples include trading and stock exchange data and sensors attached to production line machinery to continuously monitor status.
FIGURE 1.5 Velocity characteristic of Big Data.
For Big Data, velocity also refers to the required speed of data insight. Recently, some authors and researchers have added another V to define the characteristic of Big Data: variability. This characteristic refers to the many possible interpretations of the same data. Similarly, veracity defines the uncertainty (credibility of the source of data might not be verifiable and hence suitability of the data for target audience might be questionable) in collected data. Nonetheless, the premise of Big Data remains the same as discussed earlier.
Big Data is generally synonymous with Hadoop, but the two are not really the same. Big Data refers to a humongous volume of different types of data with the characteristics of volume, variety, and velocity that arrives at a very fast pace. Hadoop, on the other hand, is one of the tools or technologies used to store, manage, and process Big Data.
GO TO We talk in greater detail about Hadoop and its architecture in Hour 2, “Introduction to Hadoop, Its Architecture, Ecosystem, and Microsoft Offerings.”
What Big Data Is Not
manage Big Data, and Hadoop is one among them. Hadoop is a mature, fault-tolerant platform that can handle the distributed storage and processing of Big Data.
GO TO We talk about Hadoop in greater detail in Hour 2.
So far, we have talked about Big Data and looked at future trends in analytics on Big Data. Now let’s dive deeper to understand the different tools and technologies used to store, manage, and process Big Data.
Managing Big Data
An organization cannot afford to delete data (especially Big Data) if it wants to outperform its competitors. Tapping into the opportunities Big Data offers makes good business sense for some key reasons.
More Data, More Accurate Models
A substantial number and variety of data sources generate large quantities of data for businesses. These include connected devices, sensors, RFIDs, web clicks, and web logs (see Figure 1.6). Organizations now realize that data is too valuable to delete, so they need to store, manage, and process that data.
FIGURE 1.6 Getting insight into Big Data.
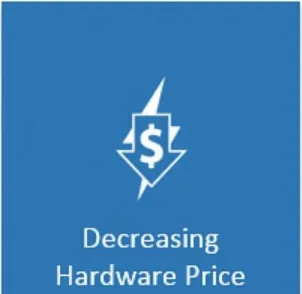
More—and Cheaper—Computing Power and Storage
The dramatic decline in the cost of computing hardware resources (see Figure 1.7), especially the cost of storage devices, is one factor that enables
FIGURE 1.7 Decreasing hardware prices.
Increased Awareness of the Competition and a Means to
Proactively Win Over Competitors
Companies want to leverage all possible means to remain competitive and beat their competitors. Even with the advent of social media, a business needs to analyze data to understand customer sentiment about the organization and its products or services. Companies also want to offer customers what they want through targeted campaigns and seek to understand reasons for
customer churn (the rate of attrition in the customer base) so that they can take proactive measures to retain customers. Figure 1.8 shows increased awareness and customer demands.
FIGURE 1.8 Increased awareness, realization, and demand.
Availability of New Tools and Technologies to Process and
Manage Big Data
DocumentDB, and Cassandra, among others. We cover Hadoop and its architecture in more detail in Hour 2.
NoSQL Systems
If you are a Structured Query Language (SQL) or Relational Database Management System (RDBMS) expert, you first must know that you don’t need to worry about NoSQL—these two technologies serve a very different purpose. NoSQL is not a replacement of the familiar SQL or RDBMS
technologies, although, of course, learning these new tools and technologies will give you better perspective and help you think of an organizational problem in a holistic manner. So why do we need NoSQL? The sheer volume, velocity, and variety of Big Data are beyond the capabilities of RDBMS technologies to process in a timely manner. NoSQL tools and technologies are essential for processing Big Data.
NoSQL stands for Not Only SQL and is complimentary to the existing SQL or RDBMS technologies. For some problems, storage and processing
solutions other than RDBMS are more suitable—both technologies can coexist, and each has its own place. RDBMS still dominates the market, but NoSQL technologies are catching up to manage Big Data and real-time web applications.
In many scenarios, both technologies are being used to provide an enterprise-wide business intelligence and business analytics systems. In these integrated systems, NoSQL systems store and manage Big Data (with no schema) and RDBMS stores the processed data in relational format (with schema) for a quicker query response time.
NoSQL Versus RDBMS
RDBMS systems are also called schema-first because RDBMS supports creating a relation, or a table structure to store data in rows and columns (a predefined normalized structure) and then join them using a relationship between the primary key and a foreign key. Data gets stored in these
changing the schema later requires a significant amount of effort and time. As you can see in Figure 1.9, once you have a data model in place, you must store the data in stages, apply cleansing and transformation, and then move the final set of data to the data warehouse for analysis. This overall process of loading data into an RDBMS system is not suitable for Big Data. Figure 1.9
shows the stages in analysis of structured data in RDBMS—Relation Data Warehouse.
FIGURE 1.9 Stages in the analysis of structured data in RDBMS— Relation Data Warehouse.
In contrast to RDBMS systems, NoSQL systems are called schema-later because they don’t have the strict requirement of defining the schema or structure of data before the actual data load process begins. For example, you can continue to store data in a Hadoop cluster as it arrives in Hadoop
Distributed File System (HDFS; you learn more about it in Hour 3, “Hadoop Distributed File System Versions 1.0 and 2.0”) (in files and folders), and then later you can use Hive to define the schema for querying data from the
folders. Likewise, other document-oriented NoSQL systems support storing data in documents using the flexible JSON format. This enables the
FIGURE 1.10 Stages in analysis of Big Data in NoSQL systems.
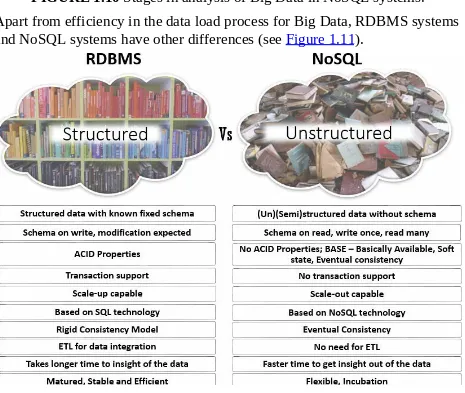
Apart from efficiency in the data load process for Big Data, RDBMS systems and NoSQL systems have other differences (see Figure 1.11).
FIGURE 1.11 Differences between RDBMS and NoSQL systems.
Major Types of NoSQL Technologies
Several NoSQL systems are used. For clarity, we have divided them into the typical usage scenarios (for example, Online Transaction Processing [OLTP] or Online Analytical Processing [OLAP]) we often deal with.
couple important supports. This section covers the following four categories of NoSQL systems used with OLTP:
Key-value store databases
Columnar, or column-oriented, or column-store databases Document-oriented databases
Graph databases
GO TO For more information on supports for OLTP, refer to the
“Limitations of NoSQL Systems” section, later in this hour.
Key-Value Store Databases
Key-value store databases store data as a collection of key-value pairs in a way that each possible key appears once, at most, in a collection. This is similar to the hash tables of the programming world, with a unique key and a pointer to a particular item of data. This database stores only pairs of keys and values, and it facilitates retrieving values when a key is known. These mappings are usually accompanied by cache mechanisms, to maximize performance. Key-value stores are probably the simplest type and normally do not fit for all Big Data problems. Key-value store databases are ideal for storing web user profiles, session information, and shopping carts. They are not ideal if a data relationship is critical or a transaction spans keys.
A file system can be considered a key-value store, with the file path/name as the key and the actual file content as the value. Figure 1.12 shows an example of a key-value store.
FIGURE 1.12 Key-value store database storage structure. In another example, with phone-related data, "Phone Number" is
Dozens of key-value store databases are in use, including Amazon Dynamo, Microsoft Azure Table storage, Riak, Redis, and MemCached.
Amazon Dynamo
Amazon Dynamo was developed as an internal technology at Amazon for its e-commerce businesses, to address the need for an incrementally scalable, highly available key-value storage system. It is one of the most prominent key-value store NoSQL databases. Amazon S3 uses Dynamo as its storage mechanism. The technology has been designed to enable users to trade off cost, consistency, durability, and performance while maintaining high availability.
Microsoft Azure Table Storage
Microsoft Azure Table storage is another example of a key-value store that allows for rapid development and fast access to large quantities of data. It offers highly available, massively scalable key-value–based storage so that an application can automatically scale to meet user demand. In Microsoft Azure Table, key-value pairs are called Properties and are useful in filtering and specifying selection criteria; they belong to Entities, which, in turn, are
organized into Tables. Microsoft Azure Table features optimistic concurrency and, as with other NoSQL databases, is schema-less. The properties of each entity in a specific table can differ, meaning that two entities in the same table can contain different collections of properties, and those properties can be of different types.
Columnar or Column-Oriented or Column-Store Databases
Unlike a row-store database system, which stores data from all the columns of a row stored together, a column-oriented database stores the data from a single column together. You might be wondering how a different physical layout representation of the same data (storing the same data in a columnar format instead of the traditional row format) can improve flexibility and performance.
compression, improving the overall performance.
Column-oriented or column-store databases are ideal for site searches, blogs, content management systems, and counter analytics. Figure 1.13 shows the difference between a row store and a column store.
FIGURE 1.13 Row-store versus column-store storage structure. Some RDBMS systems have begun to support storing data in a column-oriented structure, such as SQL Server 2012 and onward. The following NoSQL databases also support column-oriented storage and, unlike RDBMS systems, in which the schema is fixed, allow a different schema for each row.
Apache Cassandra
Facebook developed Apache Cassandra to handle large amounts of data across many commodity servers, providing high availability with no single point of failure. It is the perfect platform for mission-critical data. Cassandra is a good choice when you need scalability and high availability without compromising on performance. Cassandra’s support for replicating across multiple data centers is best-in-class, providing lower latency for users and providing peace of mind that you can survive even regional outages.
Apache HBase is a distributed, versioned, column-oriented database
management system that runs on top of HDFS. An HBase system comprises a set of tables. Each table contains rows and columns, much like in a traditional relational table. Each table must have an element defined as a primary key, and all access attempts to HBase tables must use this primary key. An HBase column represents an attribute of an object. HBase enables many columns to be grouped together into column families, so the elements of a column family are all stored together. This differs from a relational table, which stores
together all the columns of a given row. HBase mandates that you predefine the table schema and specify the column families. However, it also enables you to add columns to column families at any time. The schema is thus flexible and can adapt to changing application requirements. Apache HBase is a good choice when you need random, real-time read/write access to your sparse data sets, which are common in many Big Data use cases. HBase supports writing applications in Avro, REST, and Thrift.
Document-Oriented Databases
Document-oriented databases, such as other NoSQL systems, are designed for horizontal scalability or scale-out needs. (Scaling out refers to spreading the load over multiple hosts.) As your data grows, you can simply add more commodity hardware to scale out and distribute the load. These systems are designed around a central concept of a document. Each document-oriented database implementation differs in the details of this definition, but they all generally assume that documents encapsulate and encode data in some
standard formats or encodings, such as XML, Yet Another Markup Language (YAML), and JSON, as well as binary forms such as Binary JSON (BSON) and PDF.
In the case of a relational table, every record in a table has the same sequence of fields (they contain NULL\empty if they are not being used). This means they have rigid schema. In contrast, a document-oriented database contains collections, analogous to relational tables. Each collection might have fields that are completely different across collections: The fields and their value data types can vary for each collection; furthermore, even the collections can be nested. Figure 1.14 shows the document-oriented database storage
FIGURE 1.14 Document-oriented database storage structure. Document-oriented databases are ideal for storing application logs, articles, blogs, and e-commerce applications. They are also suitable when aggregation is needed. These databases are not ideal when transactions or queries span aggregations.
Several implementations of document-oriented databases exist, including MongoDB, CouchDB, Couchbase, and Microsoft DocumentDB.
MongoDB
insert statement.
CouchDB
Similar to MongoDB, CouchDB is a document-oriented database that stores data in JSON document format. CouchDB has a fault-tolerant storage engine that puts the safety of the data first. Each CouchDB database is a collection of independent documents; each document maintains its own data and self-contained schema. You can use JavaScript as the CouchDB query language for MapReduce programming (for more on this, see Hour 4, “The
MapReduce Job Framework and Job Execution Pipeline”); you can use HTTP for an API because it completely supports the Web and is particularly suited for interactive web applications.
Graph Databases
Graph databases have a concept of nodes, with relationships and properties. Unlike relational tables of rows and columns, and with the rigid structure of RDBMS, a flexible graph model is used that can scale across many machines. A graph database is designed for data that can be better represented as a
graph (elements interconnected with an undetermined number of
relationships between them). For example, this could be social relationships, public transport links, road maps, or network topologies. Examples of graph databases include Sones GraphDB and Neo4j. Figure 1.15 shows the
structure of graph databases at a high level.
Benefits of Using NoSQL Systems
NoSQL systems offer several advantages over traditional relational systems. Consider some advantages of using NoSQL systems:
You don’t need to define the data model, schema, or structure at the beginning of the project. Just keep dumping all the data coming into the NoSQL systems, and process only required data by defining schema for it at the time of the query or when a reporting need arises. This is why NoSQL systems are called schema at read systems.
You don’t need to spend time developing complex ETL (extract, transform, and load) packages for data integration. No overhead is incurred in running those ETL packages on schedule.
You don’t need to worry about data staging or multiple data hops. Simply keep loading the data into the NoSQL system (for example, Hadoop) and analyze the data where it lands.
No upfront investment in data cleansing and massaging is required. Just keep storing all the data that comes in and extract whatever you need for analysis when you need it.
NoSQL systems are designed to be dynamic, horizontal, or scale-out solutions, scaling from a few hosts to hundreds or even thousands of hosts. They distribute the data across multiple hosts as the load
increases and, in parallel, process them locally on each node where data exists (minimizing data movement across nodes) in a distributed
manner.
Most of these NoSQL systems run on commodity hardware (for less expense) and have built-in redundancy and automatic recovery, in case of failure at the software level.
Limitations of NoSQL Systems
NoSQL systems have some limitations. Updates appear every few days or weeks, however, and these systems are maturing with every new release.
NoSQL systems are still evolving, whereas RDBMS systems have been in use for several decades and have both stable and mature
functionality. Many key features have not yet been implemented in NoSQL systems.
teams and high-level support. Almost all major RDBMS systems, on the other hand, come from big companies (such as Microsoft, Oracle, and IBM). Some companies have started to provide their own
distribution of NoSQL systems and offer support for them, but reaching the level of support and confidence that RDBMS vendors provide will take time.
NoSQL systems load data more quickly (because this is a schema-less system), but ad-hoc query and analysis does not work as fast as an RDBMS system. You can choose to have a combination of NoSQL and RDBMS, with NoSQL used for data storage and RDBMS used for processing data or querying for needed data.
Installation, configuration, and maintenance for most NoSQL systems is a hassle, at least for now. If you intend to use Hadoop, you can use Microsoft HDInsight, which is already installed and configured on a cloud platform, offered as Platform As A Service (PaaS). We talk in greater detail about Microsoft HDInsight in Hour 6, “Getting Started with HDInsight, Provisioning Your HDInsight Service Cluster, and Automating HDInsight Cluster Provisioning.”
NoSQL systems are evolving, so users must learn a completely new technology. (This skill shortage does seem to be changing rapidly, though.) On the flip side, almost everyone who has worked on data has experience working with RDBMS (even the shift from one RDBMS system to another one is easier because all the systems are based on ANSI standards for standard features).
Big Data, NoSQL Systems, and the Business Value Proposition
Previously, big companies and well-funded government agencies were the main organizations capable of creating Big Data solutions because
implementing those solutions required huge amounts of hardware, software, training, and time. Now, however, the capability to store and process massive amounts of data is within reach for many organizations because the cost of hardware has gone down dramatically. Consider these business value propositions of managing Big Data and using NoSQL systems:
Organizations are doing analytics to understand what has happened in the past, and also doing predictive analytics to understand or forecast the future and prescriptive analytics to identify the best course of action.
The flexible design (a schema-less architecture) of NoSQL databases makes them a great tool to leverage the power of Big Data.
Horizontal or dynamic scaling (scale-out) of NoSQL systems makes it affordable to start with a small set of commodity hardware (reducing the overall upfront investment in hardware resources) and then add hardware as the load or demand increases.
Built-in redundancy and fault-tolerant capabilities are present at the software level, ensuring higher availability.
A distributed architecture, parallel processing, and load-balancing capabilities are built in to NoSQL systems, enabling them to complete processing in a timely manner. NoSQL is designed for distributed data stores for very large-scale data needs.
NoSQL can handle hierarchical nested data structures easily, as is typical in social networking applications and in the semantic web. Storing and managing such types of complex data in a traditional RDBMS system would require multiple relational tables with all kinds of keys; joining them with massive amounts of data would degrade performance.
The recent integration of NoSQL systems with cloud computing makes NoSQL systems significantly cheaper to use (you pay only for usage) and much faster to set up. For example, now you can create a Hadoop cluster with Microsoft HDInsight in just a few minutes. If your
requirements change and you need a larger cluster, you can simply delete your existing cluster and create a bigger (or smaller) one in a few minutes without losing any data.
Application of Big Data and Big Data Solutions
This section discusses some application or usage scenarios for Big Data, Big Data solutions, and NoSQL systems.
(attrition in the customer base) analysis to identify customers who are most likely to discontinue use of the service or product and then take proactive, corrective measures to retain those customers.
Fraud detection and prevention. Fraud is any intentional act or omission to deceive others for unfair or unlawful gain. Big Data helps you identify
current fraud and any future possibilities, and they provide a robust
mechanism to prevent them. Big Data helps organizations analyze the data from different data sources across a wide range of channels and identify trends, patterns, and anomalies in the transactions. It helps in identifying the outliers and raises red flags on doubtful transactions and situations, to
provide a robust mechanism for preventing them.
Credit scoring and analysis. The possibility that a borrower will default on payments is termed credit risk. With the help of Big Data, the financial services industry creates credit scores and strategies based on both
demographic and customer behavior data, to maintain an optimal ratio of revenue to risk. With this credit scoring, financial services organizations can offer more products to customers who have a lower credit risk and shy away from customers with a higher credit risk. If organizations do offer a product to a customer with a high credit risk, they can use higher interest rates. If a customer is deemed significantly high-risk, the solution can even
automatically decline a transaction, to prevent fraud from ever happening.
Targeted campaigning and recommendations for cross-selling. Big Data paves the way for the marketing team to put the right content in front of the right prospect at the right time to significantly increase profitability,
productivity, and business success by producing automatic recommendations of useful content. For example, an e-commerce site might suggest products you might be interested in buying; this is one example of the
recommendation engine kicking in to provide suggestions based on your interests, likes, or purchase history. The engine also can suggest product alternatives, as well as bundling opportunities, or other products that similar customers purchased.
Organizations can now better understand the impact and influence of their products or services by doing sentimental analysis on data collected from social media, culled from varied populations and geographies. Based on positive and negative sentiments of products and services, organizations can optimize their offerings for a better customer experience.
Weather forecasting. Previously, mostly government agencies used weather forecasting (think of the numerical weather-prediction methods from the National Oceanic and Atmospheric Administration [NOAA] Climate Forecast System and the European Centre for Medium-Range Weather Forecasts [ECMWF]) in rescue operations if a natural calamity was forecast to happen in a particular region. But now even business organizations are leveraging weather forecasting as a way to better target, position, and serve its products and services to its customers.
Businesses take the weather into account when determining how, when, and where to distribute products. For example, an air conditioning
business can correlate heat waves to its supply of air conditioners by looking at historical weather patterns, to ensure their stores (in that specific part of the country) have an adequate supply of air conditioners in summer. Businesses also derive related benefits, such as not having to pay for shipping items from one part of the country to another. A transportation company might use weather forecasting to route or
reroute vehicles appropriately to avoid delay and save on cost.
The energy sector is leveraging Big Data analysis to transform how it forecasts the risk of extreme weather events on the horizon. From gas and power futures to grid infrastructure planning, the implications of Big Data analysis for the energy sector are huge. Although companies still use conventional forecasting tools for short- and medium-range forecasts, accurate forecasting with these conventional methods beyond a seven-day window has remained challenging. Companies have started to reap the benefit of doing Big Data analysis to identify trends and probabilities from patterns within massive volumes of data, as powerful new techniques for risk reduction and decision making.
Insurance companies use weather forecasting data to optimize their insurance products. They can charge a higher premium for products offered in regions more prone to natural calamity than other regions.