Christian Antognini
Foreword by Cary Millsap, chief executive of Method R Corporation,
and Jonathan Lewis, author of
Cost Based Oracle: Fundamentals
Troubleshooting
Oracle
Performance
Methodically identify and solve performance problems
involving the Oracle database engine
Covers
Oracle Database
9
i
R2
through
11
g
R1
Troubleshooting
Oracle Performance
■ ■ ■
Copyright © 2008 by Christian Antognini
All rights reserved. No part of this work may be reproduced or transmitted in any form or by any means, electronic or mechanical, including photocopying, recording, or by any information storage or retrieval system, without the prior written permission of the copyright owner and the publisher.
ISBN-13: 978-1-59059-917-4 ISBN-10: 1-59059-917-9
ISBN-13 (electronic): 978-1-4302-0498-5
Printed and bound in the United States of America 9 8 7 6 5 4 3 2 1
Trademarked names may appear in this book. Rather than use a trademark symbol with every occurrence of a trademarked name, we use the names only in an editorial fashion and to the benefit of the trademark owner, with no intention of infringement of the trademark.
Lead Editor: Jonathan Gennick Developmental Editor: Curtis Gautschi
Technical Reviewers: Alberto Dell’Era, Francesco Renne, Jože Senegacnik, Urs Meier Editorial Board: Clay Andres, Steve Anglin, Ewan Buckingham, Tony Campbell, Gary Cornell,
Jonathan Gennick, Matthew Moodie, Joseph Ottinger, Jeffrey Pepper, Frank Pohlmann, Ben Renow-Clarke, Dominic Shakeshaft, Matt Wade, Tom Welsh
Project Manager: Sofia Marchant Copy Editor: Kim Wimpsett
Associate Production Director: Kari Brooks-Copony Production Editor: Laura Esterman
Compositor: Susan Glinert Stevens Proofreader: Lisa Hamilton Indexer: Brenda Miller Artist: April Milne
Cover Designer: Kurt Krames
Manufacturing Director: Tom Debolski
Distributed to the book trade worldwide by Springer-Verlag New York, Inc., 233 Spring Street, 6th Floor, New York, NY 10013. Phone 1-800-SPRINGER, fax 201-348-4505, e-mail [email protected], or visit http://www.springeronline.com.
For information on translations, please contact Apress directly at 2855 Telegraph Avenue, Suite 600, Berkeley, CA 94705. Phone 510-549-5930, fax 510-549-5939, e-mail [email protected], or visit http:// www.apress.com.
Apress and friends of ED books may be purchased in bulk for academic, corporate, or promotional use. eBook versions and licenses are also available for most titles. For more information, reference our Special Bulk Sales–eBook Licensing web page at http://www.apress.com/info/bulksales.
sü con mí perché a gó metú tròpp témp par scrival . . .
iv
Contents at a Glance
Forewords
. . . xvAbout the Author
. . . xixAbout the Technical Reviewers
. . . xxiAcknowledgments
. . . xxiiiIntroduction
. . . xxvAbout the OakTable Network . . . . . .xxvii
PART 1
■ ■ ■
Foundations
■
CHAPTER 1
Performance Problems
. . . 3■
CHAPTER 2
Key Concepts
. . . 13PART 2
■ ■ ■
Identification
■
CHAPTER 3
Identifying Performance Problems
. . . 35PART 3
■ ■ ■
Query Optimizer
■
CHAPTER 4
System and Object Statistics
. . . 109■
CHAPTER 5
Configuring the Query Optimizer
. . . 169■
CHAPTER 6
Execution Plans
. . . 195■
CHAPTER 7
SQL Tuning Techniques
. . . 247PART 4
■ ■ ■
Optimization
■
CHAPTER 8
Parsing
. . . 309■
CHAPTER 9
Optimizing Data Access
. . . 339■
CHAPTER 10
Optimizing Joins
. . . 409■
CHAPTER 11
Beyond Data Access and Join Optimization
. . . 459v
■
APPENDIX A
Downloadable Files
. . . 551■
APPENDIX B
Bibliography
. . . 563vii
Forewords
. . . xvAbout the Author
. . . xixAbout the Technical Reviewers
. . . xxiAcknowledgments
. . . xxiiiIntroduction
. . . xxvAbout the OakTable Network . . . . . .xxvii
PART 1
■ ■ ■
Foundations
■
CHAPTER 1
Performance Problems
. . . 3Do You Need to Plan Performance?
. . . 3Requirements Analysis
. . . 4Analysis and Design
. . . 6Coding and Unit Testing
. . . 6Integration and Acceptance Testing
. . . 7Do You Have Performance Problems?
. . . 8System Monitoring
. . . 8Response-Time Monitoring
. . . 9Compulsive Tuning Disorder
. . . 9How Do You Approach Performance Problems?
. . . 10Business Perspective vs. System Perspective
. . . 10Cataloging the Problems
. . . 11Working the Problems
. . . 11On to Chapter 2
. . . 12■
CHAPTER 2
Key Concepts
. . . 13Selectivity and Cardinality
. . . 13Life Cycle of a Cursor
. . . 15How Parsing Works
. . . 18Shareable Cursors
. . . 20Bind Variables
. . . 22Reading and Writing Blocks
. . . 30PART 2
■ ■ ■
Identification
■
CHAPTER 3
Identifying Performance Problems
. . . 35Divide and Conquer
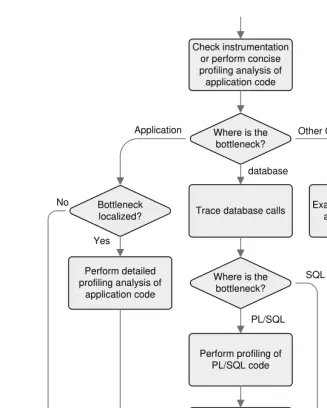
. . . 35Analysis Road Map
. . . 37Instrumentation vs. Profiling Analysis
. . . 40Instrumentation
. . . 41Application Code
. . . 42Database Calls
. . . 44Profiling Application Code
. . . 48Concise Profiling
. . . 48Detailed Profiling
. . . 55Tracing Database Calls
. . . 59SQL Trace
. . . 59Structure of the Trace Files
. . . 73Using TRCSESS
. . . 76Profilers
. . . 77Using TKPROF
. . . 78Using TVD$XTAT
. . . 90Profiling PL/SQL Code
. . . 100Installing the Profiler
. . . 101Installing the Output Tables
. . . 101Gathering the Profiling Data
. . . 102Reporting the Profiling Data
. . . 103The GUI Way
. . . 105On to Chapter 4
. . . 106PART 3
■ ■ ■
Query Optimizer
■
CHAPTER 4
System and Object Statistics
. . . 109Overview of the Package dbms_stats
. . . 109System Statistics
. . . 111Data Dictionary
. . . 112Noworkload Statistics
. . . 113Workload Statistics
. . . 113Object Statistics
. . . 119What Object Statistics Are Available?
. . . 120Gathering Object Statistics
. . . 136Locking Object Statistics
. . . 155Comparing Object Statistics
. . . 158Deleting Object Statistics
. . . 161Strategies for Keeping Object Statistics Up-to-Date
. . . 162Common Services
. . . 164Statistics History
. . . 164Creating and Dropping a Backup Table
. . . 166Exporting, Importing, Getting, and Setting Operations
. . . 166Logging
. . . 167On to Chapter 5
. . . 167■
CHAPTER 5
Configuring the Query Optimizer
. . . 169To Configure or Not to Configure . . .
. . . 170Configuration Road Map
. . . 170Set the Right Parameter!
. . . 172Query Optimizer Parameters
. . . 173PGA Management
. . . 189On to Chapter 6
. . . 193■
CHAPTER 6
Execution Plans
. . . 195Obtaining Execution Plans
. . . 195SQL Statement EXPLAIN PLAN
. . . 195Dynamic Performance Views
. . . 199Automatic Workload Repository and Statspack
. . . 203Tracing Facilities
. . . 205Package dbms_xplan
. . . 208Interpreting Execution Plans
. . . 221Parent-Child Relationship
. . . 221Types of Operations
. . . 223Stand-Alone Operations
. . . 223Unrelated-Combine Operations
. . . 226Related-Combine Operations
. . . 227Divide and Conquer
. . . 236Recognizing Inefficient Execution Plans
. . . 241Wrong Estimations
. . . 241Restriction Not Recognized
. . . 243On to Chapter 7
. . . 245■
CHAPTER 7
SQL Tuning Techniques
. . . 247Altering the Access Structures
. . . 248How It Works
. . . 248When to Use It
. . . 249Pitfalls and Fallacies
. . . 249Altering the SQL Statement
. . . 250How It Works
. . . 250When to Use It
. . . 251Pitfalls and Fallacies
. . . 251Hints
. . . 252How It Works
. . . 252When to Use It
. . . 259Pitfalls and Fallacies
. . . 259Altering the Execution Environment
. . . 261How It Works
. . . 261When to Use It
. . . 264Pitfalls and Fallacies
. . . 264SQL Profiles
. . . 265How It Works
. . . 265When to Use It
. . . 278Pitfalls and Fallacies
. . . 279Stored Outlines
. . . 280How It Works
. . . 280When to Use It
. . . 289Pitfalls and Fallacies
. . . 289SQL Plan Baselines
. . . 291How It Works
. . . 291When to Use It
. . . 304Pitfalls and Fallacies
. . . 304PART 4
■ ■ ■
Optimization
■
CHAPTER 8
Parsing
. . . 309Identifying Parsing Problems
. . . 309Quick Parses
. . . 310Long Parses
. . . 314Solving Parsing Problems
. . . 317Quick Parses
. . . 317Long Parses
. . . 324Working Around Parsing Problems
. . . 324Cursor Sharing
. . . 325Server-Side Statement Caching
. . . 326Using Application Programming Interfaces
. . . 328PL/SQL
. . . 329OCI
. . . 333JDBC
. . . 334ODP.NET
. . . 336On to Chapter 9
. . . 338■
CHAPTER 9
Optimizing Data Access
. . . 339Identifying Suboptimal Access Paths
. . . 339Identification
. . . 340Pitfalls
. . . 342Causes
. . . 345Solutions
. . . 345SQL Statements with Weak Selectivity
. . . 350Full Table Scans
. . . 350Full Partition Scans
. . . 352Range Partitioning
. . . 352Hash and List Partitioning
. . . 364Composite Partitioning
. . . 365Design Considerations
. . . 367Full Index Scans
. . . 369SQL Statements with Strong Selectivity
. . . 372Rowid Access
. . . 372Index Access
. . . 374Single-table Hash Cluster Access
. . . 407■
CHAPTER 10
Optimizing Joins
. . . 409Definitions
. . . 409Join Trees
. . . 409Types of Joins
. . . 413Restrictions vs. Join Conditions
. . . 417Nested Loop Joins
. . . 418Concept
. . . 418Two-table Joins
. . . 418Four-table Joins
. . . 420Block Prefetching
. . . 422Alternate Execution Plans
. . . 422Merge Joins
. . . 424Concept
. . . 424Two-table Joins
. . . 425Four-table Joins
. . . 427Work Areas
. . . 428Hash Joins
. . . 434Concept
. . . 434Two-table Joins
. . . 435Four-table Joins
. . . 436Work Areas
. . . 438Index Joins
. . . 439Outer Joins
. . . 439Choosing the Join Method
. . . 441First-rows Optimization
. . . 441All-rows Optimization
. . . 441Supported Join Methods
. . . 441Parallel Joins
. . . 442Partition-wise Joins
. . . 442Full Partition-wise Joins
. . . 443Partial Partition-wise Joins
. . . 446Transformations
. . . 447Join Elimination
. . . 447Outer Join to Inner Join
. . . 448Subquery Unnesting
. . . 449Star Transformation
. . . 451■
CHAPTER 11
Beyond Data Access and Join Optimization
. . . 459Materialized View
. . . 459How It Works
. . . 460When to Use It
. . . 480Pitfalls and Fallacies
. . . 481Result Caching
. . . 481How It Works
. . . 482When to Use It
. . . 488Pitfalls and Fallacies
. . . 489Parallel Processing
. . . 489How It Works
. . . 489When to Use It
. . . 509Pitfalls and Fallacies
. . . 509Direct-Path Insert
. . . 513How It Works
. . . 513When to Use It
. . . 516Pitfalls and Fallacies
. . . 516Row Prefetching
. . . 517How It Works
. . . 517When to Use It
. . . 521Pitfalls and Fallacies
. . . 521Array Interface
. . . 522How It Works
. . . 522When to Use It
. . . 525Pitfalls and Fallacies
. . . 525On to Chapter 12
. . . 525■
CHAPTER 12
Optimizing the Physical Design
. . . 527Optimal Column Order
. . . 527Optimal Datatype
. . . 529Pitfalls in Datatype Selection
. . . 529Best Practices in Datatype Selection
. . . 533Row Migration and Row Chaining
. . . 535Migration vs. Chaining
. . . 535Problem Description
. . . 537Problem Identification
. . . 537Block Contention
. . . 539Problem Description
. . . 539Problem Identification
. . . 540Solutions
. . . 543Data Compression
. . . 546PART 5
■ ■ ■
Appendixes
■
APPENDIX A
Downloadable Files
. . . 551■
APPENDIX B
Bibliography
. . . 563xv
I
think the best thing that has happened to Oracle performance in the past ten years is the radical improvement in the quality of the information you can buy now at the bookstore.In the old days, the books you bought about Oracle performance all looked pretty much the same. They insinuated that your Oracle system inevitably suffered from too much I/O (which is, in fact, not inevitable) or not enough memory (which they claimed was the same thing as too much I/O, which also isn’t true). They’d show you loads and loads of SQL scripts that you might run, and they’d tell you to tune your SQL. And that, they said, would fix everything.
It was an age of darkness.
Chris’s book is a member of the family tree that has brought to usus . . . light. The difference between the darkness and the light boils down to one simple concept. It’s a concept that your mathematics teachers made you execute from the time when you were about ten years old:
show your work.
I don’t mean show-and-tell, where someone claims he has improved performance at hundreds of customer sites by hundreds of percentage points so therefore he’s an expert. I mean
show your work, which means documenting a relevant baseline measurement, conducting a controlled experiment, documenting a second relevant measurement, and then showing your results openly and transparently so that your reader can follow along and even reproduce your test if he wants.
That’s a big deal. When authors started doing that, Oracle audiences started getting a lot smarter. Since the year 2000, there has been a dramatic increase in the number of people in the Oracle community who ask intelligent questions and demand intelligent answers about perfor-mance. And there’s been an acceleration in the drowning-out of some really bad ideas that lots of people used to believe.
In this book, Chris follows the pattern that works. He tells you useful things. But he doesn’t stop there. He shows you how he knows, which is to say he shows you how you can find out for yourself. He shows his work.
That brings you two big benefits. First, showing his work helps you understand more deeply what he’s showing you, which makes his lessons easier for you to remember and apply. Second, by understanding his examples, you can understand not just the things that Chris is showing you, but you’ll also be able to answer additional good questions that Chris hasn’t covered . . . like what will happen in the next release of Oracle after this book has gone to print.
Chris is a smart, energetic guy who stands on the shoulders of Dave Ensor, Lex de Haan, Anjo Kolk, Steve Adams, Jonathan Lewis, Tom Kyte, and a handful of other people I regard as heroes for bringing rigor to our field. Now we have Chris’s shoulders to stand on as well.
Cary Millsap
Cary Millsap is chief executive of Method R Corporation, a software performance company. He wrote Optimizing Oracle Performance with Jeff Holt in 2003, which earned Cary and Jeff the Oracle Magazine 2004 Author of the Year award. You can find Cary at http://method-r.com or http://carymillsap.blogspot.com.
I started using the Oracle RDBMS a little more than 20 years ago, and it took about three years for me to discover that troubleshooting and tuning had acquired a reputation verging on the mystical.
One of the developers had passed a query to the DBA group because it wasn’t performing well. I checked the execution plan, checked the data patterns, and pointed out that most of the work could be eliminated by adding an index to one of the tables. The developer’s response was “But it doesn’t need an index; it’s a small table.” (This was in the days of 6.0.36, by the way, when the definition of a “short” table was “no more than four blocks long.”) So I created the index anyway, and the query ran about 30 times faster—and then I had a lot of explaining to do.
Troubleshooting does not depend on magic, mystique, or myth; it depends on understanding, observation, and interpretation. As Richard Feynmann once said, “It doesn’t matter how beau-tiful your theory is; it doesn’t matter how smart you are. If your theory doesn’t agree with experiment, it’s wrong.” There are many “theories” of Oracle performance that are wrong and should have been deleted from the collective memory many years ago—and Christian Antognini is one of the people helping to wipe them out.
In this book, Christian Antognini sets out to describe how things really work, what type of symptoms you should be watching out for, and what those symptoms mean. Above all, he encourages you to be methodical and stick to the relevant details in your observation and anal-ysis. Armed with this advice, you should be able to recognize the real issues when performance problems appear and deal with them in the most appropriate way.
Although this is a book that should probably be read carefully from cover to cover, I think different readers will benefit from it in different ways. Some may pick out the occasional special insight whilst browsing, as I did in Chapter 4 with the explanation of height-balanced histograms— after years of trying to find an intuitively clear reason for the name, Christian’s description suddenly made it blatantly obvious.
Other readers may find that they have a section of the book that they read time and again because it covers so many details of some particularly important, and relevant, feature that they are using. I’m sure that the extensive discussion of partitioning in Chapter 9 is something that many people will return to again and again.
There’s a lot in this book—and it’s all worth reading. Thank you, Christian.
Jonathan Lewis
xix
Since 1995, CHRISTIAN ANTOGNINI has focused on understanding how the Oracle database engine works. His main interests include logical and physical database design, the integration of databases with Java appli-cations, the query optimizer, and basically everything else related to application performance management and optimization. He is currently working as a principal consultant and trainer at Trivadis (http:// www.trivadis.com) in Zürich, Switzerland.
If Christian is not helping one of his customers get the most out of Oracle, he is somewhere lecturing on application performance manage-ment or new Oracle Database features for developers. In addition to classes and seminars organized by Trivadis, he regularly presents at conferences and user-group meetings. He is a proud member of the Trivadis Performance Team and of the OakTable Network (http://www.oaktable.net).
xxi
Reviewers
■ALBERTO DELL’ERA has spent his entire professional life working in the Italian telecommunications sector since 1996, specializing in Oracle full-time since 1999. He currently works for Etnoteam S.p.A. (a Value Team S.p.A. company, a consultancy of 2600+ employees), where he is mainly responsible for all Oracle-related developments for the flagship customer web portal of one of the largest Italian mobile operators. He is a member of the OakTable Network (http://www.oaktable.net), the well-known organization of Oracle professionals, distinguished by its use of the scientific method (and ethics of the scientific community) for all its activities. He holds a degree in electronics engineering and can be contacted at [email protected].
■FRANCESCO RENNE was born in 1962 in Como, Italy. He studied computer sciences at the University of Milan, and after graduating, he joined Olivetti, working on the development of the Unix operating system. Francesco has been interested in performance since the beginning of his professional career and has worked on Unix internals and Oracle environments in order to achieve the best possible performance in different environments (new products, benchmarks, international real applications on production, and so on).
In 1994, he joined the Banca Popolare di Bergamo, the only bank in Italy that has rewritten its entire information system using Unix and Oracle. He has made major contributions to improve performance over the whole platform.
In 1999, he co-founded ICTeam and is now the company’s CEO. He continues to work on performance, especially on Oracle data warehouse environments, for some of the largest companies in Italy.
■JOŽE SENEGACNIK has 20 years experience in working with Oracle products. In 1988, he started working with Oracle version 4. Since 1992, he has been self-employed as a private researcher in the field of computer science. Most of his work time is dedicated to solving performance bottle-necks in different application solutions based on the Oracle Database. He is also an international speaker giving talks on the most important Oracle Database–related events worldwide. He conducts well-known performance tuning courses together with Oracle University.
■URS MEIER works as an IT consultant and is cofounder of Trivadis, a European IT solution company. He has used Oracle over the past 20 years. During this time, query optimization became one of his favorite topics, since good SQL tuning was often mission-critical for his customers. IT architecture, application design, and agile design principles are his other main interests.
xxiii
M
any people assisted me in writing the book you now have in your hands. I’m extremely grateful to all of them. Without their assistance, this piece of work wouldn’t have seen the light of the day. While sharing with you the brief history of TOP (Troubleshooting Oracle Performance), let me thank the people who made it all possible.Even though I didn’t realize it at the time, this story began on July 16, 2004, the day of the kickoff meeting I had organized for a new seminar, Oracle Optimization Solutions, which I had planned to write with some colleagues of mine at Trivadis. During the meeting, we discussed the objectives and the structure of the seminar. Many of the ideas developed that day and while writing the seminar in the following months have been reused in this book. Big thanks to Arturo Guadagnin, Dominique Duay, and Peter Welker for their collaboration back then. Together, we wrote what, I’m convinced to this day, was an excellent seminar. In addition to them, I also have to thank Guido Schmutz. He participated in the kickoff meeting only but strongly influenced the way we approached the subjects covered in the seminar.
Two years later, in the spring of 2006, I started thinking seriously about writing this book. I decided to contact Jonathan Gennick at Apress to ask for his opinion about what I had in mind. From the beginning, he was interested in my proposal, and as a result, a few months later I decided to write the book for Apress. Thank you, Jonathan, for supporting me from the very beginning. In addition, thanks to all the people at Apress who worked on the book. I only had the pleasure of working with Sofia Marchant, Kim Wimpsett, and Laura Esterman, but I know that several others contributed to it as well.
Having an idea and a publisher are not enough to write a book. You also need time, a lot of time. Fortunately, the company I work for, Trivadis, was able to support me and the project in this way. Special thanks to Urban Lankes and Valentin De Martin.
In order to write a book, it is also essential to be surrounded by people who carefully check what you are writing. Great thanks go to the technical reviewers: Alberto Dell’Era, Francesco Renne, Jože Senegacnik, and Urs Meier. They helped me considerably in improving the quality of the book. Any remaining errors are, of course, my own responsibility. In addition to the technical reviewers, I would also like to thank Daniel Rey, Peter Welker, Philipp von dem Bussche-Hünnefeld, and Rainer Hartwig for reading part of the book and providing me with their comments on and impressions of the text.
Special thanks also go to Cary Millsap and Jonathan Lewis for writing the forewords. I know that you spent a considerable amount of your valuable time writing them. I’m very much indebted to you both for that.
Another special thank goes to Grady Booch for giving me the permission to reproduce the cartoon in Chapter 1.
xxv
T
he Oracle database engine has become a huge piece of software. This not only means that a single human can no longer be proficient in using all the features provided in recent versions, but it also means that some of them will rarely be used. Actually, in most situations, it is enough to know and take advantage of a limited number of core features in order to use the Oracle data-base engine efficiently and successfully. This is precisely why in this book I will cover only the features that, based on my experience, are necessary to troubleshoot most of the database-related performance problems you will encounter.Structure of This Book
This book is divided into five parts:Part 1 covers some basics that are required to read the rest of the book. Chapter 1, “Perfor-mance Problems,” explains not only why it is essential to approach perfor“Perfor-mance problems at the right moment and in a methodological way but also why understanding business needs and problems is essential. Chapter 2, “Key Concepts,” describes the operations carried out by the database engine when parsing and executing SQL statements. It also introduces some terms that are frequently used in the book.
Part 2 explains how to approach performance problems in an environment that is based on the Oracle database engine. Chapter 3, “Identifying Performance Problems,” provides a detailed analysis road map for identifying performance problems. Several tools and tech-niques that can be used with it are also described.
Part 3 describes the component that is responsible for turning SQL statements into execu-tion plans: the query optimizer. Chapter 4, “System and Object Statistics,” describes what system statistics and object statistics are, how to gather them, and why they are important for the query optimizer. Chapter 5, “Configuring the Query Optimizer,” covers a configuration road map that you can use to find a good configuration for the query optimizer. Chapter 6, “Execution Plans,” describes in detail how to obtain, interpret, and judge the efficiency of execution plans. Chapter 7, “SQL Tuning Techniques,” discusses the SQL tuning tech-niques that are available with the Oracle database engine.
Part 5 provides a list of the files used through the book as examples. In addition, a bibliog-raphy, containing the sources I used while writing the book, is also provided.
Intended Audience
This book is intended for performance analysts, application developers, and database admin-istrators who are involved in troubleshooting performance problems of applications based on the Oracle database engine.
No specific knowledge in optimization is required. However, readers are expected to have a working knowledge of the Oracle database engine and to be proficient with SQL. Some sections of the book cover features that are specific to programming languages such as PL/SQL, Java, C#, and C. These features are covered only to provide a wide range of application developers with specific information about the programming language they are using. You can pick out the ones you are using or interested in and skip the others.
Which Versions Are Covered?
The most important concepts covered in this book are independent of the Oracle database engine version you are using. It is inevitable, however, that when details about the implemen-tation or provided features are discussed, that some information is version specific. This book explicitly discusses the versions currently available from Oracle9i Release 2 to Oracle Database 11g
Release 1. They are as follows:
• Oracle9i Release 2, up to version 9.2.0.8
• Oracle Database 10g Release 1, up to version 10.1.0.5 • Oracle Database 10g Release 2, up to version 10.2.0.4 • Oracle Database 11g Release 1, version 11.1.0.6
If the text doesn’t explicitly mention that a feature is available for a specific version only, this means that it is available for all these versions.
Online Resources
xxvii
I
n and by itself, the OakTable network is just a bunch of people who like to talk to and be in contact with like-minded people—that is, people with a scientific approach (and inquiring mind) regarding Oracle’s database technology.It all started sometime in 1998 when a group of Oracle experts, including Anjo Kolk, Cary Millsap, James Morle, and a few others, started meeting once or twice a year, on various pretexts. Each would bring a bottle of Scotch or Bourbon and in return earn the right to sleep on the floor somewhere in my house.
We spent most of our time sitting around my dining table, with computers, cabling, paper, and other stuff all over the place, discussing Oracle, relaying anecdotes, and experimenting with new and better ways of working with the database. By the spring of 2002, the whole thing had grown. One evening, I realized that I had 16 world-renowned Oracle scientists sitting around my dining table. We were sleeping three or four to a room and even had to borrow the neighbor’s shower in the mornings. Anjo Kolk suggested we call ourselves the “OakTable network” (after my dining table), and about two minutes later, http://www.OakTable.net was registered.
James Morle now maintains the website along with his wife Elain, and although it doesn’t get updated with new content perhaps as often as it should, it is useful at least for providing the links, names, and such. We also use it for the Challenge questions and answers.
The Challenge is something we occasionally run during conferences. Ask us anything (technical) about Oracle, and if we can’t find the answer (whether it be yes, no, or a solution) within 24 hours, the person who asked the question gets a T-shirt stating that he or she beat the OakTable.
The Challenge, though, is not used as much as we’d like, probably because it looks as if we want to be challenged with questions to which we cannot find answers. The opposite is actually true—the purpose is to answer questions from anybody, regardless of how “simple” or “easy” they might seem.
The Members
I recently read the book Operation Certain Death, about an operation in Sierre Leone by the British Special Forces. I want to make perfectly clear that in no way can the physical abilities of the OakTable members be compared to those of the Special Forces. In fact, not at all.
So, imagine bringing a bunch of people with that attitude (and a tremendous respect for each other) together for even just a few days. It’s never boring, and you very rarely see them waiting on an idle wait event, as we put it.
Imagine standing on the cold, gray cement in the exhibition hall at OracleWorld in Copenhagen, realizing that we hadn’t paid for carpeting or anything, just 6-by-6 meters of cement floor. Well, it turned out the Intel guys had spare super-quality AstroTurf carpet but needed beer. It was Gary Goodman who brokered that deal within half an hour.
Then Johannes Djernes saw the BMC guys bringing all their advanced exhibition stuff in, placed in two crates that each measured 2.5-by-1-by-1 meters. Two cases of beers later we had borrowed the empty crates. Then Johannes went out and bought various bits and pieces, and within a few hours we had the tallest tower (5 meters high) in the whole exhibition area. It was possibly also the ugliest, but people noticed it.
During the same event, James Morle fought like a lion to establish the World’s Biggest Laptop RAC Cluster, using a NetApp filer, a Linux boot CD, and the laptops of anybody who happened to pass by. It was a huge success, but without the “never give up” attitude of James and of others like Michael Möller and Morten Egan, it would never have happened.
A committee, consisting of James Morle, Cary Millsap, Anjo Kolk, Steve Adams, Jonathan Lewis, and myself, review suggestions for new OakTable members. The number of members now exceeds 70, and I have no doubt we will continue to add members with the inquiring, scientific, “never give up” attitude that is the hallmark of this extraordinary group of humans.
The Politics
How often have you heard the phrase “Oracle says that . . .” or “Oracle Support promised . . .”? Well, most of the time it isn’t Oracle as a corporation that “says” something but an individual who has an opinion or an idea. I know, because I spent ten years working for Oracle Support, and it is indeed a strange feeling to hear one’s own words later repeated as the words of Oracle Corporation (or at least of Oracle Denmark).
It is the same with the OakTable. We don’t act as a single body but as individuals. Some (technical) views might be shared, but that’s just lucky coincidence. There are no guidelines regarding the individual member’s conduct or attitude, except that ideas should be shared and guessing should be eliminated by constantly testing and pushing boundaries.
Sharing ideas openly between peers and striving for scientific methods is what the OakTable network is all about. On those aims there can and will be no compromise.
The Books
One day in Kenilworth, United Kingdom, during an Oracle SIG meeting, James Morle came up with the idea of the BAARF Party (Battle Against Any RAID Five/Four/and err . . . Free) while having a Larson cognac. That same evening we had dinner with Tony Davis from Apress, and that’s when James came up with this idea of a press label called OakTable Press. Tony thought that was a splendid idea, and a few days later it was a reality.
Along with the book you have in your hands now, the current catalog consists of the following:
Expert Oracle JDBC Programming: Oracle and Java expert R.M. Menonshows how to build scalable and highly performing Java applications that access Oracle through JDBC. Rather than take a database-agnostic approach, Menon shows you how to write JDBC code specific to Oracle, and to write it well, ensuring that you can take advantage of all the richness that the Oracle Database platform has to offer.
Mastering Oracle PL/SQL: Practical Solutions: Connor McDonald et al. show you how to write PL/SQL code that will run quickly and won’t break in high load, multiuser environments.
Oracle Insights: Tales of the Oak Table: A bunch of OakTable members (including me) present a series of stories about our experiences (good and bad) using the Oracle software: where it’s been, where it’s going, how (and how not) to use it successfully, and some fright-ening tales of what can happen when fundamental design principals are ignored.
Peoplesoft for the Oracle DBA: David Kurtz provides a “survival guide” for any Oracle DBA charged with maintaining a PeopleSoft application. The book shows you how to effectively implement common Oracle database administration techniques using the PeopleSoft toolset, how to analyze application activity, and how to obtain the critical data that will allow you to track down the causes of poor performance.
We hope that every book published by OakTable Press will be imbued by the qualities that we admire: they will be scientific, rigorous, accurate, innovative, and fun to read. Ultimately, we hope that each book is as useful a tool as it can possibly be in helping make your life easier.
■ ■ ■
Foundations
Chi non fa e’ fondamenti prima, gli potrebbe con una grande virtú farli poi, ancora che
si faccino con disagio dello architettore e periculo dello edifizio.
He who has not first laid his foundations may be able with great ability to lay them
afterwards, but they will be laid with trouble to the architect and danger to the building.
1—Niccoló Machiavelli,
Il principe
. 1532.
3
■ ■ ■
Performance Problems
T
oo often, tuning begins when an application’s development is already finished. This is unfortu-nate because it implies that performance is not as important as other crucial requirements of the application. Performance is not merely optional, though; it is a key property of an applica-tion. Not only does poor performance jeopardize the acceptance of an application, it usually leads to a lower return on investment because of lower productivity. In fact, as shown in several IBM studies from the early 1980s, there is a close relationship between performance and user productivity. The studies showed a one-to-one decrease in user think time and error rates as system transaction rates increased. This was attributed to a user’s loss of attention because of longer wait times. In addition, poorly performing applications lead to higher costs for software, hardware, and maintenance. For these reasons, this chapter discusses why it is important to plan performance and how to know when an application is experiencing performance problems. Then the chapter covers how to approach performance problems on a running system.Do You Need to Plan Performance?
In software engineering, different models are used to manage development projects. Whether the model used is a sequential life cycle like a waterfall model or an iterative life cycle like Rational Unified Process, an application goes through a number of common phases (see Figure 1-1). These phases may occur once (in the waterfall model) or several times (in the iterative model) in development projects.
Figure 1-1. Essential phases in application development
If you think carefully about the tasks to carry out for each of these phases, you may notice that performance is inherent to each of them. In spite of this, real development teams quite often forget about performance, at least until performance problems arise. At this point, it may be too late. Therefore, in the following sections, I’ll cover what you should not forget, from a performance point of view, the next time you are developing an application.
Requirements Analysis
Analysis and Design
Coding and Unit Testing
Integration and Acceptance
Requirements Analysis
Simply put, a requirements analysis defines the aim of an application and therefore what it is expected to achieve. To do a requirements analysis, it is quite common to interview several stakeholders. This is necessary because it is unlikely that only one person can define all the business and technical requirements. Since requirements come from several sources, they must be carefully analyzed, especially to find out whether they potentially conflict. It is crucial when performing a requirements analysis to not only focus on the functionalities the applica-tion has to provide but also to carefully define the utilizaapplica-tion of them. For each specific funcapplica-tion, it is essential to know how many users1 are expected to interact with it, how often they are expected to use it, and what the expected response time is for one usage. In other words, you must define the expected performance figures.
RESPONSE TIME
The time interval between the moment a request enters a system or functional unit and the moment it leaves is called response time. The response time can be further broken down into the time needed by the system to process the request, which is called service time, and the time the request is waiting to be processed, which is called wait time.
response time = service time + wait time
If you consider that a request enters a system when a user performs an action, such as clicking a button, and goes out of the system when the user receives an answer in response to the action, you can call that interval
user response time. In other words, the user response time is the time required to process a request from the user’s perspective.
In some situations, like for web applications, it is not common to consider user response time because it is usually not possible to track the requests before they hit the first component of the application (typically a web server). In addition, most of the time it is not possible to guarantee a user response time because the provider of the application is not responsible for the network between the user’s application, typically a browser, and the first component of the application. In such situations it is more sensible to measure, and guarantee, the interval between the entry of requests into the first component of the system and when they exit. This elapsed time is called system response time.
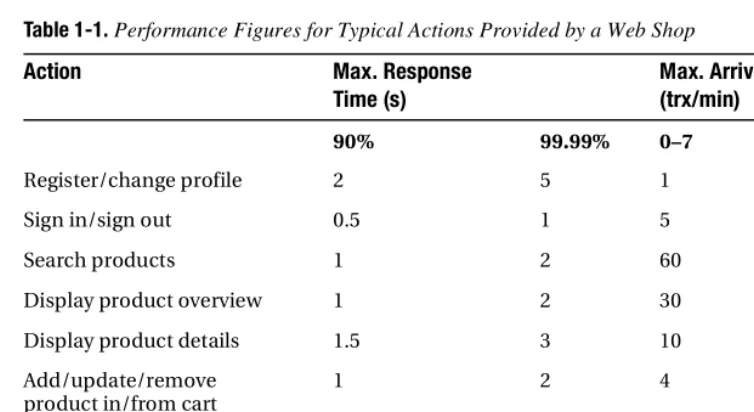
Table 1-1 shows the performance figures for the actions provided by JPetStore.2 For each action, the guaranteed system response times for 90 percent and 99.99 percent of the requests entering the system are given. Most of the time, guaranteeing performance for all requests (in other words, 100 percent) is either not possible or too expensive. It is quite common, therefore, to define that a small number of requests may not achieve the requested response time. Since the workload on the system changes during the day, two values are specified for the maximum
1. Note that a user is not always a human being. For example, if you are defining requirements for a web service, it is likely that only other applications will use it.
arrival rate. In this specific case, the highest transaction rate is expected during the day, but in other situations—for example, when batch jobs are scheduled for nights—it could be different.
These performance requirements are not only essential throughout the next phases of application development (as you will see in the following sections), but later you can also use them as the basis for defining service level agreements and for capacity-planning purposes.
SERVICE LEVEL AGREEMENTS
A service level agreement (SLA) is a contract defining a clear relationship between a service provider and a service consumer. It describes, among others things, the provided service, its level of availability regarding uptime and downtime, the response time, the level of customer support, and what happens if the provider is not able to fulfill the agreement.
Defining service level agreements with regard to response time makes sense only if it is possible to verify their fulfillment. They require the definition of clear and measurable performance figures and their associated targets. These performance figures are commonly called key performance indicators. Ideally a monitoring tool is used to gather, store, and evaluate them. In fact, the idea is not only to flag when a target is not fulfilled but also to keep a log for reporting and capacity-planning purposes. To gather these performance figures, you can use two main techniques. The first takes advantage of the output of instrumentation code (see Chapter 3 for more information). The second one is to use a monitoring tool that checks the application by applying synthetic transactions (see the section “Response-Time Monitoring” later in this chapter).
Table 1-1. Performance Figures for Typical Actions Provided by a Web Shop
Action Max. Response
Time (s)
Max. Arrival Rate (trx/min)
90% 99.99% 0–7 8–23
Register/change profile 2 5 1 2
Sign in/sign out 0.5 1 5 20
Search products 1 2 60 240
Display product overview 1 2 30 120
Display product details 1.5 3 10 36
Add/update/remove product in/from cart
1 2 4 12
Show cart 1 3 8 32
Submit/confirm order 1 2 2 8
Analysis and Design
Based on the requirements, the architects are able to design a solution. At the beginning, for the purpose of defining the architecture, it is essential to consider all requirements. In fact, an application that has to handle a high workload must be designed from the beginning to achieve this requirement. This is especially the case if techniques such as parallelization, distributed computing, or reutilization of results are implemented. For example, designing a client/server application aimed at supporting a few users performing a dozen transactions per minute is quite different from designing a distributed application aimed at supporting thousands of users performing hundreds of transactions per second.
Sometimes requirements also impact the architecture by imposing limits on the utiliza-tion of a specific resource. For example, the architecture of an applicautiliza-tion to be used by mobile devices connected to the server through a very slow network must absolutely be conceived to support a long latency and a low throughput. As a general rule, the architects have to foresee not only where the bottlenecks of a solution might be but also whether these bottlenecks might jeopardize the fulfillment of the requirements. If the architects do not possess enough infor-mation to perform such a critical estiinfor-mation a priori, one or even several prototypes should be developed. In this respect, without the performance figures gathered in the previous phase, it is difficult to make sensible decisions. By sensible decisions, I mean those leading to an archi-tecture/design that supports the expected workload with a minimal investment—simple solutions for simple problems, elegant solutions for complex problems.
Coding and Unit Testing
A developer should write code that has the following characteristics:
Robustness: The ability to cope with unexpected situations is a characteristic any software should have, based on the quality of the code. To achieve this, it is essential to perform unit testing on a regular basis. This is even more important if you choose an iterative life cycle. In fact, the ability to quickly refactor existing code is essential in such models. For example, when a routine is called with a parameter value that is not part of the list of allowed values, it must nevertheless be able to handle it without crashing. If necessary, a meaningful error message should be generated as well.
Clarity: Long-term readable and documented code is much simpler (and cheaper) to maintain than code that is poorly written. For example, a developer who packs several operations in a single line of cryptic code has chosen the wrong way to demonstrate his intelligence.
Speed: Code should be optimized to run as fast as possible, especially if a high workload is expected. For example, you should avoid unnecessary operations as well as inefficient or unsuitable algorithms.
Instrumented: The aim of instrumentation is twofold. First, it allows for the easier analysis of both functional and performance problems when they arise—and they will arise to be sure. Second, it is the right place to add strategic code that will provide information about an application’s performance. For example, it is usually quite simple to add code that provides information about the time taken to perform a specific operation. This is a simple yet effective way to verify whether the application is capable of fulfilling the necessary performance requirements.
Not only do some of these characteristics conflict with each other, but budgets are usually limited (and sometimes are very limited). It seems reasonable then that more often than not it is necessary to prioritize these characteristics and find a good balance between achieving the desired requirements within the available budget.
Integration and Acceptance Testing
The purpose of integration and acceptance testing is to verify functional and performance requirements as well as the stability of an application. It can never be stressed enough that performance tests have the same importance as function tests. For all intents and purposes, an application experiencing poor performance is no worse than an application failing to fulfill its functional requirements. In both situations, the application is useless. Still, it is possible to verify the performance requirements only once they have been clearly defined.
The lack of formal performance requirements leads to two major problems. First, the chances are quite high that no serious and methodical stress tests will be performed during integration and acceptance testing. The application will then go to production without knowing whether it will support the expected workload. Second, it will not always be obvious to determine what is acceptable and what is not in terms of performance. Usually only the extreme cases (in other words, when the performance is very good or very poor) are judged in the same way by different people. And if an agreement is not found, long, bothersome, and unproductive meetings follow.
In practice, designing, implementing, and performing good integration and acceptance testing to validate the performance of an application are not trivial tasks. You have to deal with three major challenges to be successful:
• Stress tests should be designed to generate a representative workload. To do so, two main approaches exist. The first is to get real users to do real work. The second is to use a tool that simulates the users. Both approaches have pros and cons, and their use should be evaluated on a case-by-case basis. In some situations, both can be used to stress different parts of the application or in a complementary way.
• The test infrastructure should be as close as possible, and ideally the same, as the produc-tion infrastructure. This is especially difficult for both highly distributed systems and systems that cooperate with a large number of other systems.
In a sequential life cycle model, the integration and acceptance testing phase occurs close to the end of the project, which might be a problem if a major flaw in the architecture leading to performance problems is detected too late. To avoid such a problem, stress tests should be performed during the coding and unit testing phases as well. Note that an iterative life cycle model does not have this problem. In fact, in an iterative life cycle model, a stress test should be performed for every iteration.
Do You Have Performance Problems?
There is probably a good chance that sooner or later the performance of an application will be questioned. If, as described in the previous sections, you have carefully defined the performance requirements, it should be quite simple to determine whether the application in question is in fact experiencing performance problems. If you have not carefully defined them, the response will largely depend on who answers the question.
Interestingly enough, in practice the most common scenarios leading to questions regarding the performance of an application fall into very few categories. They are short-listed here:
• Users are unsatisfied with the current performance of the application.
• A system-monitoring tool alerts you that a component of the infrastructure is experiencing timeouts or an unusual load.
• A response-time monitoring tool informs you that a service level agreement is not being fulfilled.
The difference between the second point and the third point is particularly important. For this reason, in the next two sections I will briefly describe these monitoring solutions. After that, I will present some situations where tuning appears to be necessary but in fact is not necessary at all.
System Monitoring
with four quad-core CPUs). Whenever you see a utilization of about 75 percent, you may think that it is too high; the system is CPU-bounded. However, this load could be very healthy if the number of running tasks is much greater than the number of CPUs. This is a false positive. Conversely, whenever you see a utilization of about 8 percent of the CPU, you may think that everything is fine. But if the system is running a single task that is not parallelized, it is possible that the bottleneck for this task is the CPU. In fact, 1/16th of 100 percent is only 6.25 percent, and therefore, a single task cannot burn more than 6.25 percent of the available CPU. This is a false negative.
Response-Time Monitoring
Response-time monitoring tools (also known as application-monitoring tools) perform health checks based on synthetic transactions that are processed by robots. The tools measure the time taken by an application to process key transactions, and if the time exceeds an expected threshold value, they raise an alert. In other words, they exploit the infrastructure as users do, and they complain about poor performance as users do. Since they probe the application from a user perspective, they are able to not only check single components but, and more important, check the whole application’s infrastructure as well. For this reason, they are devoted to moni-toring service level agreements.
Compulsive Tuning Disorder
Once upon a time, most database administrators suffered from a disease called compulsive tuning disorder.3 The signs of this illness were the excessive checking of many performance-related statistics, most of them ratio-based, and the inability to focus on what was really impor-tant. They simply thought that by applying some “simple” rules, it was possible to tune their databases. History teaches us that results are not always as good as expected. Why was this the case? Well, all the rules used to check whether a given ratio (or value) was acceptable were defined independently of the user experience. In other words, false negatives or positives were the rule and not the exception. Even worse, an enormous amount of time was spent on these tasks.
For example, from time to time a database administrator will ask me a question like “On one of our databases I noticed that we have a large amount of waits on latch X. What can I do to reduce or, even better, get rid of such waits?” My typical answer is “Do your users complain because they are waiting on this specific latch? Of course not. So, don’t worry about it. Instead, ask them what problems they are facing with the application. Then, by analyzing those prob-lems, you will find out whether the waits on latch X are related to them or not.” I’ll elaborate on this in the next section.
Even though I have never worked as a database administrator, I must admit I suffered from compulsive tuning disorder as well. Today, I have, like most other people, gotten over this disease. Unfortunately, as with any bad illness, it takes a very long time to completely vanish. Some people are simply not aware of being infected. Others are aware, but after many years of addic-tion, it is always difficult to recognize such a big mistake and break the habit.
How Do You Approach Performance Problems?
Simply put, the aim of an application is to provide a benefit to the business using it. Consequently, the reason for optimizing the performance of an application is to maximize that benefit. This does not mean maximizing the performance, but rather finding the best balance between costs and performance. In fact, the effort involved in an optimization task should always be compensated by the benefit you can expect from it. This means that from a business perspective, performance optimization may not always make sense.Business Perspective vs. System Perspective
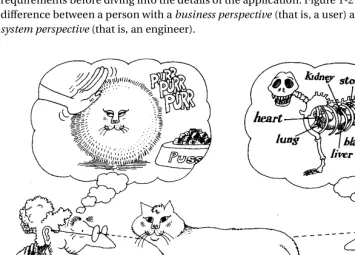
You optimize the performance of an application to provide a benefit to a business, so when approaching performance problems, you have to understand the business problems and requirements before diving into the details of the application. Figure 1-2 illustrates the typical difference between a person with a business perspective (that is, a user) and a person with a
system perspective (that is, an engineer).
Figure 1-2. Different observers may have completely different perspectives.4
It is important to recognize that there is a cause-effect relationship between these two perspectives. Although the effects must be recognized from the business perspective, the causes must be identified from the system perspective. So if you do not want to troubleshoot nonexistent or irrelevant problems (compulsive tuning disorder), it is essential to understand what the problems are from a business perspective—even if more subtle work is required.
Cataloging the Problems
The first steps to take when dealing with performance problems are to identify them from a business perspective and to set a priority and a target for each of them, as illustrated in Figure 1-3.
Figure 1-3. Tasks to carry out while cataloging performance problems
Business problems cannot be found by looking at system statistics. They have to be iden-tified from a business perspective. If a monitoring of service level agreements is in place, the performance problems are obviously identified by looking at the operations not fulfilling expectations. Otherwise, there is no other possibility but to speak with the users or those who are responsible for the application. Such discussions can lead to a list of operations, such as registering a new user, running a report, or loading a bunch of data that is considered slow.
Once you know the problematic operations, it is time to give them a priority. For that, ask questions like “If we can work on only five problems, which should be handled?” Of course, the idea is to solve them all, but sometimes the time or the budget is limited. In addition, it is not possible to leave out cases where the measures needed to fix different problems conflict with each other. It is important to stress that to set priorities, the current performance could be irrele-vant. For example, if you are dealing with a set of reports, it is not always the slowest one that has the highest priority. Possibly the fastest one is also the one that is executed more frequently. It might therefore have the highest priority and should be optimized first. Once more, business requirements are driving you.
For each operation, you should set a quantifiable target for the optimization, such as “When the Create User button is clicked, the processing lasts at most two seconds.” If the performance requirements or even service level agreements are available, it is possible that the targets are already known. Otherwise, once again, you must consider the business requirements to deter-mine the targets. Note that without targets you do not know when it is time to stop investigating for a better solution. In other words, the optimization could be endless. Remember, the effort should always be balanced by the benefit.
Working the Problems
Troubleshooting a whole system is much more complex than troubleshooting single compo-nents. Therefore, whenever possible, you should work one problem at a time. Simply take the list of problems and go through them according to their priority level.
Identify the Problems from a Business
Perspective
Set a Priority for Each Problem
For each problem, the three questions shown in Figure 1-4 must be answered:
Where is time spent? First, you have to identify where time goes. For example, if a specific operation takes ten seconds, you have to find out which module or component most of these ten seconds are used up in.
How is time spent? Once you know where the time goes, you have to find out how that time is spent. For example, you may find out that the application spends 4.2 seconds on CPU, 0.4 seconds doing I/O operations, and 5.1 seconds waiting for dequeuing a message coming from another component.
How can time spent be reduced? Finally, it is time to find out how the operation can be made faster. To do so, it is essential to focus on the most time-consuming part of the processing. For example, if I/O operations take 4 percent of the overall processing time, it makes no sense to start tuning them, even if they are very slow.
Figure 1-4. To troubleshoot a performance problem, you need to answer these three questions.
It is important to note that thanks to beneficial side effects, sometimes measures imple-mented to fix a particular problem will also fix another one. Of course, the opposite can happen as well. Measures taken may introduce new problems. It is essential therefore to carefully consider all the possible side effects that a specific fix may have. Clearly, all changes have to be carefully tested before implementing them in production.
On to Chapter 2
In this chapter, we looked at some key issues of dealing with performance problems: why it is essential to approach performance problems at the right moment and in a methodological way, why understanding business needs and problems is absolutely important, and why it is necessary to agree on what good performance means.
Before describing how to answer the three questions in Figure 1-4, it is essential that I introduce some key concepts that I’ll be using in the rest of the book. For that purpose, Chapter 2 will describe the processing performed by the database engine to execute SQL statements. In addition, I’ll define several frequently used terms.
13
■ ■ ■
Key Concepts
T
he aim of this chapter is twofold. First, to avoid unnecessary confusion, I’ll introduce some terms that are used repeatedly throughout this book. The most important include selectivityand cardinality, soft and hard parses, and bind variable peeking and extended cursor sharing. Second, I’ll describe the life cycle of SQL statements. In other words, I’ll describe the operations carried out in order to execute SQL statements. During this discussion, special attention will be given to parsing.
Selectivity and Cardinality
The selectivity is a value between 0 and 1 representing the fraction of rows filtered by an oper-ation. For example, if an access operation reads 120 rows from a table and after applying a filter returns 18 of them, the selectivity is 0.15 (18/120). The selectivity can also be expressed as a percentage, so 0.15 can also be expressed as 15 percent. The number of rows returned by an operation is the cardinality. Formula 2-1 shows the relationship between selectivity and cardi-nality. In this formula, the value num_rows is the number of processed rows.
cardinality = selectivity . num_rows
Formula 2-1. Relationship between selectivity and cardinality
■
Caution
In some publications, the term cardinality refers to the number of distinct values stored in aparticular column. I never use the term cardinality in this way.
Let’s take a look at a couple of examples based on the script selectivity.sql. In the following query, the selectivity of the operation accessing the table is 1. This is because no WHERE clause is applied, and therefore, the query returns all rows stored in the table (10,000).
SQL> SELECT * FROM t; ...
In the following query, the selectivity of the operation accessing the table is 0.2601 (2,601 rows returned out of 10,000):
SQL> SELECT * FROM t WHERE n1 BETWEEN 6000 AND 7000; ...
2601 rows selected.
In the following query, the selectivity of the operation accessing the table is 0 (0 rows returned out of 10,000):
SQL> SELECT * FROM t WHERE n1 = 19;
no rows selected.
In the previous three examples, the selectivity related to the operation accessing the table is computed by dividing the number of rows returned by the query with the number of rows stored in the table. This is possible because the three queries do not contain operations leading to aggregations. As soon as a query contains a GROUP BY clause or group functions in the SELECT clause, the execution plan contains at least one aggregate operation. The following query illus-trates this (note the presence of the group function sum):
SQL> SELECT sum(n2) FROM t WHERE n1 BETWEEN 6000 AND 7000;
SUM(N2) 70846
1 row selected.
In this type of situation, it is not possible to compute the selectivity of the access operation based on the number of rows returned by the query (in this case 1). Instead, a query like the following should be executed to find out how many rows are processed in order to execute the aggregate operation. Here, the selectivity of the access operation is 0.2601 (2,601/10,000). SQL> SELECT count(*) FROM t WHERE n1 BETWEEN 6000 AND 7000;
COUNT(*) 2601
1 row selected.
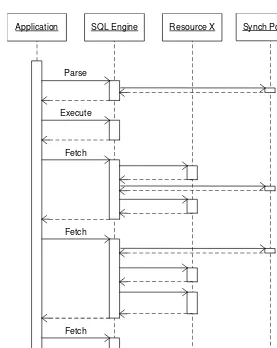
Life Cycle of a Cursor
Having a good understanding of the life cycle of cursors is required knowledge for optimizing applications that execute SQL statements. The following are the steps carried out during the processing of a cursor:
Open cursor: A memory structure for the cursor is allocated in the server-side private memory of the server process associated with the session, the user global area (UGA). Note that no SQL statement is associated with the cursor yet.
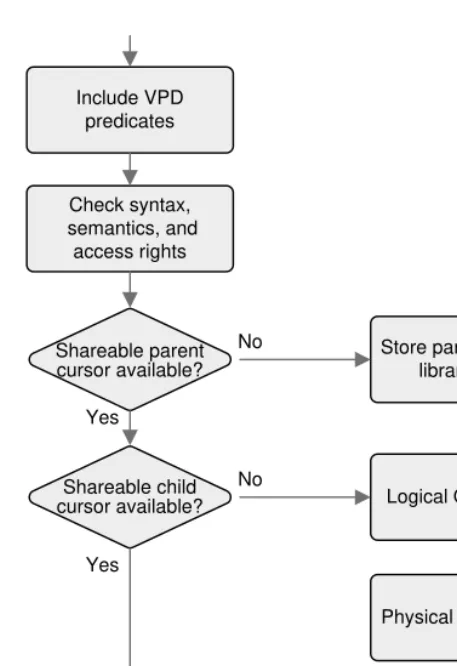
Parse cursor: A SQL statement is associated with the cursor. Its parsed representation that includes the execution plan (which describes how the SQL engine will execute the SQL statement) is loaded in the shared pool, specifically, in the library cache. The structure in the UGA is updated to store a pointer to the location of the shareable cursor in the library cache. The next section will describe parsing in more detail.
Define output variables: If the SQL statement returns data, the variables receiving it must be defined. This is necessary not only for queries but also for DELETE, INSERT, and UPDATE statements that use the RETURNING clause.
Bind input variables: If the SQL statement uses bind variables, their values must be provided. No check is performed during the binding. If invalid data is passed, a runtime error will be raised during the execution.
Execute cursor: The SQL statement is executed. But be careful, because the database engine doesn’t always do anything significant during this phase. In fact, for many types of queries, the real processing is usually delayed to the fetch phase.
Fetch cursor: If the SQL statement returns data, this step retrieves it. Especially for queries, this step is where most of the processing is performed. In the case of queries, rows might be partially fetched. In other words, the cursor might be closed before fetching all the rows.
Close cursor: The resources associated with the cursor in the UGA are freed and conse-quently made available for other cursors. The shareable cursor in the library cache is not removed. It remains there in the hope of being reused in the future.