Journal of Physics: Conference Series
PAPER • OPEN ACCESS
Correlation of seismotectonic parameter and
seismic quiescence z-value in West Sumatra
Indonesia
To cite this article: Syafriani et al 2018 J. Phys.: Conf. Ser.1040 012050
View the article online for updates and enhancements.
Related content
Maturity analysis of the innovation system in the livestock industries of West Sumatra, Indonesia
A Suresti, U G S Dinata and R Wati
-Marked point process for modelling seismic activity (case study in Sumatra and Java)
Hasih Pratiwi, Lia Sulistya Rini and I Wayan Mangku
-Analysis of Seismotektonic Patterns in Sumatra Region Based on the Focal Mechanism of Earthquake Period 1976-2016
F P Indah, S Syafriani and Z S Andiyansyah
1234567890 ‘’“”
International Conference on Mathematics and Natural Sciences (IConMNS 2017) IOP Publishing IOP Conf. Series: Journal of Physics: Conf. Series 1040 (2018) 012050 doi :10.1088/1742-6596/1040/1/012050
Correlation of seismotectonic parameter and seismic
quiescence z-value in West Sumatra Indonesia
Syafriani1, Yulkifli1, A Z Sabarani2 and F D Raharjo2
1Departement of Physics, Faculty of Mathematics and Science, Universitas Negeri
Padang
2Indonesian Meteorology, Climatology and Geophysics Agency
Email: [email protected]
Abstract. West Sumatra is a tectonically active area where there have been several major earthquakes happened. Earthquakes can happen anytime and anyplace, so that need to know some precursor of earthquake before the earthquake occurred, such as local stress condition of region. Interrelationships between of the local stress condition a-value, b-value and z-value for the time period extending from 1981 to 2015 are examined in the West Sumatera region. For this purpose, a distribution relationship with the frequency-magnitude earthquake and temporal changes of this parameters were analyzed in order to reveal the potential of future earthquake in the study region. Beside that, standard deviation value of Z-value was estimated in the beginning of 2015 to identify of current seismicity rate changes. The result showed that the area had low spatial variation of b-value around 0.8. Low b-value indicated that the area had high stress condition and a-value had low spatial variation between 5.5 to 7 with low seismic activity. In contrast, several region had positif z-value that indicated that there were significant decreased in seismic activity. Based on this analysis it appears that these three parameters (a,b,z value) were related to each other. In some part of West Sumatra there were region that decreased earthquake activity and indicated that there was a large accumulation of energy which high local rock stress condition with significant decreased in seismic activity or seismic quiescence. This mean that the potentially devasting earthquake can be happened in West Sumatera.
1.Introduction
The Sumatra region is at a meeting of the Eurasian plate with the Australian plate. The Indo-Australian Plate moves under the silent Eurasian Plate at a rate of 50-70 mm per year [1]. Because of this shift, there is a fault system along the island of Sumatra, which is called Sumatran Fault System. This fault formed segments that stretched along the island of Sumatra.
In West Sumatra, stretches the SFS segment from South Solok to Rao area in Pasaman District. The fault segment is Sumpur, Sianok, Sumani, and Suliti segment. In addition, in the ocean area there is also a fault system called Mentawai Fault System (MFS). The existence of active faults around land and sea, causing West Sumatra is potentially the occurrence of earthquakes.
2
1234567890 ‘’“”
International Conference on Mathematics and Natural Sciences (IConMNS 2017) IOP Publishing IOP Conf. Series: Journal of Physics: Conf. Series 1040 (2018) 012050 doi :10.1088/1742-6596/1040/1/012050
with a strength of 6.4 SR and 6.3 SR. In addition, in the Sianok segment there was also a major earthquake on March 6, 2007 with coordinates at 0.48 ° LS, 100.37 ° East with a depth of 33 km and a magnitude of 6.4 SR [2]. While earthquakes originating from subduction zones occurred in 1779 (8.4 SR), 1883 (9.2 SR), 1861 (8.3 SR), 2007 (7.9 SR), and 2009 (7.6 SR) [3]. There are two significant earthquakes that occur in the ocean of West Sumatra was the earthquake of Pariaman, September 30, 2009 magnitude 7.6 and the earthquake of Pagai, Mentawai that occurred on October 25, 2010. Both earthquakes cause severe damage, loss of property and claimed many lives.
To understand the process of the occurrence of significant and destructive earthquake in West Sumatra required a strong understanding of the precursor shown by seismotectonic and earthquake activity. Seismotectonic parameters were obtained by calculating the b-values and a-values as well as their relation to the phenomena that preceded the significant earthquakes in the region. This parameter describes local tectonic stress conditions and earthquake activity in West Sumatera. While precursors that precede the significant earthquake is called the phenomenon of seismic quiescence is a phenomenon. This phenomenon is characterized by a decrease in seismic activity over a period Characteristics of the seismotectonic parameters can be determined by looking at the spatial distribution of b-values and a-values in the region based on the Frequency-Magnitude Distribution relationship (FMD). The value a represents the seismic activity level of a region, whereas the b-value reflects the tectonic conditions associated with the region's stress conditions. Meanwhile, to observe the seismic quiescence phenomenon can be done using the z-value method. The z-values method measures the difference in the intentness level moving in the time window with the background seismicity using the standard deviation z [4].
The method of z-value has been done before in various places to observe seismic quiescence. Among them, by Katsumata [5] who examined the Precursory Seismic Quiescence Before the Mw = 8.3 Tokachi-Oki, Japan, Earthquake on September 26, 2003 Revealed by a re-examined Earthquake Catalog. The results of his research found that before the Tokachi-oki event there were two adjacent seismic quiescence anomalies. The anomaly appeared in 1999 and lasted for 5 years before the Tokachi-oki 2003 event [5]. In addition, Sunardi [6] also observed changes in earthquake level before Tasikmalaya earthquake, September 2, 2009. Based on observations made by Sunardi [6] obtained spatial distribution of z-value in the period that has been determined. A positive value of z-value indicates a decrease in seismicity. The decrease in seismicity occurred around the mainshock beginning three years before a strong earthquake occurred. The decline in the mean seismicity level of the years leading up to strong earthquake events is suspected to be an earthquake precursor [6].
Based on the spatial distribution of low-a values means low seismic activity and indicates the presence of energy accumulation (asperity) [7], on the contrary for high-a values. Whereas spatial high-b values are associated with low rock stress conditions [8] [9]. High b-values have high heterogeneity medium conditions, but low-b values correlate with high stress rock conditions and have low heterogeneity medium [10]. A region with high stress rock conditions has a b-value of 0.4-0.9, while under low stress conditions the b-value is about 1.2 [11].
This study focuses on an understanding of the relationship of seismotectonic parameters to the seismic quiescence phenomenon based on their spatial distribution. It aims to information the potential of seismicity and its relationship with earthquake disaster mitigation.
2.Methods
The relationship of the frequency distribution and earthquake magnitude is a linier equation that is influenced by the constanta of seismotectonic parameter. The relationship of the frequency-magnitude distributions satisfies in the following equation [12]:
Log N (M) = a – b M (1)
1234567890 ‘’“”
International Conference on Mathematics and Natural Sciences (IConMNS 2017) IOP Publishing IOP Conf. Series: Journal of Physics: Conf. Series 1040 (2018) 012050 doi :10.1088/1742-6596/1040/1/012050
method. This method is a part of the seismological statistics. The b-values are obtained by using the equation:
Then a-value can be determined according to the equation:
Figure 1. The Curve of Average Rate Changes Curve with Long Term Average (LTA) Function (Wiemer, 2001).
Based on Figure 1, a curve showing cumulative number changes the seismic rate using the Long Term Average (LTA) function. The curve is plotted for each node. The curve starts from the time (the initial period) and ends at the time (the final period).
The standard deviation Z (z-value) is defined in equation 1.
The data used in this research was taken from BMKG and USGS catalog for West Sumatera and its surroundings. The study area is limited by coordinates 2LU - 4LS and 96BT - 104BT with depth of earthquake less than 350 Km. The observation time period was 1980 - 2015 with earthquake magnitude bigger than 4.0 SR.
The data processing is done with several stages, 1) classify the data from earthquake catalogs, 2) perform dekluster of earthquake, 3) plotting of cumulative number curve and earthquake frequency distribution in order to see the completeness of earthquake data, 4) calculates the-a, b-values, and z-values by using ZMAP version 6.0 software, and than, 5) the spatial distribution of seismotectonic
(2)
𝑎 = log 𝑁 (𝑀≥ 𝑀0) + 𝑙𝑜𝑔(𝑏 ln 10) + 𝑀0𝑏 (3)
The z-values method measures the difference in the seismicity level moving in the time window with the background seismicity using the standard deviation, Z [4]. The aim is to detect a possible period of low seismic anomalies before the mainshock near the epicenter, and to evaluate statistically the ratio of significance of seismic decrease with all possible seismic drops in random locations and times [5]. Measurement z-value is performed using LTA (Long Term Average) function with the aim that the anomaly obtained is not statistically biased [6]. Figure 1 illustrates the observed changes in the mean seismic rate with the LTA function.
4
1234567890 ‘’“”
International Conference on Mathematics and Natural Sciences (IConMNS 2017) IOP Publishing IOP Conf. Series: Journal of Physics: Conf. Series 1040 (2018) 012050 doi :10.1088/1742-6596/1040/1/012050
parameters (values-a and b-values) and z-value was analized by using gridding technique with a 0.1 x 0.1 grid spacing and for every grid the earthquake maximum only 50.
3.Results and Discussion
Data of the earthquake that has been used in this study amounted to 3794 events after the process of decluster and can be seen on figure 2.
Figure 2. Seismicity Map of West Sumatra Region with the Period from 1980 - 2015. (the source of data from BMKG and USGS / NEIC)
High seismicity in West Sumatera region is shown in figure 2. The density of seismicity of West Sumatera is more visible around the island of Nias, to the south of Pagai Island, around the Mentawai Islands and along the active fault zone of Sumatra as well as the subduction pathway. It is suspected that this high seismic density is affected by tectonic activity in West Sumatera. The tectonic activity is a subduction zone located in the western part of Sumatra Island along the coastline, the presence of underwater active faults such as the Mentawai fault and the activity of the Sumatran Fault. Most of the earthquakes caused by the subduction zone and the active fault zone of Sumatra are potentially large and cause damage.
The number of earthquakes that occurred and the time of the incident is shown in figure 3. This curve shows the tendency of earthquake occurrence in West Sumatra region. The tendency of earthquake events to increase from year to year, as shown in figure 4, that between 1980 and 2005 there was little change in seismic activity, whereas after 2005 there was a significant change in seismic activity.
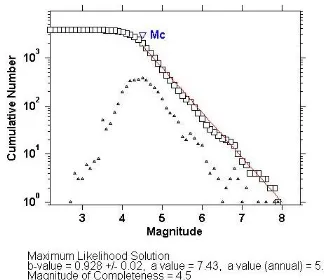
The frequency-magnitude distributions in West Sumatera region is shown in figure 4. On this curve obtained the general value b is about 0.928, while the value of an obtained is about 7.43. The value of Magnitude Completeness (Mc) in West Sumatra region according to the catalog used is 4.5. this indicates that the earthquake catalog used to record well the earthquake with the smallest magnitude of 4.5 in West Sumatra.
Figure 3. Cumulative Number Earthquake with Time Occured
in Period from 1980 to 2015.
Figure 4. The Frequency - Magnitudo Distribution Distribution Curve in
1234567890 ‘’“”
International Conference on Mathematics and Natural Sciences (IConMNS 2017) IOP Publishing IOP Conf. Series: Journal of Physics: Conf. Series 1040 (2018) 012050 doi :10.1088/1742-6596/1040/1/012050
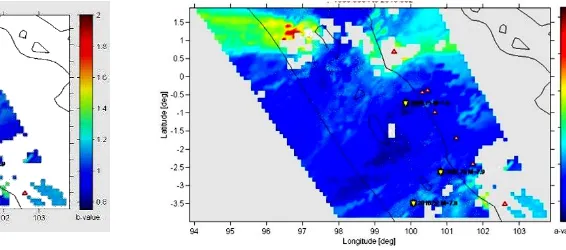
The results of calculating the values of a and b spatially can be seen in figures. 5a and 5b. Figure 5a shows the spatial distribution of b-values in West Sumatra. Based on the mapping there is a low-b anomaly value indicated by blue. This low b-value is near the Sumatra fault zone, subduction line, south of Nias island and in the Mentawai islands. These areas are dynamic seismic zones and potentially significant and destructive earthquakes. Areas that have a low-b value are also called asperities areas, an active seismic area that is still locked or called a locked zone. Locked zone may also cause a significant and destructive earthquake. Therefore, areas with low b values such as the Mentawai Islands, especially the southern island of Pagai and along the active faults of Sumatra should be suspected to experience significant and potentially damaging earthquakes in the future. While areas with a high b-value as seen in the north of Nias Island are referred to as creeping zones, are active fault zones that do not experience energy hoarding and do not experience slippage. This is in accordance with previous research that low b-values are associated with rock stress conditions in the area high, and vice versa [7].
Figure 5a. Map of Distribution Spatial of b-value in West Sumatra Region
Figure 5b. Map of Distribution Spatial of a-value in West Sumatra Region
The spatial distribution of a-values is given by Fig. 5b which shows results almost equal to the spatial distribution of b-values. in Figure 6b it is seen that the low a-values, the blue color, are also seen in the area around the Sumatran fault zone, subduction path, south of Nias Island, and around the Mentawai Islands. Areas with low a-values are indicated to have relatively low seismicity. This low level of seismicity indicates the accumulation of energy (asperities) in the area. low seismicity levels associated with low spatial distribution of b-values. Areas with low seismic activity potentially experience significant earthquakes. In accordance with the previously mentioned that regions with low-b values also have great potential for significant earthquakes. While the high-a-values, as seen in the northern areas of Nias Island, indicate that the area has high seismicity, it is thought that the high seismicity in this area is due to frequent small earthquakes. Areas that often have small earthquakes are less likely to experience significant earthquakes in the future. This is inversely proportional to the rare areas of small earthquakes will potentially experience significant earthquakes later on. [13] This is in accordance with previous research results that low a-values indicate low seismic activity in the region. The lack of seismic activity means the accumulation of energy in this region.
6
1234567890 ‘’“”
International Conference on Mathematics and Natural Sciences (IConMNS 2017) IOP Publishing IOP Conf. Series: Journal of Physics: Conf. Series 1040 (2018) 012050 doi :10.1088/1742-6596/1040/1/012050
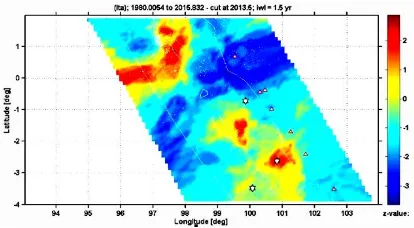
Figure 6. Map of Spatial Distribution of z-value in West Sumatera with Value of Tw was 1.5 year
The relatively low a-values and b-values in the area around the Sumatran fault zone, the subduction path, south of Nias Island, and around the Mentawai Islands indicate that these areas are likely to experience significant earthquakes in the future. This is due to the accumulation of energy in these areas. This accumulation of energy will lead to increased stress conditions in these areas. The decline in seismic activity and the accumulation of this energy will lead to the emergence of a phenomenon that usually always precedes a significant and destructive earthquake. The phenomenon in question is the seismic quiescence phenomenon that has been discussed in the previous paragraph, in the study of z-values.
Based on the observation and analysis that has been done that the phenomenon of seismic quiescence which become the early symptom of significant earthquake happened closely related to seismotectonic parameter (value-a and b-value).
4.Conclusion
Based on the analysis of the relationship between the two seismotectonic parameters and the seismic quiescence phenomenon in West Sumatera, it is concluded that the seismic quiescence phenomenon is related to seismotectonic parameters. This relationship can be seen from the result of the positive spatial distribution of z-values seen around the Mentawai Islands. Low z-values indicate that the area around the Mentawai Islands has decreased significantly in its seismic activity. This significant drop means that seismic activity in the area is reduced (a-low value). The rarity or loss of seismic activity means that in the area experiencing the accumulation of energy causing the level of local rock conditions in the area is also high (low-b value). These three things are closely related to each other and can be used as information to understand the potential of significant and damaging earthquakes in the future.
Acknowledgement
This work was supported by DIPA Universitas Negeri Padang year 2017 number. 1649/UN35.2/PG/2017. We also thank the operators of the BMKG and USGS-NIED for making their earthquake catalog.
References
[1] Natawidjaja D H and Triyoso W 2007 The Sumatran fault zone: from source to hazard Journal of Earthquake and Tsunami 1 21-47
[2] Triyono, R 2015 Ancaman Gempabumi di Sumatera Tidak Hanya Bersumber Dari Mentawai Megathrust. Kepala Stasiun Geofisika Klas I Padang Panjang.
eoffice.bmkg.go.id/dokumen/artikel_Ancaman Gempabumi di Sumatera Tidak Hanya Bersumber dari Mentawai Megathrust
1234567890 ‘’“”
International Conference on Mathematics and Natural Sciences (IConMNS 2017) IOP Publishing IOP Conf. Series: Journal of Physics: Conf. Series 1040 (2018) 012050 doi :10.1088/1742-6596/1040/1/012050
[4] Wiemer S 2001 A software package to analyse seismicity: ZMAP Seismological Research Letters72 373–382
[5] Katsumata K 2011 A Long Term Seismic Quiescence Started 23 Years Before The 2011 of The Pacific Coast of Tohoku Earthquake (M=9.0) Earth Planet Space63 709-712
[6] Sunardi B, Sulastri and Nugraha J 2013 Analisis Periodesitas dan Perubahan Tingkat Kegempaan Wilayah Jawa Barat Berbasis Statistik. Conference Paper. BMKG Pusat 67 - 77 [7] Rohadi S, Grandis H and Ratag M A 2007 Variasi Spasial Seismisitas di Zona Subduksi Jawa
Jurnal Meteorologi dan Geofisika8 42 – 47
[8] Scholz C H 1968 The frequency-magnitude relation of microfracturing in rock and its relation to earthquakes Bull. Seis. Soc. Amer.58 399- 415
[9] Wyss M, Wiemer S and Tsuboi S 1973 Mapping b-value anomalies in the subducting slabs beneath Japan, using the JUNEC data Bull. Seism. Soc. Am. submitted
[10] Gibowicz S J 1973 Variation of the frequency-magnitude relation during earthquake sequence in New Zealand, Bull. Seimol. Soc. Am, 63517 – 528
[11] Wiemer S and Wyss M 1994 Seismic quiescence before the 1993 M=7.5 Landers and M=6.5 Big Bear (California) earthquakes Bull. Seis. Soc. Amer. 84900-916
[12] Gutenberg B and Richter C F 1944 Frequency of earthquake in California Bull. Seismol. Soc. Am. 34185 – 188
[13] Ngadmanto D 2012 Penentuan Potensi Gempabumi Merusak Berdasarkan Parameter